|
|
市場調査レポート
商品コード
1604227
OTTビジネスメッセージングの世界市場:2024-2029年Global OTT Business Messaging Market: 2024-2029 |
||||||
|
|||||||
|
|||||||


| OTTビジネスメッセージングの世界市場:2024-2029年 |
|
出版日: 2024年12月09日
発行: Juniper Research Ltd
ページ情報: 英文
納期: 即日から翌営業日
|

全表示
- 概要
- 目次
OTTビジネスメッセージング:Infobip、Gupshup、Twilioが市場のリーダーに
| 主要統計 | |
|---|---|
| 2024年のOTTビジネスメッセージング総収益: | 24億米ドル |
| 2029年のOTTビジネスメッセージング総収益: | 98億米ドル |
| 2029年のOTTビジネスメッセージ総送信数: | 1兆1,000億通 |
| 予測期間: | 2024-2029年 |
当調査パッケージは、企業のオムニチャネルコミュニケーション戦略におけるOTTビジネスメッセージングの役割に関する分析と実用的な洞察を提供し、CPaaS (Communications Platform-as-a-Service) やOTTメッセージングベンダーなどの主要ステークホルダーがこの多様で複雑な市場を効果的にナビゲートできるように支援します。WhatsApp、WeChat、Messenger、LINE、Telegram、Viber、KakaoTalk、Zaloなど、幅広いOTTビジネスメッセージングチャネルをカバーしています。
WhatsAppの価格改定 (メッセージ単価、無料サービスメッセージ、24時間カスタマーサービス期間内のユーティリティメッセージの復活) や、RCS (リッチコミュニケーションサービス) ビジネスメッセージングの成長がOTTビジネスメッセージング市場に与える影響など、OTTビジネスメッセージング市場の最近の動向に関する詳細な評価も含まれています。また、OTTビジネスメッセージングベンダーがブロードキャストメッセージやチャンネルメッセージ、クリックトゥチャット広告などの機能をどのように活用できるかについても、戦略的提言と分析を提供しています。
また、OTTビジネスメッセージングベンダーが、会話型AIおよびチャットボットサービス、ロケーションベースメッセージングサービス、会話型コマースサービス、顧客データプラットフォーム、スーパーアプリをどのように開発し収益化するのが最善かについても、戦略的提言と分析を提供しています。
主な特徴
- 市場力学:WhatsAppの価格モデルの変更、クリックツーチャット広告の開発、WhatsAppによる国際認証率の拡大、AIチャットボットと会話型AIの開発など、OTTビジネスメッセージング市場の主な動向と事業機会に関する洞察、OTTビジネスメッセージングベンダーが会話型コマース、チャネル、ブロードキャストメッセージ、顧客データプラットフォーム、スーパーアプリの収益化戦略をどのように展開するのが最善かについての戦略的提言と分析が含まれています。
- 主な要点と戦略的提言:OTTビジネスメッセージング市場における主な開発機会や知見を詳細に分析し、収益の拡大とサービスの向上を目指すOTTビジネスメッセージングベンダーのための戦略的提言を掲載しています。
- ベンチマーク業界予測:世界のOTTビジネスメッセージング市場の5年予測を提供します。月間アクティブOTTメッセージングユーザー総数、毎年送信されるOTTメッセージ総数、毎年送信されるOTTビジネスメッセージ総数、OTTビジネスメッセージングからの総収益に関するデータを提供します。広告、バンキング、コンテンツ決済、ヘルスケア、リテール、チケット販売、その他と市場分野別に分けています。
- Juniper ResearchのFuture Leaders'Index:OTTビジネスメッセージングベンダー20<社の能力を評価し、各ベンダーの提供サービスについて市場規模と詳細な分析を行っています。
サンプルビュー
市場データ・予測レポート:
市場動向・戦略レポート:
市場データ・予測レポート
本調査スイートには、17,000以上のデータポイントからなる予測データ一式へのアクセスが含まれています。この調査スイートには以下の指標が含まれています:
- 月間アクティブOTTメッセンジャーアプリユーザー総数
- OTTメッセージ送信総数
- OTTビジネスメッセージ送信総数
- OTTビジネスメッセージングからの総収益
- 市場業種別では、以下の業種を対象としています:広告、バンキング、コンテンツ決済、ヘルスケア、小売、チケット販売、その他
Juniper Researchのインタラクティブ予測 (Excel) には以下の機能があります:
- 統計分析:統計分析:データ期間中の全地域・国について表示される特定の指標を検索できます。グラフは簡単に変更でき、クリップボードへのエクスポートも可能です
- 国別データツール:予測期間中のすべての地域と国の指標を見ることができます。検索バーで表示される指標を絞り込むことができます
- 国別比較ツール:特定の国を選択して比較することができます。このツールには、グラフをエクスポートする機能が含まれています
- What-if分析:3つのインタラクティブなシナリオを通じて、ユーザーは予測の前提条件と比較することができます
目次
市場動向・戦略
第1章 重要ポイントと戦略的推奨事項
- 重要ポイント
- 主要な戦略的推奨事項
第2章 市場情勢
- OTTビジネスメッセージングの主な動向
- RCSビジネスメッセージングの開発がOTTビジネスメッセージング市場に及ぼす影響
- WhatsApp:2025年4月に会話型料金設定を終了、料金設定のシンプルさの重要性を強調
- OTTチャンネル選択における消費者のコントロールがますます重要に
- OTTビジネスメッセージングの主要チャネル
- Messenger
- Telegram
- LINE
- Viber
- KakaoTalk
- Zalo
第3章 将来の機会と市場戦略
- ベンダーにとっての主要な収益化機会と戦略
- チャットボットとLLM
- 会話型コマース
- クリックツーチャット広告
- チャンネルと放送
- スーパーアプリ
- 顧客データプラットフォーム
第4章 国別準備指数
- 国別準備指数:イントロダクション
- 重点市場
- 成長市場
- 新興国市場
競合のリーダーボード
第1章 競合のリーダーボード
第2章 ベンダープロファイル
- ベンダープロファイル
- Bird
- Cequens
- Clickatell
- CM.com
- Comviva
- GMS
- Gupshup
- Infobip
- LINK Mobility
- Monty Mobile
- Route Mobile
- Soprano Design
- Sinch
- Syniverse
- Tata Communications
- Twilio
- Vonage
- Cisco Webex
- Zenvia
- Juniper Researchリーダーボード評価手法
- 制限と解釈
データ・予測
第1章 イントロダクション・調査手法
第2章 市場概要・今後の市場見通し
- OTTメッセージングユーザー総数
- 送信されたOTTビジネスメッセージの総数
- OTTビジネスメッセージングからの総収益
- OTT広告メッセージの総数
- OTT広告メッセージからの総収益
- OTTヘルスケアメッセージの総数
- OTTヘルスケアメッセージからの総収益
- OTTバンキングメッセージの総数
- OTTバンキングメッセージからの総収益
- OTTコンテンツペイメントメッセージの総数
- OTTコンテンツペイメントメッセージからの総収益
- OTTチケットメッセージからの総収益
- OTT小売メッセージの総数
- OTT小売メッセージからの総収益
'OTT Business Messaging: Infobip, Gupshup, and Twilio Revealed as Market Leaders'
| KEY STATISTICS | |
|---|---|
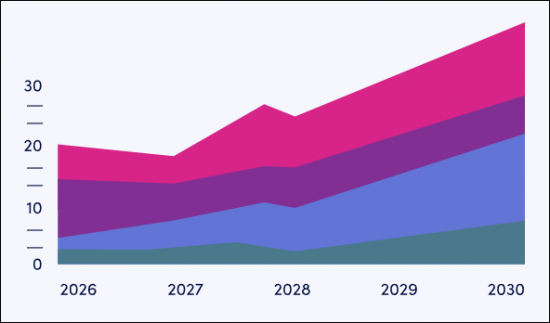
| Total OTT business messaging revenue in 2024: | $2.4bn |
| Total OTT business messaging revenue in 2029: | $9.8bn |
| Total number of OTT business messages sent in 2029: | 1.1tn |
| Forecast period: | 2024-2029 |
Overview
Our "OTT (Over the Top) Business Messaging" research suite provides analysis and actionable insights into the role of OTT business messaging in enterprises' omnichannel communications strategies; enabling key stakeholders such as CPaaS (Communications Platform-as-a-Service) and OTT messaging vendors to effectively navigate this diverse and complex market. The suite covers a wide range of OTT business messaging channels, including WhatsApp, WeChat, Messenger, LINE, Telegram, Viber, KakaoTalk, and Zalo.
Included is a detailed assessment of recent developments in the OTT business messaging market, such as WhatsApp's update to its pricing with the return of price per message, free service messages, and utility messages within the 24-hour customer service period, and how the growth of RCS (Rich Communication Services) business messaging will impact the OTT business messaging market. Alongside this it provides strategic recommendations and analysis of how OTT business messaging vendors can capitalise on features such as broadcast and channel messages, and click-to-chat ads.
The report also provides strategic recommendations and analysis of how OTT business messaging vendors can best develop and monetise conversational AI and chatbot services, location-based messaging services, conversational commerce services, customer data platforms, and super apps.
The market forecast suite includes several different options that can be purchased separately, including access to data mapping and a forecast document, a strategy and trends document detailing critical trends in the market, and strategic recommendations for monetising and developing OTT business messaging solutions and services.
The research suite includes a Competitor Leaderboard, which can be purchased separately; containing analysis and market sizing for 20 leading OTT business messaging vendors, who each provide support for one or more OTT messaging channels.
Collectively, the suite provides a critical tool for understanding the OTT business messaging market, which allows OTT business messaging providers, and other stakeholders, to shape their future strategies for service development and monetisation. Its unparalleled coverage makes this research suite an incredibly useful resource for charting the future of a key telecommunications market.
Key Features
- Market Dynamics: Insights into the key trends and opportunities within the OTT business messaging market, including the changes to WhatsApp's pricing model, the development of click-to-chat ads, the expansion of international authentication rates by WhatsApp, and the development of AI chatbots and conversational AIs. It also includes strategic recommendations and analysis of how OTT business messaging vendors can best develop strategies for monetising conversational commerce, channels and broadcast messages, customer data platforms, and super apps.
- Key Takeaways & Strategic Recommendations: In-depth analysis of key development opportunities and findings within the OTT business messaging market, accompanied by strategic recommendations for OTT business messaging vendors seeking to grow their revenue and improve their offerings.
- Benchmark Industry Forecasts: The suite provides five-year forecasts for the global OTT business messaging market; providing data for the total number of monthly active OTT messaging users, total number of OTT messages sent each year, total number of OTT business messages sent each year, and total revenue from OTT business messaging. This is split by the following market verticals: advertising, banking, content payment, healthcare, retail, ticketing, and other.
- Juniper Research Future Leaders' Index: Key player capability and capacity assessment for 20 OTT business messaging vendors, with market sizing and detailed analysis for each vendor's offering.
SAMPLE VIEW
Market Data & Forecasting Report:
The numbers tell you what's happening, but our written report details why, alongside the methodologies.
Market Trends & Strategies Report:
A comprehensive analysis of the current market landscape, alongside strategic recommendations.
Market Data & Forecasting Report
The market-leading research suite for the OTT Business Messaging market includes access to the full set of forecast data, comprising more than 17,000 datapoints. Metrics in the research suite include:
- Total Number of Monthly Active OTT Messenger App Users
- Total Number of OTT Messages Sent
- Total Number of OTT Business Messages Sent
- Total Revenue from OTT Business Messaging
- Market vertical splits are provided for the following market verticals: Advertising, Banking, Content Payment, Healthcare, Retail, Ticketing, and Other.
Juniper Research's Interactive Forecast Excel contains the following functionality:
- Statistics Analysis: Users benefit from the ability to search for specific metrics, displayed for all regions and countries across the data period. Graphs are easily modified and can be exported to the clipboard.
- Country Data Tool: This tool lets users look at metrics for all regions and countries in the forecast period. Users can refine the metrics displayed via a search bar.
- Country Comparison Tool: Users can select and compare specific countries. The ability to export graphs is included in this tool.
- What-if Analysis: Here, users can compare forecast metrics against their own assumptions, via three interactive scenarios.
Market Trends & Strategies Report
The report thoroughly examines the global "OTT Business Messaging" market, assessing market trends and factors shaping the evolution of these rapidly growing channels for enterprise communications. Alongside these trends, the report delivers a comprehensive analysis of the strategic business opportunities for OTT business messaging vendors, such as CPaaS providers.
The innovative ecosystem report addresses how OTT business messaging vendors can maximise their revenue from OTT business messaging through the development of omnichannel messaging services, chatbots and conversational AI, channels and broadcast messages, and click-to-chat ads.
The innovative ecosystem report addresses how OTT business messaging vendors can best capitalise on key trends and factors affecting the OTT business messaging market, such as the changes in WhatsApp's pricing strategy and its expansion of free messaging, and the growing use of RCS business messaging by enterprises.
It also includes a Country Readiness Index, which assesses the current and future development of the OTT business messaging market in each of the 60 countries included in the market forecast. This provides detailed insight into which markets will offer the greatest revenue opportunities, both at present and over the next five years, enabling effective strategic planning by stakeholders in the OTT business messaging market.
Competitor Leaderboard Report
The Competitor Leaderboard included in this report provides detailed evaluation and market positioning for 20 OTT business messaging vendors. These key companies are positioned as established leaders, leading challengers, or disruptors and challengers, based on a capacity, capability, and product assessment. This includes analysis of the key advantages in the market, future development plans, and key partnerships.
The OTT business messaging Competitor Leaderboard includes the following key vendors:
|
|
Table of Contents
Market Trends & Strategies
1. Key Takeaways & Strategic Recommendations
- 1.1 Key Takeaways
- 1.2 Key Strategic Recommendations
2. Market Landscape
- 2.1. Introduction
- 2.2 Key Trends in OTT Business Messaging
- Figure 2.1: Total Number of OTT Messenger Users (m), Split By 8 Key Regions, 2024-2029
- Figure 2.2: Total OTT Business Messaging Revenue ($m), Split By 8 Key Regions, 2024-2029
- 2.2.2. How the Development of RCS Business Messaging Will Impact the OTT Business Messaging Market
- Figure 2.3: RCS Key Features and Capabilities
- Figure 2.4: Global Growth in OTT Messenger and RCS Users (m), Split By 8 Key Regions, 2024-2029
- 2.2.3. WhatsApp to End Conversational Pricing in April 2025, Highlighting Importance of Simplicity in Pricing
- 2.2.4. Consumer Control Over OTT Channel Selection to be Increasingly Important
- 2.3 Key Channels for OTT Business Messaging
- Figure 2.5: Largest OTT Channel in Each Country
- 2.3.1. WhatsApp
- i. Introduction
- Table 2.6: Key WhatsApp Metrics, 2024
- ii. Business Messaging Pricing
- Table 2.7: Example of Pricing of Different WhatsApp Categories (November 1st 2024)
- iii. WhatsApp Messaging Features
- Figure 2.8: WhatsApp Chat Button
- Figure 2.9: Example of WhatsApp Catalogue
- Figure 2.10: WhatsApp Business Directory
- Figure 2.11: WhatsApp Pay Example
- Figure 2.12: WhatsApp Channels
- i. Introduction
- 2.3.2. WeChat
- i. Introduction
- Table 2.13: WeChat Key Metrics, 2024
- Figure 2.14: WeChat Evolution Over the Years
- ii. WeChat Business Messaging
- i. Introduction
- 2.3.3. Messenger
- i. Introduction
- Table 2.15: Messenger Key Metrics
- ii. Business Messaging
- i. Introduction
- 2.4. Telegram
- i. Introduction
- Table 2.16: Telegram Key Statistics
- ii. Business Messaging
- Figure 2.17: Telegram Business Chatbots
- i. Introduction
- 2.5. LINE
- i. Introduction
- Table 2.18: Global Line Key Statistics
- Figure 2.19: Adding Friends Using LINE Pay
- ii. Business Messaging
- Table 2.20: Three Different Plans for a LINE Official Account
- Figure 2.21: LINE Broadcast Message Example
- Figure 2.22: LINE Rich Menu Feature
- Figure 2.23: Example of LINE Beacon
- i. Introduction
- 2.6. Viber
- i. Introduction
- Table 2.24: Viber Key Statistics in 2024
- ii. Business Messaging
- Figure 2.25: Viber Business Messaging Pricing Models
- Figure 2.26: Examples of Viber Business Messaging Costs (November 2024)
- i. Introduction
- 2.7. KakaoTalk
- i. Introduction
- Table 2.27: KakaoTalk Key Statistics
- ii. Business Messaging
- i. Introduction
- 2.8. Zalo
- i. Introduction
- Table 2.28: Global Zalo Key Statistics in 2024
- ii. Business Messaging
- i. Introduction
3. Future Opportunities and Market Strategies
- 3.1 Key Monetisable Opportunities and Strategies for Vendors
- 3.1.1. Chatbots and LLMs
- Figure 3.1: Total Number of Messaging Chatbots Accessed per Year (m), Split by 8 key Regions, 2023-2028
- 3.1.2. Conversational Commerce
- Figure 3.2: Total Conversational Commerce Revenue ($m), Split By 8 Key Regions, 2023-2028
- 3.1.3. Click-to-Chat Ads
- Figure 3.3: WhatsApp Click-to-Chat Ad Example
- 3.1.4. Channels and Broadcasts
- Figure 3.4: Example of WhatsApp Channel
- 3.1.5. Super Apps
- Figure 3.5: WeChat Store Example
- Figure 3.6: WhatsApp Pay Example
- 3.1.6. Customer Data Platform
- 3.1.1. Chatbots and LLMs
4. Country Readiness Index
- 4.1. Introduction to Country Readiness Index
- Figure 4.1: OTT Business Messaging Country Readiness Index Regional Definitions
- Table 4.2: Juniper Research Country Readiness Index Scoring Criteria
- Figure 4.3: OTT Business Messaging Country Readiness Index: Market Status 2024
- Table 4.4: OTT Business Messaging Country Readiness Index: Market Segments
- 4.2. Focus Market
- Figure 4.5: Select OTT Focus Markets' OTT Messaging Application Penetration Rate (%), 2024-2029
- 4.2.2. Brazil
- Figure 4.6: Total Number of OTT Business Messages Sent in Brazil (bn), 2024-2029
- 4.2.3. China
- Figure 4.7: Total Number of Monthly Active OTT Messaging Users in China (m), 2024-2029
- 4.2.4. India
- Figure 4.8: Total Number of OTT Business Messages Sent in India (bn), 2024-2029
- 4.2.5. Indonesia
- Figure 4.9: Total OTT Business Messaging Revenue in Indonesia ($m), 2024-2029
- 4.3. Growth Markets
- i. The US
- Figure 4.10: Total Revenue from OTT Business Messaging in the US ($m), 2024-2029
- i. The US
- 4.4. Developing Markets
- Table 4.11: Juniper Research's Country Readiness Index Heatmap: North America
- Table 4.12: Juniper Research's Country Readiness Index Heatmap: Latin America
- Table 4.13: Juniper Research's Country Readiness Index Heatmap: West Europe
- Table 4.14: Juniper Research's Country Readiness Index Heatmap: Central & East Europe
- Table 4.15: Juniper Research's Country Readiness Index Heatmap: Far East & China
- Table 4.16: Juniper Research's Country Readiness Index Heatmap: Indian Subcontinent
- Table 4.17: Juniper Research's Country Readiness Index Heatmap: Rest of Asia Pacific
- Table 4.18: Juniper Research's Country Readiness Index Heatmap: Africa & Middle East
Competitor Leaderboard
1. Competitor Leaderboard
- 1.1. Why Read This Report
- Table 1.1: Juniper Research Competitor Leaderboard Vendors and Product Portfolios (One)
- Table 1.2: Juniper Research Competitor Leaderboard Vendors and Product Portfolios (Two)
- Figure 1.3: Juniper Research Competitor Leaderboard: OTT Business Messaging
- Table 1.4: Juniper Research Competitor Leaderboard: OTT Business Messaging Vendors & Positioning
- Table 1.5: Juniper Research Competitor Leaderboard Heatmap: OTT Business Messaging (1 of 2)
- Table 1.6: Juniper Research Competitor Leaderboard Heatmap: OTT Business Messaging (2 of 2)
2. Vendor Profiles
- 2.1. Vendor Profiles
- 2.1.1. Bird
- i. Corporate Information
- ii. Geographical Spread
- iii. Key Clients & Strategic Partnerships
- iv. High-level View of Offerings
- v. Juniper Research's View: Key Strengths & Strategic Development Opportunities
- 2.1.2. Cequens
- i. Corporate Information
- Table 2.1: Cequens' Acquisitions Since 2016
- ii. Geographical Spread
- iii. Key Clients & Strategic Partnerships
- iv. High-level View of Offerings
- v. Juniper Research's View: Key Strengths & Strategic Development Opportunities
- i. Corporate Information
- 2.1.3. Clickatell
- i. Corporate Information
- ii. Geographical Spread
- iii. Key Clients & Strategic Partnerships
- iv. High-level View of Offerings
- v. Juniper Research's View: Key Strengths & Strategic Development Opportunities
- 2.1.4. CM.com
- i. Corporate Information
- Table 2.2: CM.com's Select Financial Information (Euro-m), 2022-2023
- ii. Geographical Spread
- iii. Key Clients & Strategic Partnerships
- iv. High-level View of Offerings
- v. Juniper Research's View: Key Strengths & Strategic Development Opportunities
- i. Corporate Information
- 2.1.5. Comviva
- i. Corporate Information
- Table 2.3: Comviva's Select Financial Information ($m), 2021-2023
- ii. Geographical Spread
- iii. Key Clients & Strategic Partnerships
- iv. High-level View of Offerings
- v. Juniper Research's View: Key Strengths & Strategic Development Opportunities
- i. Corporate Information
- 2.1.6. GMS
- i. Corporate Information
- ii. Geographical Spread
- iii. Key Clients & Strategic Partnerships
- iv. High-level View of Offerings
- v. Juniper Research's View: Key Strengths & Strategic Development Opportunities
- 2.1.7. Gupshup
- i. Corporate Information
- ii. Geographical Spread
- iii. Key Clients & Strategic Partnerships
- iv. High-level View of Offerings
- v. Juniper Research's View: Key Strengths & Strategic Development Opportunities
- 2.1.8. Infobip
- i. Corporate Information
- Table 2.4: Infobip's Acquisitions - April 2021 to Present
- ii. Geographical Spread
- iii. Key Clients & Strategic Partnerships
- iv. High-level View of Offerings
- v. Juniper Research's View: Key Strengths & Strategic Development Opportunities
- i. Corporate Information
- 2.1.9. LINK Mobility
- Table 2.5: LINK Mobility Select Financial Information (NOK 000)
- i. Juniper Research's View: Key Strengths & Strategic Development Opportunities
- 2.1.10. Mitto
- i. Corporate Information
- ii. Geographical Spread
- iii. Key Clients & Strategic Partnerships
- iv. High-level View of Offerings
- v. Juniper Research's View: Key Strengths & Strategic Development Opportunities
- 2.1.11. Monty Mobile
- i. Corporate Information
- ii. Geographical Spread
- iii. Key Clients & Strategic Partnerships
- iv. High-level View of Offerings
- v. Juniper Research's View: Key Strengths & Strategic Development Opportunities
- 2.1.12. Route Mobile
- i. Corporate Information
- Table 2.6: Route Mobile Total Consolidated Revenue (Indian Rupee), 2021-2023
- ii. Geographical Spread
- iii. Key Clients & Strategic Partnerships
- iv. High-level View of Offerings
- Figure 2.7: How OmniCent Works
- v. Juniper Research's View: Key Strengths & Strategic Development Opportunities
- i. Corporate Information
- 2.1.13. Soprano Design
- i. Corporate Information
- Table 2.8: Soprano Design Acquisitions Since 2020
- ii. Geographical Spread
- Figure 2.9: Soprano Design Global Reach and Support Network
- iii. Key Clients & Strategic Partnerships
- Figure 2.10: Soprano Design Global Carrier Partners
- iv. High-level View of Offerings
- v. Juniper Research's View: Key Strengths & Strategic Development Opportunities
- i. Corporate Information
- 2.1.14. Sinch
- i. Corporate Information
- Table 2.11: Sinch Select Financial Information ($m), 2021-2023
- ii. Geographical Spread
- iii. Key Clients & Strategic Partnerships
- iv. High-level View of Offerings
- v. Juniper Research's View: Key Strengths & Strategic Development Opportunities
- i. Corporate Information
- 2.1.15. Syniverse
- Figure 2.12: Syniverse CPaaS Channels
- i. Juniper Research's View: Key Strengths & Strategic Development Opportunities
- 2.1.16. Tata Communications
- i. Corporate Information
- Table 2.13: Tata Communications' Select Financial Information (Indian Rupee in crore), FY 2022-23 & FY 2023-24
- ii. Geographical Spread
- iii. Key Clients & Strategic Partnerships
- iv. High-level View of Offerings
- Figure 2.14: Tata Communications Kaleyra Chatbots
- v. Juniper Research's View: Key Strengths & Strategic Development Opportunities
- i. Corporate Information
- 2.1.17. Twilio
- i. Corporate Information
- Table 2.15: Twilio's Revenue ($m), 2021-2023
- Table 2.16: Twilio Acquisitions, 2020 to Present
- ii. Geographical Spread
- iii. Key Clients & Strategic Partnerships
- iv. High-level View of Offerings
- Figure 2.17: Twilio Programmable Messaging APIs
- v. Juniper Research's View: Key Strengths & Strategic Development Opportunities
- i. Corporate Information
- 2.1.18. Vonage
- i. Corporate Information
- ii. Geographical Spread
- iii. Key Clients & Strategic Partnerships
- iv. High-level View of Offerings
- v. Juniper Research's View: Key Strengths & Strategic Development Opportunities
- 2.1.19. Cisco Webex
- i. Corporate Information
- Table 2.18: Cisco's Financial Information ($m), 2021-2023
- ii. Geographical Spread
- iii. Key Clients & Strategic Partnerships
- iv. High-level View of Offerings
- Figure 2.19: Cisco Low-code Flow Builder
- v. Juniper Research's View: Key Strengths & Strategic Development Opportunities
- i. Corporate Information
- 2.1.20. Zenvia
- i. Corporate Information
- Figure 2.20: Select Financial Information Zenvia Financial Year 2022 to Financial Year 2023 (BRL Million)
- ii. Geographical Spread
- iii. Key Clients & Strategic Partnerships
- iv. High-level View of Offerings
- v. Juniper Research's View: Key Strengths & Strategic Development Opportunities
- i. Corporate Information
- 2.1.1. Bird
- 2.2. Juniper Research Leaderboard Assessment Methodology
- 2.3. Limitations & Interpretations
- Table 2.21: Juniper Research Competitor Leaderboard: Global OTT Business Messaging Market, 2024-2029
Data & Forecasting
1. Introduction and Methodology
- 1.1. Introduction
- Figure 1.1: Proportion of Smartphone Users Using OTT Messaging Applications (%), 2024-2029
- 1.2. Forecast Methodology
- Figure 1.2: OTT Business Messaging Forecast Methodology
2. Market Summary and Future Market Outlook
- 2.1. Total Number of OTT Messaging Users
- Figure & Table 2.1: Total Number of OTT Messaging Users (m), Split By 8 Key Regions, 2024-2029
- 2.2. Total Number of OTT Business Messages Sent
- Figure & Table 2.2: Total Number of OTT Business Messages Sent (m), Split By 8 Key Regions, 2024-2029
- 2.3. Total Revenue from OTT Business Messaging
- Figure & Table 2.3: Total Revenue from OTT Business Messaging ($m), Split By 8 Key Regions, 2024-2029
- 2.4. Total Number of OTT Advertising Messages
- Figure & Table 2.4: Total Number of OTT Advertising Messages (m), Split By 8 Key Regions, 2024-2029
- 2.5. Total Revenue from OTT Advertising Messages
- Figure & Table 2.5: Total Revenue from OTT Advertising Messages ($m), Split By Key Regions, 2024-2029
- 2.6. Total Number of OTT Healthcare Messages
- Figure & Table 2.6: Total Number of OTT Healthcare Messages (m), Split By 8 Key Regions, 2024-2029
- 2.7. Total Revenue from OTT Healthcare Messages
- Figure & Table 2.7: Total Revenue from OTT Healthcare Messages ($m), Split By 8 Key Regions, 2024-2029
- 2.8. Total Number of OTT Banking Messages
- Figure & Table 2.8: Total Number of OTT Banking Messages (m), Split By 8 Key Regions, 2024-2029
- 2.9. Total Revenue from OTT Banking Messages
- Figure & Table 2.9: Total Revenue from OTT Banking Messages ($m), Split By 8 Key Regions, 2024-2029
- 2.10. Total Number of OTT Content Payment Messages
- Figure & Table 2.10: Total Number of OTT Content Payment Messages (m), Split By 8 Key Regions, 2024-2029
- 2.11. Total Revenue from OTT Content Payment Messages
- Figure & Table 2.11: Total Revenue from OTT Content Payment Messages ($m), Split By 8 Key Regions, 2024-2029
- 2.12. Total Revenue from OTT Ticketing Messages
- Figure & Table 2.12: Total Revenue from OTT Ticketing Messages ($m), Split By 8 Key Regions, 2024-2029
- 2.13. Total Number of OTT Retail Messages
- Figure & Table 2.13: Total Number of OTT Retail Messages (m), Split By 8 Key Regions, 2024-2029
- 2.14. Total Revenue from OTT Retail Messages
- Figure & Table 2.14: Total Revenue from OTT Retail Messages ($m), Split By 8 Key Regions, 2024-2029
