
キャリアビリングの世界市場:2024-2029年
Global Carrier Billing Market: 2024-2029- 発行日
- ページ情報
- 英文
- 納期
- 即日から翌営業日
- 商品コード
- 1589863
- 翻訳ツール提供対象 PDF対応AI翻訳ツールの無料貸し出しサービスのご利用が可能です
- 通信/IT関連専門 通信/IT関連専門を専門とする市場調査会社です。
概要
| 主要統計 | |
|---|---|
| 2024年のキャリアビリングによるエンドユーザー支出総額: | 751億米ドル |
| 2029年のキャリアビリングによるエンドユーザー支出総額: | 1,369億米ドル |
| 予測データポイント: | 34,200 |
| 予測期間: | 2024-2029年 |
当調査スイートでは、世界のキャリアビリングの市場を調査し、デジタルウォレット、クレジットカード、BNPL (Buy Now, Pay Later)、A2A (Account-to-Account) 決済などの決済方法が、キャリアビリングの浸透にどのような影響を与えているかを評価しています。さらに今後予想されるPSD3 (ペイメントサービスディレクトリ3) がキャリアビリング決済に与える影響の仮説を立てています。
当調査レポートは、APIの標準化など進化する技術がキャリアビリングの将来にどのような影響を与えるかについても詳細な分析を提供しており、ネットワーク事業者、加盟店、規制当局、アグリゲーターなどのステークホルダーが主要な影響因子、動向、投資機会を理解できるようになっています。この調査ではまた、キャリアビリングユーザーの総数、支出額、収益額を以下の分野別に分けた包括的な予測も特徴としています:
- デバイス別:
- フィーチャーフォン
- スマートフォン
- タブレット
- 市場別:
- デジタルコンテンツ
- デジタルゲーム
- デジタルビデオ
- デジタル音楽
- デジタルライフスタイル
- 電子出版
- フィジカルグッズ別:
- ギャンブル
- チケット
主な特徴
- 主な要点と戦略的提言:キャリアビリング市場における主な発展機会と調査結果を詳細に分析し、モバイルネットワーク事業者とキャリアビリングアグリゲータに対し、どの地域、市場、サービスをどのようにターゲットとすべきかについての戦略的提言を行っています。
- 将来の成長機会:キャリアビリングの今後の成長戦略について、市場別に評価するだけでなく、決済、セキュリティ、APIの状況も評価し、不正行為、フィンテック、エコシステムの相互運用性の向上などの要因が今後5年間で市場にどのような影響を与えるかを明らかにしています。
- Juniper Researchの競合リーダーボード:主要キャリアビリングアグリゲータ12社の能力とキャパシティを評価します。
- ベンチマーク業界予測:キャリアビリングユーザーの総数、キャリアビリング経由のエンドユーザー支出総額、キャリアビリング決済による収益総額の5年予測を提供します。これらの予測は、3つの主要デバイス および8つの主要市場に分類されています。
サンプルビュー
市場データ&予測レポート
市場動向&戦略レポート:
市場データ&予測レポート
本調査スイートには、75の表と34,000を超えるデータポイントの予測データ一式へのアクセスが含まれています。主な指標は以下の通りです:
- キャリアビリングユーザー総数
- キャリアビリング総支出額
- キャリアビリング経由のオペレーター請求総収益
Juniper Researchのインタラクティブ予測 (Excel) には以下の機能があります:
- 統計分析:データ期間中のすべての地域と国について表示されます。グラフは簡単に変更でき、クリップボードにエクスポートできます。
- 国別データツール:このツールでは、予測期間中のすべての地域と国の指標を調べることができます。検索バーで表示される指標を絞り込むことができます。
- 国別比較ツール:特定の国を選択して比較することができます。このツールには、グラフをエクスポートする機能が含まれています。
- What-if分析:5つのインタラクティブなシナリオで、ユーザーは予測の前提条件と比較することができます。
目次
市場動向・戦略
第1章 重要ポイントと戦略的推奨事項
- 重要ポイント
- 戦略的推奨事項
第2章 市場展望と将来の機会
- イントロダクション
- 現在の市場見通し
- キャリアビリング市場の動向
- リッチメッセージング
- コンテンツ配信チャネル
- キャリアビリング市場の課題
第3章 将来の成長機会
- キャリアビリング市場のセグメント別の機会
- デジタルゲーム
- デジタルビデオ
- デジタルミュージック
- デジタルライフスタイルコンテンツ
- チャリティ寄付・クラウドファンディング
- デジタルチケット
- フィジカルグッズ
第4章 決済・セキュリティ・APIの情勢
- API情勢:イントロダクション
- GSMAオープンゲートウェイとCAMARA
- キャリア決済詐欺
- キャリア決済と決済情勢
- 他の決済方法がキャリア決済に与える影響
競合リーダーボード
第1章 Juniper Researchの競合リーダーボード
第2章 ベンダープロファイル
- Allopass
- Bango
- Boku
- Degica
- Digital Virgo
- DIMOCO Payments
- Fonix
- Infomedia
- NTH Mobile
- PM Connect
- SLA Digital
- Telecoming
- リーダーボード評価手法
データ・予測
第1章 イントロダクション・予測手法
第2章 総市場価値
- キャリア決済ユーザー総数
- キャリア決済による総支出額
- キャリア決済による総支出額 (業界別)
- キャリアビリングオペレータによるオペレータ請求収益
第3章 デバイスの使用状況の分割
- キャリア決済によるエンドユーザーの総支出額 (デバイスタイプ別)
第4章 デジタルコンテンツ&コマース
- デジタルコンテンツからのキャリアビリング収益
- デジタルゲーム
- デジタルビデオ
- デジタルライフスタイル
- 電子出版
第5章 新興産業カテゴリー
- リモートフィジカルグッズ
- キャリア決済で購入されたリモートフィジカルグッズ
- キャリア決済で購入されたリモートフィジカルグッズに対するエンドユーザーの総支出額
- モバイルギャンブル
- デジタルチケット
目次
| KEY STATISTICS | |
|---|---|
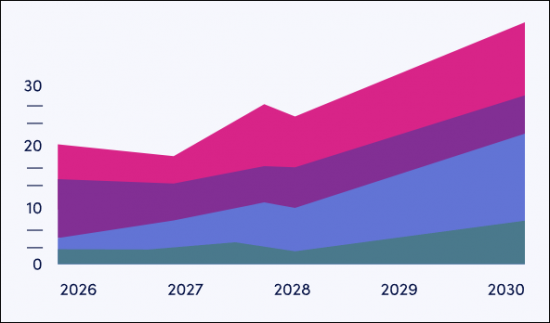
| Total end user spend via carrier billing in 2024: | $75.1bn |
| Total end user spend via carrier billing in 2029: | $136.9bn |
| Forecast datapoints: | 34,200 |
| Forecast period: | 2024-2029 |
Overview
Our new "Carrier Billing" research suite provides an in-depth analysis on how this payment technology is developing in both mature and evolving markets. Its utility across key market verticals, including digital content (music, video, games, lifestyle, and ePublishing), is quantified in our accompanying market forecasts. Additionally, emerging market opportunities across developing verticals, including digital ticketing, gambling, and physical goods, are also discussed.
The report assesses how other established payment methods, including digital wallets, credit cards, BNPL (Buy Now, Pay Later), and A2A (Account-to-Account) payments, are impacting the penetration of carrier billing across multiple markets. Furthermore, Juniper Research leverages its expertise to hypothesise the impact of the anticipated PSD3 (Payment Service Directory 3) on carrier billing payments.
The carrier billing research reports provide a detailed analysis on how evolving technologies, including the standardisation of APIs, will impact the future of carrier billing; enabling stakeholders from networks operators, merchants, regulators and aggregators to understand the major factors, trends and investment opportunities available. The carrier billing market growth research also features a comprehensive forecast suite, with total carrier billing users, spend and operator-billed revenue split by:
- Device:
- Featurephones
- Smartphones
- Tablets
- Market Vertical:
- Digital Content
- Digital Games
- Digital Videos
- Digital Music
- Digital Lifestyle
- ePublishing
- Physical Goods:
- Gambling
- Ticketing
This report provides in-depth forecasts on how carrier billing adoption is impacting the payments market in 60 key countries over the next five years and leverages interviews with key carrier billing aggregators to quantify this growth.
Key Features
- Key Takeaways & Strategic Recommendations:An in-depth analysis of key development opportunities and findings within the carrier billing market, accompanied by strategic recommendations for mobile network operators and carrier billing aggregators on which regions, markets and services to target and how.
- Future Growth Opportunities: Not only does this report suite assess the future growth strategies of carrier billing via market vertical, (digital games, digital video, digital music, digital lifestyle content, charity donations, digital ticketing, and physical goods), but it also evaluates the payments, security and API landscape to uncover how factors such as fraud, fintech and increased ecosystem interoperability will impact the carrier billing market over the next five years.
- Juniper Research Competitor Leaderboard: As the carrier billing market undergoes consolidation, our Competitor Leaderboard assesses key players' capabilities and capacity for 12 leading carrier billing aggregators.
- Benchmark Industry Forecasts: 5-year forecasts are provided for total carrier billing users, total end-user spend via carrier billing, and total operator-billing revenue from carrier billing transactions. These forecasts are split by three key devices (smartphones, featurephones and tablets) and eight key markets (digital games, music, video, lifestyle, ePublishing, and physical goods, gambling and ticketing).
SAMPLE VIEW
Market Data & Forecasting Report:
The numbers tell you what's happening, but our written report details why, alongside the methodologies.
MMarket Trends & Strategies Report:
A comprehensive analysis of the current market landscape, alongside strategic recommendations.
Market Data & Forecasting Report
The market-leading research suite for the carrier billing market includes access to the full set of forecast data of 75 tables and over 34,000 datapoints. Key metrics in the research suite include:
- Total Carrier Billing Users
- Total Carrier Billing Spend
- Total Operator-billed Revenue from Carrier Billing
Additionally, this forecast splits total end-user spend via carrier billing and operator-billed revenue by:
- Device:
- Featurephones
- Smartphones
- Tablets
- Market Vertical:
- Digital Content
- Digital Games
- Digital Videos
- Digital Music
- Digital Lifestyle
- ePublishing
- Physical Goods:
- Gambling
- Ticketing
Juniper Research's Interactive Forecast Excel contains the following functionality:
- Statistics Analysis: Users benefit from the ability to search for specific metrics; displayed for all regions and countries across the data period. Graphs are easily modified and can be exported to the clipboard.
- Country Data Tool: This tool lets users explore metrics for all regions and countries in the forecast period. Users can refine the metrics displayed via a search bar.
- Country Comparison Tool: Users can select and compare specific countries. The ability to export graphs is included in this tool.
- What-if Analysis: Here, users can compare forecast metrics against their own assumptions, featuring five interactive scenarios.
Market Trends & Strategies Report
This report thoroughly examines the carrier billing market landscape in detail; assessing key market trends, industries, and factors shaping its evolution. Additionally, this research report provides an assessment on the impact of fraud, APIs and the wider fintech landscape in the carrier billing market over the next five years, leveraging expertise from leading carrier billing aggregators.
The report delivers a comprehensive analysis on the future trends impacting this market, including the subscription economy, super bundling, rich messaging, content distribution channels, the regulation landscape, and challenges including payment limitations, high transaction fees and merchant adoption.
Competitor Leaderboard Report
The Competitor Leaderboard report provides a detailed evaluation and market positioning for 12 leading vendors in the carrier billing space. The following vendors are positioned as established leaders, leading challengers, or disruptors and challengers, based on capacity and capability assessments:
|
|
This report is centred around the Juniper Research Competitor Leaderboard; a vendor positioning tool that provides an at-a-glance view of the competitive landscape in a specific market, backed by a robust methodology.
Table of Contents
Market Trends & Strategies
1. Key Takeaways & Strategic Recommendations
- 1.1. Key Takeaways
- 1.2. Strategic Recommendations
2. Market Outlook & Future Opportunities
- 2.1. Introduction
- Table 2.1: Key Differences Between Carrier Billing and DCB
- Figure 2.2: Global Number of SIMs (m) & Proportion of the Global Population that are Banked (%), Split by 8 Key Regions, 2024-2029
- Figure 2.3: Carrier Billing Stakeholder Ecosystem & Benefits
- Table 2.4: Key Differences Between Carrier Billing Platforms and Aggregators
- Figure 2.5: Global Smartphone Users (m) & Proportion of the Population That Are Internet Users (%), Split by 8 Key Regions, 2024-2029
- 2.1.1. Current Market Outlook
- Figure 2.6: Total End-user Spend via Carrier Billing ($m), Split by 8 Key Regions, 2024-2029
- 2.1.2. Carrier Billing Market Trends
- i. Growth in Subscriptions
- Figure 2.7: Total Subscription Revenue per Annum in 2024 ($593 billion), Split by Category
- ii. Super Bundling
- Figure 2.8: Super Bundling
- i. Growth in Subscriptions
- 2.1.3. Rich Messaging
- Figure 2.9: Total Number of RCS Business Messages (m), Split by Message Type
- 2.1.4. Content Distribution Channels
- Figure 2.10: Total End-user Spend via Carrier Billing ($m), Split by 5 Key Categories, 2024-2029
- 2.1.5. Carrier Billing Market Challenges
- i. Payment Limitations & Regulation Landscape
- Table 2.11: Key Differences Between PS2 and PSD3
- ii. High Transaction Fees
- Figure 2.12: Global Operator-billed Revenue from Carrier Billing Transactions
- iii. Merchant Adoption
- i. Payment Limitations & Regulation Landscape
3. Future Growth Opportunities
- 3.1. Carrier Billing Market Segment Opportunities
- Figure 3.1: Total End-user Spend via Carrier Billing ($m), Split by Market Segment, 2024-2029
- 3.1.1. Digital Games
- Figure 3.2: Mobile Game Monetisation Methods
- i. iGaming
- Figure 3.3: Total End-user Carrier Billing Spend on Digital Games in 2024 ($30.8 billion), Split by 8 Key Regions
- 3.1.2. Digital Video
- 3.1.3. Digital Music
- 3.1.4. Digital Lifestyle Content
- 3.1.5. Charity Donations & Crowdfunding
- 3.1.6. Digital Ticketing
- Figure 3.4: Total Ticketing Spend Made via Carrier Billing in 2029 ($16.0 billion), Split by 8 Key Regions
- 3.1.7. Physical Goods
- i. Asia
- ii. Germany
- Figure 3.5: Total End-user Carrier Billing Spend on Remote Physical Goods ($m), Split by 7 Key Countries, 2023-2029
- iii. Growth in Transport Infrastructure
4. Payments, Security & API Landscape
- 4.1. Introduction to the API Landscape
- 4.1.1. GSMA Open Gateway & CAMARA
- Figure 4.1: GSMA Open Gateway Architecture
- Figure 4.2: Mobile Operators Signed Up to Open Gateway
- Figure 4.3: Average Carrier Billing Spend per User per Annum ($), Split by 8 Key Regions, 2024-2029
- i. Potential Challenges in the Deployment of CAMARA APIs
- 4.1.2. Carrier Billing Fraud
- 4.1.3. Carrier Billing and the Payment Landscape
- Figure 4.4: Advantages and Disadvantages of Different Payment Types
- Figure 4.5: Total Number of Unique Mobile Subscribers & Global Banked Individuals in 2024 (m), Split by 8 Key Regions
- 4.1.4. Influence of Other Payment Types on Carrier Billing
- i. The impact of A2A Payments on Carrier Billing
- Figure 4.6: Card-based Payments vs A2A Payments Ecosystems
- ii. BNPL (Buy Now, Pay Later)
- iii. Digital Wallets
- Figure 4.7: Digital Wallet Funding Types
- i. The impact of A2A Payments on Carrier Billing
- 4.1.1. GSMA Open Gateway & CAMARA
Competitor Leaderboard
1. Juniper Research Competitor Leaderboard
- 1.1. Why Read This Report
- Table 1.1: Juniper Research Competitor Leaderboard Carrier Billing Vendors Included & Product Portfolio
- Figure 1.2: Juniper Research Competitor Leaderboard: Carrier Billing Vendors
- Table 1.3: Juniper Research Competitor Leaderboard: Vendors & Positioning
- Table 1.4: Juniper Research Competitor Leaderboard Heatmap: Carrier Billing Vendors
2. Vendor Profiles
- 2.1. Carrier Billing Providers Vendor Profiles
- 2.1.1. Allopass
- i. Corporate
- ii. Geographical Spread
- iii. Key Clients & Strategic Partnerships
- iv. High-level View of Offerings
- Figure 2.1: Allopass' Payment Platform
- v. Juniper Research's View: Key Strengths & Strategic Development Opportunities
- 2.1.2. Bango
- i. Juniper Research's View: Key Strengths & Strategic Development Opportunities
- 2.1.3. Boku
- i. Juniper Research's View: Key Strengths & Strategic Development Opportunities
- 2.1.4. Degica
- i. Corporate Information
- ii. Geographical Spread
- iii. Key Clients & Strategic Partnerships
- iv. High-level View of Offerings
- v. Juniper Research's View: Key Strengths & Strategic Development Opportunities
- 2.1.5. Digital Virgo
- i. Corporate
- ii. Geographical Spread
- Figure 2.2: Map of Digital Virgo's Locations, Split by Locations (Dark) and Connections (Light)
- iii. Key Clients & Strategic Partnerships
- iv. High-level View of Offerings
- v. Juniper Research's View: Key Strengths & Strategic Development Opportunities
- 2.1.6. DIMOCO Payments
- i. Corporate
- ii. Geographical Spread
- iii. Key Clients & Strategic Partnerships
- iv. High-level View of Offerings
- v. Juniper Research's View: Key Strengths & Strategic Development Opportunities
- 2.1.7. Fonix
- i. Juniper Research's View: Key Strengths & Strategic Development Opportunities
- 2.1.8. Infomedia
- i. Corporate
- ii. Geographical Spread
- iii. Key Clients & Strategic Partnerships
- iv. High-level View of Offerings
- v. Juniper Research's View: Key Strengths & Strategic Development Opportunities
- 2.1.9. NTH Mobile
- i. Corporate
- ii. Geographical Spread
- iii. Key Clients & Strategic Partnerships
- Table 2.3: NTH Mobile's Most Recent Publicised Partnerships
- iv. High-level View of Offerings
- v. Juniper Research's View: Key Strengths & Strategic Development Opportunities
- 2.1.10. PM Connect
- i. Corporate
- ii. Geographical Spread
- iii. Key Clients & Strategic Partnerships
- iv. High-level View of Offerings
- v. Juniper Research's View: Key Strengths & Strategic Development Opportunities
- 2.1.11. SLA Digital
- i. Corporate
- ii. Geographical Spread
- iii. Key Clients & Strategic Partnerships
- iv. High-level View of Offerings
- v. Juniper Research's View: Key Strengths & Strategic Development Opportunities
- 2.1.12. Telecoming
- i. Corporate
- ii. Geographic Spread
- iii. Key Clients & Strategic Partnerships
- iv. High-level View of Offering
- v. Juniper Research's View: Key Strengths & Strategic Development Opportunities
- 2.1.1. Allopass
- 2.2. Juniper Research Leaderboard Assessment Methodology
- 2.2.1. Limitations & Interpretation
- Table 2.4: Juniper Research Competitor Leaderboard Scoring Criteria
- 2.2.1. Limitations & Interpretation
Data & Forecasting
1. Introduction & Forecast Methodology
- 1.1. Introduction
- Figure 1.1: Proportion of the Population who Use Carrier Billing Services (%), Split by 8 Key Regions, 2024-2029
- 1.2. Methodology and Assumptions
- Figure 1.2: Carrier Billing in Content & Commerce: Forecast Methodology
- Figure 1.3: Carrier Billing Ticketing: Forecast Methodology
- Figure 1.4: Carrier Billing for Physical Goods: Forecast Methodology
- Figure 1.5: Carrier billing for Gambling: Forecast Methodology
2. Total Market Value
- 2.1. Total Carrier Billing Users
- Figure & Table 2.1: Total Carrier Billing Users (m), Split by 8 Key Regions, 2024-2029
- 2.2. Total Carrier Billing Spend
- Figure & Table 2.2: Total End-user Spend via Carrier Billing ($m), Split by 8 Key Regions, 2024-2029
- 2.3. Total Carrier Billing Spend, Split by Industry
- Figure & Table 2.3: Total End-user Spend via Carrier Billing ($m), Split by Category, 2024-2029
- 2.4. Operator-billed Revenue from Carrier Billing
- Figure & Table 2.4: Total Operator-billed Revenue from Carrier Billing Spend ($m), Split by 8 Key Regions, 2024-2029
3. Device Usage Splits
- 3.1. Total End-user Spend via Carrier Billing, Split by Device Type
- Figure & Table 3.1: Total End-user Carrier Billing Spend ($m), Split by Device, 2024-2029
- Table 3.2: All Carrier Billed Spend as a Percentage of Global Spend, By Country and Region (%), 2024-2029
4. Digital Content & Commerce
- 4.1. Total Carrier Billing Revenue from Digital Content
- Figure & Table 4.1: Total End-user Carrier Billing Spend on Digital Content and Commerce ($m), Split by 8 Key Regions 2024-2029
- Table 4.2: Share of End-user Carrier Billing Spend on Content & Commerce (%), Split by Category, 2024-2029
- 4.1.1. Total Digital Games Spend via Carrier Billing
- Figure & Table 4.3: Total End-user Carrier Billing Spend on Digital Games ($m), Split by 8 Key Regions, 2024-2029
- 4.1.2. Total Digital Video Spend via Carrier Billing
- Figure & Table 4.4: Total End-user Carrier Billing Spend on Digital Videos ($m), Split by 8 Key Regions, 2024-2029
- 4.1.3. Total Digital Video Spend via Carrier Billing
- Figure 4.5: Total End-user Carrier Billing Spend on Digital Music ($m), Split by Key Regions, 2024-2029
- Table 4.6: Average Digital Music Spend per User ($), Split by 8 Key Regions, 2024-2028
- 4.1.4. Total Digital Lifestyle Spend via Carrier Billing
- Figure & Table 4.7: Total End-user Carrier Billing Spend on Digital Lifestyle Content ($m), Split by 8 Key Regions, 2024-2029
- Figure 4.8: Average Digital Lifestyle Spend per Person ($), Split by 8 Key Regions, 2024-2029
- 4.1.5. Total ePublishing Spend via Carrier Billing
- Figure & Table 4.9: Total End-user Carrier Billing Spend on ePublishing ($m), Split by 8 Key Regions, 2024-2029
- Table 4.10: Proportion of End-user Carrier Billing Spend on Content and Commerce Attributable to ePublishing (%), Split by 8 Key Regions, 2024-2029
5. Emerging Industry Categories
- 5.1. Remote Physical Goods
- 5.1.1. Total Remote Physical Goods Purchased via Carrier Billing
- Figure & Table 5.1: Total Volume of Remote Physical Goods Purchases Made via Carrier Billing (m), Split by 8 Key Regions, 2024-2029
- Table 5.2: Proportion of Remote Physical Goods Purchases Made via Carrier Billing (%), Split by 8 Key Regions, 2024-2029
- 5.1.2. Total End-users' Spend on Remote Physical Goods via Carrier Billing
- Figure & Table 5.3: Total End-user Carrier Billing Spend on Remote Physical Goods ($m), Split by 8 Key Regions, 2024-2029
- 5.1.1. Total Remote Physical Goods Purchased via Carrier Billing
- 5.2. Total Mobile Gambling Spend via Carrier Billing
- Figure & Table 5.4: Total Mobile Casino Gambling Wager Value Made via Carrier Billing per Annum ($m), Split by 8 Key Regions, 2024-2029
- 5.3. Total Digital Ticketing Spend via Carrier Billing
- Figure & Table 5.5: Total Digital Ticketing Spend Made via Carrier Billing per Annum ($m), Split by 8 Key Regions, 2024-2029
- 発行日
- 発行
- Juniper Research Ltd
- ページ情報
- 英文
- 納期
- 即日から翌営業日


