|
|
市場調査レポート
商品コード
1548968
AdTech (広告技術) の世界市場:2024-2029年Global AdTech Market: 2024-2029 |
||||||

|
|||||||
|
|||||||


| AdTech (広告技術) の世界市場:2024-2029年 |
|
出版日: 2024年09月03日
発行: Juniper Research Ltd
ページ情報: 英文
納期: 即日から翌営業日
|

全表示
- 概要
- 目次
| 主要統計 | |
|---|---|
| 2024年の総市場価値 | 272億米ドル |
| 2029年の総市場価値 | 435億米ドル |
| 2024年から2029年の市場成長率 | 60% |
| 予測期間 | 2024-2029年 |
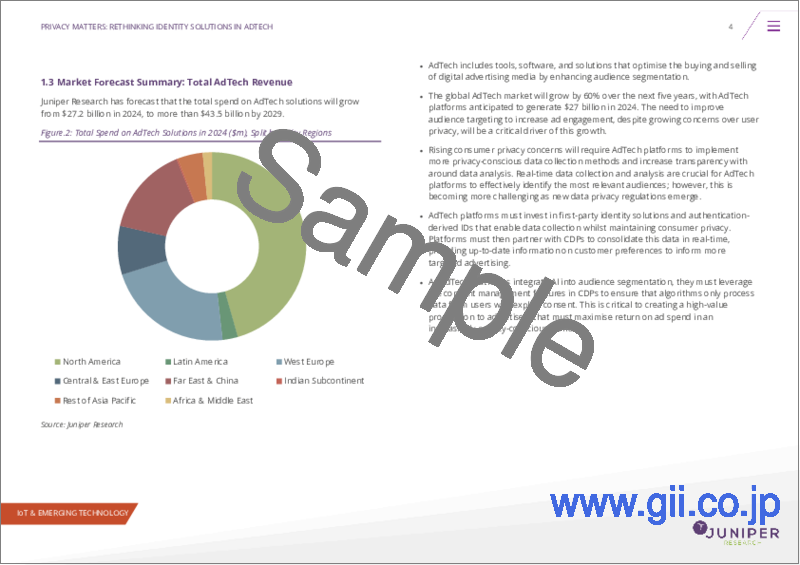
世界のAdTech支出は2029年には435億米ドルに達する
当調査パッケージは、AdTech (広告技術) 市場を詳細に分析し、この成長市場の主な促進要因を取り上げ、ベンダーがこの市場成長を最大限に活用できるよう戦略的提言を提供します。また、プログラマティック広告へのシフトや、AIや機械学習が市場に与える影響についても調査しています。
また、広告詐欺、プライバシー規制、持続可能性への圧力の高まりなど、市場が直面する主な課題、主要企業17社の競合企業リーダーボード、デジタル広告を利用する企業の総数やAdTechへの総支出額に関するデータと予測、主要なデジタル広告チャネルや地域別の市場規模なども掲載しています。
主な特徴
- 主要な要点と戦略的提言:AdTech市場の主要な調査結果を包括的に分析し、AdTechプラットフォームのステークホルダーに戦略的提言を提供します。
- 市場動向と促進要因:デジタル広告サービスに対する企業の需要増加や、広告キャンペーンを最適化するためのAIや機械学習の活用など、市場促進要因を含むAdTech市場の主要動向についての洞察。また、広告詐欺やプライバシー規制など、AdTech市場が直面する課題を取り上げ、SSPとDSPのSWOT分析も行っています。
- ベンチマーク業界予測:AdTech市場の概要には、各広告チャネル (モバイル&アプリ内、オンライン、コネクテッドTV、DOOH) の総支出額と、AdTechに起因する総支出額の世界予測を掲載しています。
- Juniper Research競合リーダーボード:AdTech市場の主要17ベンダーの製品とポジショニング、能力とキャパシティの評価をご覧いただけます
市場データと予測
当調査スイートには、34の表と15,500以上のデータポイントからなる予測データ一式へのアクセスが含まれています。この調査スイートには以下の指標が含まれます:
- デジタル広告を利用する企業の総数
- デジタル広告への総支出額
- AdTechへの総支出額
- アドフラウド別損失総額
Juniper Researchインタラクティブ予測エクセルには以下の機能があります:
- 統計分析:特定の指標を検索することができ、データ期間中のすべての地域と国で表示されます。グラフは簡単に変更でき、クリップボードへのエクスポートも可能です。
- 国別データツール:このツールでは、予測期間中のすべての地域と国の指標を見ることができます。検索バーで表示する指標を絞り込むことができます。
- 国別比較ツール:ユーザーは国を選択し、特定の国についてそれぞれを比較することができます。このツールには、グラフをエクスポートする機能が含まれています。
- What-if分析:5つのインタラクティブなシナリオを通じて、ユーザーは予測の前提条件と比較することができます。
サンプルビュー
市場動向と予測PDFレポート:
現在の市場情勢を包括的に分析し、戦略的提言や予測のウォークスルーも掲載
目次
第1章 重要ポイントと戦略的推奨事項
- 重要ポイント
- 戦略的推奨事項
第2章 将来の市場見通し
- 今後の市場見通し
- プログラマティック広告への移行
- AIと機械学習がAdTech市場に与える影響
- ビッグデータがAdTech市場に与える影響
- コネクテッドTV
- AdTech市場が直面する課題
- ターゲット広告のためのユーザーの特定
- 広告詐欺
- AIアルゴリズムとプライバシーの透明性
- 持続可能性への圧力の高まり
- 主要な広告技術のSWOT分析
- SSP
- DSP
第3章 JuniperResearchの競合リーダーボード
- AdTechベンダーは将来の収益成長のために新興デジタル広告市場に注力する必要がある
第4章 ベンダープロファイル
- Adform
- Adobe
- Amazon
- Basis Technologies
- Criteo
- Equativ
- Google Marketing Platform
- Infillion
- InMobi
- Mediaocean
- Meta Platforms
- Microsoft
- NextRoll
- Nexxen
- The Trade Desk
- Yahoo Advertising
- Zeta
- リーダーボード評価手法
- 制限と解釈
第5章 市場予測と重要なポイント
- AdTech:概要
- AdTechの調査手法
- デジタル広告を利用する企業
- AdTechへの投資額
- 広告詐欺による損失
- モバイル&アプリ内
- 調査手法
- 支出額
- AdTechによるモバイル&アプリ内広告費
- オンライン広告
- 調査手法
- 支出額
- AdTechによるオンライン広告費
- コネクテッドTV広告
- 調査手法
- 支出額
- AdTechによるCTV広告費
- DOOH広告
- 調査手法
- 支出額
- AdTechによるDOOH広告費
| KEY STATISTICS | |
|---|---|
| Total market value in 2024: | $27.2bn |
| Total market value in 2029: | $43.5bn |
| 2024 to 2029 market growth: | 60% |
| Forecast period: | 2024-2029 |
'AdTech Spend to Reach $43.5 Billion Globally by 2029'
Overview
Our "AdTech" research suite provides an in-depth analysis of the advertising technology market; addressing the major drivers of this growing market, and offers strategic recommendation so that vendors can best capitalise on this market growth. It investigates the shift to programmatic advertising and the impact that AI and machine learning are having on the market.
Additionally, it identifies the key challenges facing the market, including advertising fraud, privacy regulations, and increased sustainability pressures. The research provides an overview of 17 major players within the AdTech market, and positions vendors as Established Leaders, Leading Challengers, or Disruptors & Challenges via the Juniper Research Competitor Leaderboard. It also provides data and forecasts for the total number of businesses using digital advertising and total spend on AdTech, including market size by region, and includes a split by 4 key digital advertising channels:
- Connected TV
- DOOH (Digital out of Home)
- Mobile & In-App
- Online
The suite includes both a data deliverable; sizing the market and providing key forecast data across 60 countries, accompanied by a strategy and trends report; delivering a complete assessment of the key trends, challenges and recommendations for stakeholders within the AdTech market. Together, they provide an essential tool for a comprehensive understanding of this evolving market; enabling AdTech vendors to shape their future strategy.
Key Features
- Key Takeaways & Strategic Recommendations: Comprehensive analysis of the key findings for the AdTech market, accompanied by strategic recommendations for stakeholders from AdTech platforms.
- Market Dynamics: Insights into key trends within the AdTech market, including key market drivers featuring the increased demand from businesses for digital advertising services and the use of AI and machine learning to optimise advertising campaigns. It also addresses the challenges facing the AdTech market, including ad fraud and privacy regulations, and provides a SWOT analysis of SSPs (supply-side platforms) and DSPs (demand-side platforms).
- Benchmark Industry Forecasts: The overview of the AdTech market includes global forecasts for total spend across the different advertising channels (mobile & in-app, online, connected TV, and DOOH, and total spend which is attributed to AdTech.
- Juniper Research Competitor Leaderboard: Key player product and positioning, and capability and capacity assessment for 17 vendors within the AdTech market, via the Juniper Research Competitor Leaderboard:
- Adform
- Adobe
- Amazon Ads
- Basis Technologies
- Criteo
- Equativ
- Infillion
- InMobi
- Mediaocean
- Meta
- Microsoft
- NextRoll
- Nexxen
- The Trade Desk
- Yahoo Advertising
- Zeta
Market Data & Forecasts
The market-leading research suite for the "AdTech" market includes access to the full set of forecast data of 34 tables and over 15,500 datapoints. Metrics in the research suite include:
- Total Number of Businesses Using Digital Advertising
- Total Spend on Digital Advertising
- Total Spend on AdTech
- Total Losses due to Ad Fraud
Metrics are provided for the following key channels:
- Mobile & In-App
- Online
- Connected TV
- DOOH (Digital out of Home)
Juniper Research Interactive Forecast Excel contains the following functionality:
- Statistics Analysis: Users benefit from the ability to search for specific metrics; displayed in for all regions and countries across the data period. Graphs are easily modified and can be exported to the clipboard.
- Country Data Tool: This tool lets users look at metrics for all regions and countries in the forecast period. Users can refine the metrics displayed via a search bar.
- Country Comparison Tool: Users can select countries and compare each of them for specific countries. The ability to export graphs is included in this tool.
- What-if Analysis: Here, users can compare forecast metrics against their own assumptions, via 5 interactive scenarios
SAMPLE VIEW
Market Trends & Forecasts PDF Report:
A comprehensive analysis of the current market landscape, alongside strategic recommendations and a walk-through of the forecasts.
Table of Contents
1. Key Takeaways & Strategic Recommendations
- 1.1.1. Key Takeaways
- 1.1.2. Strategic Recommendations
2. Future Market Outlook
- 2.1. Introduction
- Figure 2.1: Advertising Ecosystem
- 2.2. Future Market Outlook
- Figure 2.2: Total Spend on AdTech Solutions in 2024 ($m), Split by 8 Key Regions
- 2.2.1. The Shift to Programmatic Advertising
- 2.2.2. The Impact of AI and Machine Learning on the AdTech Market
- 2.2.3. How Big Data Will Impact the AdTech Market
- 2.2.4. Connected TV
- Figure 2.3: Total Spend on CTV Advertising in 2024 ($m), Split by 8 Key Regions
- 2.3. Challenges Facing the AdTech Market
- 2.3.1. Identifying Users for Targeted Advertising
- 2.3.2. Ad Fraud
- Figure 2.4: Top 10 Countries with the Highest Losses to Ad Fraud in 2024 ($m)
- Figure 2.5: How Fraud Impacts Each Stage of the Advertising Journey
- 2.3.3. Transparency of AI Algorithms and Privacy
- 2.3.4. Increasing Sustainability Pressures
- 2.4. SWOT Analysis of Key Advertising Technologies
- 2.4.1. SSPs
- i. Strengths
- ii. Weaknesses
- iii. Opportunities
- iv. Threats
- 2.4.2. DSPs
- i. Strengths
- ii. Weaknesses
- iii. Opportunities
- iv. Threats
- 2.4.1. SSPs
3. Juniper Research Competitor Leaderboard
- AdTech Vendors Must Focus on Emerging Digital Advertising Markets for Future Revenue Growth
- Table 3.1: Juniper Research Competitor Leaderboard: Vendors & Product Portfolio
- Figure 3.2: Juniper Research Competitor Leaderboard: AdTech
- Source: Juniper ResearchTable 3.3: Juniper Research Competitor Leaderboard: Vendors & Positioning
- Table 3.4: Juniper Research Competitor Leaderboard Heatmap: AdTech Vendors
4. Vendor Profiles
- 4.1. AdTech Vendor Profiles
- 4.1.1. Adform
- i. Corporate Information
- ii. Geographical Spread
- Figure 4.1: Adform Global Presence
- iii. Key Clients & Strategic Partnerships
- iv. High-level View of Offerings
- v. Juniper Research's View: Key Strengths & Strategic Development Opportunities
- 4.1.2. Adobe
- i. Corporate Information
- Table 4.2: Adobe's Select Financial Information ($m), 2022-2023
- Table 4.3: Adobe's Acquisitions, 2018-Present
- ii. Geographical Spread
- iii. Key Clients & Strategic Partnerships
- iv. High-level View of Offerings
- v. Juniper Research's View: Key Strengths & Strategic Development Opportunities
- i. Corporate Information
- 4.1.3. Amazon
- i. Corporate Information
- Table 4.4: Amazon's Key Acquisitions 2014-present
- ii. Geographical Spread
- iii. Key Clients & Strategic Partnerships
- iv. High-level View of Offerings
- v. Juniper Research's View: Key Strengths & Strategic Development Opportunities
- i. Corporate Information
- 4.1.4. Basis Technologies
- i. Corporate Information
- ii. Geographical Spread
- iii. Key Clients & Strategic Partnerships
- iv. High-level View of Offerings
- v. Juniper Research's View: Key Strengths & Strategic Development Opportunities
- 4.1.5. Criteo
- i. Corporate Information
- Table 4.5: Criteo's Select Financial Information ($m), 2022-2023
- ii. Geographical Spread
- iii. Key Clients & Strategic Partnerships
- iv. High-level View of Offerings
- v. Juniper Research's View: Key Strengths & Strategic Development Opportunities
- i. Corporate Information
- 4.1.6. Equativ
- i. Corporate Information
- Table 4.6: Equativ's Acquisitions 2019-Present
- ii. Geographical Spread
- iii. Key Clients & Strategic Partnerships
- iv. High-level View of Offerings
- v. Juniper Research's View: Key Strengths & Strategic Development Opportunities
- i. Corporate Information
- 4.1.7. Google Marketing Platform
- i. Corporate Information
- Table 4.7: Google's Acquisitions, 2020-Present
- ii. Geographical Spread
- iii. Key Clients & Strategic Partnerships
- iv. High-level View of Offerings
- v. Juniper Research's View: Key Strengths & Strategic Development Opportunities
- i. Corporate Information
- 4.1.8. Infillion
- i. Corporate Information
- Table 4.8: Infillion's Acquisitions 2022-present
- ii. Geographical Spread
- iii. Key Clients & Strategic Partnerships
- iv. High-level View of Offerings
- v. Juniper Research's View: Key Strengths & Strategic Development Opportunities
- i. Corporate Information
- 4.1.9. InMobi
- i. Corporate Information
- Table 4.9: InMobi's Acquisitions 2019-present
- ii. Geographical Spread
- iii. Key Clients & Strategic Partnerships
- iv. High-level View of Offerings
- v. Juniper Research's View: Key Strengths & Strategic Development Opportunities
- i. Corporate Information
- 4.1.10. Mediaocean
- i. Corporate Information
- Table 4.10: Mediaocean's Acquisitions 2022-present
- ii. Geographical Spread
- iii. Key Clients & Strategic Partnerships
- iv. High-level View of Offerings
- v. Juniper Research's View: Key Strengths & Strategic Development Opportunities
- i. Corporate Information
- 4.1.11. Meta Platforms
- i. Corporate Information
- Table 4.11: Meta's Relevant Acquisitions, 2013-Present
- Table 4.12: Meta's Select Financial Information ($m), 2022-2023
- ii. Geographical Spread
- iii. Key Clients & Strategic Partnerships
- iv. High-level View of Offerings
- v. Juniper Research's View: Key Strengths & Strategic Development Opportunities
- i. Corporate Information
- 4.1.12. Microsoft
- i. Corporate Information
- Table 4.13: Microsoft's Key Acquisitions 2019-Present
- ii. Geographical Spread
- iii. Key Clients & Strategic Partnerships
- iv. High-level View of Offerings
- v. Juniper Research's View: Key Strengths & Strategic Development Opportunities
- i. Corporate Information
- 4.1.13. NextRoll
- i. Corporate Information
- ii. Geographical Spread
- iii. Key Clients & Strategic Partnerships
- Figure 4.15: RollWorks' Technology Partner Ecosystem
- iv. High-level View of Offerings
- v. Juniper Research's View: Key Strengths & Strategic Development Opportunities
- 4.1.14. Nexxen
- i. Corporate Information
- Table 4.16: Nexxen Select Financial Information ($m), 2021-2022
- ii. Geographical Spread
- iii. Key Clients & Strategic Partnerships
- iv. High-level View of Offerings
- Figure 4.17: Nexxen's Unified Platform
- v. Juniper Research's View: Key Strengths & Strategic Development Opportunities
- i. Corporate Information
- 4.1.15. The Trade Desk
- i. Corporate Information
- Table 4.18: The Trade Desk's Select Financial Information ($m), 2022-2023
- ii. Geographical Spread
- iii. Key Clients & Strategic Partnerships
- iv. High-level View of Offerings
- v. Juniper Research's View: Key Strengths & Strategic Development Opportunities
- i. Corporate Information
- 4.1.16. Yahoo Advertising
- i. Corporate Information
- ii. Geographical Spread
- iii. Key Clients & Strategic Partnerships
- iv. High-level View of Offerings
- v. Juniper Research's View: Key Strengths & Strategic Development Opportunities
- 4.1.17. Zeta
- i. Corporate Information
- Table 4.19: Zeta's Acquisitions, 2019-Present
- ii. Geographical Spread
- iii. Key Clients & Strategic Partnerships
- iv. High-level View of Offerings
- v. Juniper Research's View: Key Strengths & Strategic Development Opportunities
- i. Corporate Information
- 4.1.1. Adform
- 4.2. Juniper Research Leaderboard Assessment Methodology
- 4.3. Limitations & Interpretations
- Table 4.20: Juniper Research Competitor Leaderboard Scoring Criteria
5. Market Forecasts & Key Takeaways
- 5.1. AdTech Summary
- 5.1.1. AdTech Summary Methodology
- Figure 5.1: AdTech Summary Forecast Methodology
- 5.1.2. Businesses Using Digital Advertising
- Figure & Table 5.2: Total Number of Businesses Using Digital Advertising (m), Split by 8 Key Regions, 2024-2029
- 5.1.3. Spend on AdTech
- Figure & Table 5.3: Total Spend on AdTech ($m), Split by 8 Key Regions, 2024-2029
- 5.1.4. Ad Fraud Losses
- Figure & Table 5.4: Total Losses due to Ad Fraud ($m), Split by 8 Key Regions, 2024-2029
- 5.1.1. AdTech Summary Methodology
- 5.2. Mobile & In-App
- 5.2.1. Mobile & In-App Methodology
- Figure 5.5: Mobile Advertising Forecast Methodology
- 5.2.2. Spend on Mobile & In-App Advertising
- Figure & Table 5.6: Total Spend on Mobile Ads ($m), Split by 8 Key Regions, 2024-2029
- 5.2.3. Mobile & In-App Advertising Spend Attributed to AdTech
- Figure & Table 5.7: Total Mobile Ad Spend which is attributed to AdTech ($m), Split by 8 Key Regions, 2024-2029
- 5.2.1. Mobile & In-App Methodology
- 5.3. Online Advertising
- 5.3.1. Online Advertising Methodology
- Figure 5.8: Online Advertising Forecast Methodology
- 5.3.2. Spend on Online Advertising
- Figure & Table 5.9: Total Spend on Online Ads ($m), Split by 8 Key Regions, 2024-2029
- 5.3.3. Online Advertising Spend Attributed to AdTech
- Figure & Table 5.10: Total Online Ad Spend which is attributed to AdTech ($m), Split by 8 Key Regions, 2024-2029
- 5.3.1. Online Advertising Methodology
- 5.4. Connected TV Advertising
- 5.4.1. Connected TV Advertising Methodology
- Figure 5.11: CTV Advertising Forecast Methodology
- 5.4.2. Spend on CTV Advertising
- Figure & Table 5.12: Total Spend on CTV Ads ($m), Split by 8 Key Regions, 2024-2029
- 5.4.3. CTV Advertising Spend Attributed to AdTech
- Figure & Table 5.13: Total CTV Ad Spend which is attributed to AdTech ($m), Split by 8 Key Regions, 2024-2029
- 5.4.1. Connected TV Advertising Methodology
- 5.5. DOOH Advertising
- 5.5.1. DOOH Advertising Methodology
- Figure 5.14: DOOH Advertising Forecasting Methodology
- 5.5.2. Spend on DOOH Advertising
- Figure & Table 5.15: Total Spend on DOOH Ads ($m), Split by 8 Key Regions, 2024-2029
- 5.5.3. DOOH Advertising Spend Attributed to AdTech
- Figure & Table 5.16: Total DOOH Ad Spend which is attributed to AdTech ($m), Split by 8 Key Regions, 2024-2029
- 5.5.1. DOOH Advertising Methodology
