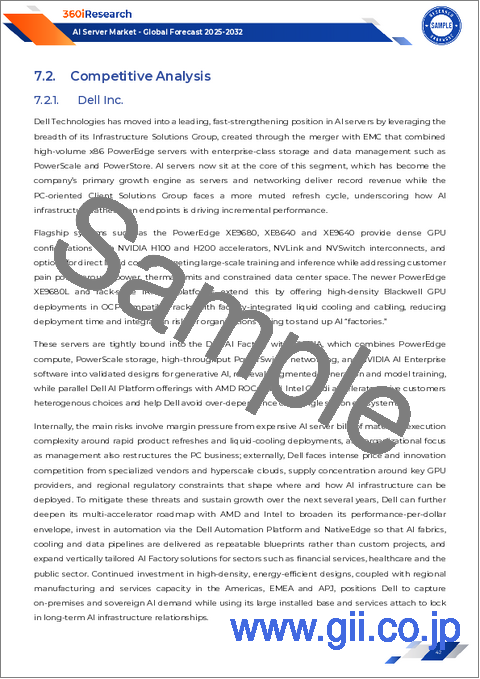
デフォルト表紙
市場調査レポート
商品コード
1718461

AIサーバー市場:プロセッサー、エンドユーザー、アプリケーション、デプロイメントモード別-2025-2030年の世界予測

AI Server Market by Processor, End-User, Application, Deployment Mode - Global Forecast 2025-2030


出版日
発行
360iResearch
ページ情報
英文 188 Pages
納期
即日から翌営業日
カスタマイズ可能
適宜更新あり
価格
価格表記: USDを日本円(税抜)に換算
本日の銀行送金レート: 1USD=144.03円
AIサーバー市場:プロセッサー、エンドユーザー、アプリケーション、デプロイメントモード別-2025-2030年の世界予測
出版日: 2025年04月01日
発行: 360iResearch
ページ情報: 英文 188 Pages
納期: 即日から翌営業日
GIIご利用のメリット
  • 全表示
  • 概要
  • 図表
  • 目次
概要

AIサーバー市場は、2024年には504億8,000万米ドルとなり、2025年には597億8,000万米ドル、CAGR19.58%で成長し、2030年には1,476億5,000万米ドルに達すると予測されています。

主な市場の統計
基準年 2024 504億8,000万米ドル
推定年 2025 597億8,000万米ドル
予測年 2030 1,476億5,000万米ドル
CAGR(%) 19.58%

人工知能技術の進化はコンピューティングに新時代をもたらし、AIサーバーがデジタルトランスフォーメーションのバックボーンになりつつあります。ダイナミックな進歩と絶え間ない効率性の追求を特徴とするこの業界において、AIサーバー市場はイノベーションの最前線に立っています。世界中の組織が、データ中心の意思決定を推進し、複雑な機械学習業務をサポートするために、これらの強力なサーバーを活用しています。本レポートでは、現在の情勢を包括的に分析し、主要動向、市場力学の変化、競合環境を再定義する戦略的考察に言及しています。

最近の動向では、AIサーバーのパフォーマンスとスケーラビリティを強化する先進的なハードウェアアーキテクチャと最適化されたソフトウェアフレームワークの統合が急速に進んでいます。意思決定者は今、分散アーキテクチャとクラウドベースのソリューションが従来のコンピューティングモデルをどのように再構築しつつあるのかを理解することに、これまで以上に注力しています。世界企業がデジタルトランスフォーメーションの旅を続ける中、彼らは今日の処理要件を満たすだけでなく、AI主導の明日の世界の需要を予測するソリューションを求めています。

このイントロダクションでは、画期的なテクノロジーの導入と戦略的投資の相互作用が、新たな機会と課題を同程度に生み出している市場を詳細に調査するための舞台を用意しました。本レポートの以下のセクションでは、AIサーバー分野を形成する諸勢力をより深く掘り下げ、市場セグメンテーション、地域分析、企業洞察、実行可能な提言を組み合わせて、業界のリーダーや利害関係者に充実した視点を提供します。

AIサーバー市場の変革

AIサーバー市場は、業界の情勢を大きく変える変革期を迎えています。プロセッサーアーキテクチャーの最先端の進歩は、AIアルゴリズムの絶え間ない進化とともに、計算能力の再定義につながっています。従来の集中型データセンターのパラダイムは、より多くの企業がハイブリッド・分散型インフラへとシフトするにつれ、再評価されつつあります。この移行は、適応的なリソース管理とネットワークの俊敏性が重視されるようになり、運用コストを削減しながらパフォーマンスを最適化できるようになったことが影響しています。

この進化に寄与している主な要因には、クラウドベースのインフラの統合とエッジコンピューティングの加速があります。これらの要因によって、リアルタイム処理を必要とするアプリケーションにとって不可欠な要件である、遅延を最小限に抑えた高速なサービス提供が可能になりつつあります。また、AIを活用したアナリティクスの人気が高まっていることも、サーバーがデータ処理だけでなく、ほぼリアルタイムでの学習や適応も担う革新的なコンピューティング・モデルの採用を後押ししています。

さらに、環境に優しいソリューションを求める世界の需要に応えるため、業界各社は再生可能エネルギー源や持続可能な技術への投資を増やしています。レガシー・コンピューティング・システムから、より高いスループットと優れたエネルギー効率を提供する、より堅牢なプラットフォームへの移行は、より弾力的で応答性の高い市場への道を開いています。従来のモデルがAIと機械学習が支配する未来への道を歩む中、企業は、変革がオプションではなく、生存と競争力にとって不可欠であるという極めて重要な岐路に立たされています。

AIサーバー市場の主なセグメンテーション洞察

市場セグメンテーションを詳しく見ると、AIサーバー領域を多角的に理解するのに役立つ複雑な層が見えてくる。プロセッサに基づく分析では、市場が特定用途向け集積回路(Application-Specific Integrated Circuit)、フィールドプログラマブルゲートアレイ(Field Programmable Gate Arrays)、グラフィックスプロセッシングユニット(Graphics Processing Units)にまたがって調査される多様な技術エコシステムが浮き彫りにされます。これらのプロセッサは、それぞれ異なる方法で技術革新を推進し、特定の計算需要に対応する独自の機能を提供します。

エンドユーザー別のセグメンテーションでは、クラウドサービスプロバイダー、企業、政府機関の異なるニーズを考慮した市場分析により、この理解をさらに深めます。各顧客セグメントには、拡張性と柔軟性に優れたアーキテクチャの必要性から、サイバー脅威が増大する中でのセキュリティ・プロトコルの強化まで、独自の課題や要件が存在します。これらのエンドユーザーは、AIサーバーの展開と進歩の基盤となる重要な柱であり、カスタマイズと運用効率を重視しています。

アプリケーション別の市場セグメンテーション研究では、コンピュータビジョン、ジェネレーティブAI、機械学習、自然言語処理などの領域における技術的基盤について検証します。ここでは、膨大な量のデータをリアルタイムで処理する必要性によってイノベーションが推進され、自律型システム、予測分析、会話型AIにおける画期的な進歩を可能にしています。これらのアプリケーションの急速な普及は、専門的なAIソリューションが多様な業界に大きな影響を与え、成長と技術的収束を促していることを示しています。

最後に、クラウドベースかオンプレミスかという導入形態による区分は、さまざまな運用上の嗜好に対応するAIサーバー・ソリューションの柔軟性と適応性に光を当てています。クラウドベースのデプロイメントが拡張性とメンテナンス・オーバーヘッドの削減を約束する一方で、オンプレミスのシステムは、データ・セキュリティの強化と低レイテンシーを必要とする組織にとって依然として不可欠です。これらのセグメンテーションの洞察は、現在の市場状況を反映するだけでなく、将来の革新と拡大のためのロードマップを提供する多次元的なフレームワークを形成しています。

目次

第1章 序文

第2章 調査手法

第3章 エグゼクティブサマリー

第4章 市場の概要

第5章 市場洞察

  • 市場力学
    • 促進要因
      • パーソナライズされたユーザーエクスペリエンスにおけるAIの利用増加
      • 企業アプリケーションにおける人工知能技術の導入増加
      • さまざまな分野でスケーラブルなデータストレージソリューションの需要が高まっている
    • 抑制要因
      • エネルギーコストの増加と熱課題
    • 機会
      • 金融機関におけるサイバーセキュリティ対策強化のためのAI技術の活用
      • AIと機械学習の進歩
    • 課題
      • 潜在的な脆弱性とサイバー脅威によるAIサーバーのセキュリティに関する懸念
  • 市場セグメンテーション分析
    • プロセッサ:柔軟性と拡張性により、複雑なAI計算にはGPUが人気が高い
    • アプリケーション:自動車やヘルスケアでの普及により、コンピュータービジョンにおけるAIサーバーの採用が急増
  • ポーターのファイブフォース分析
  • PESTEL分析
    • 政治的
    • 経済
    • 社会
    • 技術的
    • 法律上
    • 環境

第6章 AIサーバー市場プロセッサー別

  • 特定用途向け集積回路(ASIC)
  • フィールドプログラマブルゲートアレイ(FPGA)
  • グラフィックスプロセッシングユニット(GPU)

第7章 AIサーバー市場:エンドユーザー別

  • クラウドサービスプロバイダー
  • 企業
  • 政府機関

第8章 AIサーバー市場:用途別

  • コンピュータービジョン
  • 生成AI(GenAI)
  • 機械学習
  • 自然言語処理

第9章 AIサーバー市場:展開モード別

  • クラウドベース
  • オンプレミス

第10章 南北アメリカのAIサーバー市場

  • アルゼンチン
  • ブラジル
  • カナダ
  • メキシコ
  • 米国

第11章 アジア太平洋地域のAIサーバー市場

  • オーストラリア
  • 中国
  • インド
  • インドネシア
  • 日本
  • マレーシア
  • フィリピン
  • シンガポール
  • 韓国
  • 台湾
  • タイ
  • ベトナム

第12章 欧州・中東・アフリカのAIサーバー市場

  • デンマーク
  • エジプト
  • フィンランド
  • フランス
  • ドイツ
  • イスラエル
  • イタリア
  • オランダ
  • ナイジェリア
  • ノルウェー
  • ポーランド
  • カタール
  • ロシア
  • サウジアラビア
  • 南アフリカ
  • スペイン
  • スウェーデン
  • スイス
  • トルコ
  • アラブ首長国連邦
  • 英国

第13章 競合情勢

  • 市場シェア分析, 2024
  • FPNVポジショニングマトリックス, 2024
  • 競合シナリオ分析
  • 戦略分析と提言

企業一覧

  • ADLINK Technology Inc.
  • Advanced Micro Devices, Inc.
  • ASUSTeK Computer Inc.
  • Baidu, Inc.
  • Cerebras Systems Inc.
  • Cisco Systems, Inc.
  • Dataknox Solutions, Inc.
  • Dell Inc.
  • Fujitsu Limited
  • GeoVision Inc.
  • Hewlett Packard Enterprise Company
  • Huawei Technologies Co., Ltd.
  • IEIT SYSTEMS
  • Inspur Group
  • Intel Corporation
  • Lenovo
  • M247 Europe S.R.L.
  • Microsoft Corporation
  • MiTAC Computing Technology Corporation
  • NVIDIA Corporation
  • Oracle Corporation
  • Quanta Computer lnc.
  • SNS Network
  • Super Micro Computer, Inc.
  • Wistron Corporation
図表

LIST OF FIGURES

  • FIGURE 1. AI SERVER MARKET MULTI-CURRENCY
  • FIGURE 2. AI SERVER MARKET MULTI-LANGUAGE
  • FIGURE 3. AI SERVER MARKET RESEARCH PROCESS
  • FIGURE 4. AI SERVER MARKET SIZE, 2024 VS 2030
  • FIGURE 5. GLOBAL AI SERVER MARKET SIZE, 2018-2030 (USD MILLION)
  • FIGURE 6. GLOBAL AI SERVER MARKET SIZE, BY REGION, 2024 VS 2025 VS 2030 (USD MILLION)
  • FIGURE 7. GLOBAL AI SERVER MARKET SIZE, BY COUNTRY, 2024 VS 2025 VS 2030 (USD MILLION)
  • FIGURE 8. GLOBAL AI SERVER MARKET SIZE, BY PROCESSOR, 2024 VS 2030 (%)
  • FIGURE 9. GLOBAL AI SERVER MARKET SIZE, BY PROCESSOR, 2024 VS 2025 VS 2030 (USD MILLION)
  • FIGURE 10. GLOBAL AI SERVER MARKET SIZE, BY END-USER, 2024 VS 2030 (%)
  • FIGURE 11. GLOBAL AI SERVER MARKET SIZE, BY END-USER, 2024 VS 2025 VS 2030 (USD MILLION)
  • FIGURE 12. GLOBAL AI SERVER MARKET SIZE, BY APPLICATION, 2024 VS 2030 (%)
  • FIGURE 13. GLOBAL AI SERVER MARKET SIZE, BY APPLICATION, 2024 VS 2025 VS 2030 (USD MILLION)
  • FIGURE 14. GLOBAL AI SERVER MARKET SIZE, BY DEPLOYMENT MODE, 2024 VS 2030 (%)
  • FIGURE 15. GLOBAL AI SERVER MARKET SIZE, BY DEPLOYMENT MODE, 2024 VS 2025 VS 2030 (USD MILLION)
  • FIGURE 16. AMERICAS AI SERVER MARKET SIZE, BY COUNTRY, 2024 VS 2030 (%)
  • FIGURE 17. AMERICAS AI SERVER MARKET SIZE, BY COUNTRY, 2024 VS 2025 VS 2030 (USD MILLION)
  • FIGURE 18. UNITED STATES AI SERVER MARKET SIZE, BY STATE, 2024 VS 2030 (%)
  • FIGURE 19. UNITED STATES AI SERVER MARKET SIZE, BY STATE, 2024 VS 2025 VS 2030 (USD MILLION)
  • FIGURE 20. ASIA-PACIFIC AI SERVER MARKET SIZE, BY COUNTRY, 2024 VS 2030 (%)
  • FIGURE 21. ASIA-PACIFIC AI SERVER MARKET SIZE, BY COUNTRY, 2024 VS 2025 VS 2030 (USD MILLION)
  • FIGURE 22. EUROPE, MIDDLE EAST & AFRICA AI SERVER MARKET SIZE, BY COUNTRY, 2024 VS 2030 (%)
  • FIGURE 23. EUROPE, MIDDLE EAST & AFRICA AI SERVER MARKET SIZE, BY COUNTRY, 2024 VS 2025 VS 2030 (USD MILLION)
  • FIGURE 24. AI SERVER MARKET SHARE, BY KEY PLAYER, 2024
  • FIGURE 25. AI SERVER MARKET, FPNV POSITIONING MATRIX, 2024

LIST OF TABLES

  • TABLE 1. AI SERVER MARKET SEGMENTATION & COVERAGE
  • TABLE 2. UNITED STATES DOLLAR EXCHANGE RATE, 2018-2024
  • TABLE 3. GLOBAL AI SERVER MARKET SIZE, 2018-2030 (USD MILLION)
  • TABLE 4. GLOBAL AI SERVER MARKET SIZE, BY REGION, 2018-2030 (USD MILLION)
  • TABLE 5. GLOBAL AI SERVER MARKET SIZE, BY COUNTRY, 2018-2030 (USD MILLION)
  • TABLE 6. AI SERVER MARKET DYNAMICS
  • TABLE 7. GLOBAL AI SERVER MARKET SIZE, BY PROCESSOR, 2018-2030 (USD MILLION)
  • TABLE 8. GLOBAL AI SERVER MARKET SIZE, BY APPLICATION-SPECIFIC INTEGRATED CIRCUIT (ASICS), BY REGION, 2018-2030 (USD MILLION)
  • TABLE 9. GLOBAL AI SERVER MARKET SIZE, BY FIELD PROGRAMMABLE GATE ARRAYS (FPGAS), BY REGION, 2018-2030 (USD MILLION)
  • TABLE 10. GLOBAL AI SERVER MARKET SIZE, BY GRAPHICS PROCESSING UNITS (GPUS), BY REGION, 2018-2030 (USD MILLION)
  • TABLE 11. GLOBAL AI SERVER MARKET SIZE, BY END-USER, 2018-2030 (USD MILLION)
  • TABLE 12. GLOBAL AI SERVER MARKET SIZE, BY CLOUD SERVICE PROVIDERS, BY REGION, 2018-2030 (USD MILLION)
  • TABLE 13. GLOBAL AI SERVER MARKET SIZE, BY ENTERPRISES, BY REGION, 2018-2030 (USD MILLION)
  • TABLE 14. GLOBAL AI SERVER MARKET SIZE, BY GOVERMENT ORGANIZATIONS, BY REGION, 2018-2030 (USD MILLION)
  • TABLE 15. GLOBAL AI SERVER MARKET SIZE, BY APPLICATION, 2018-2030 (USD MILLION)
  • TABLE 16. GLOBAL AI SERVER MARKET SIZE, BY COMPUTER VISION, BY REGION, 2018-2030 (USD MILLION)
  • TABLE 17. GLOBAL AI SERVER MARKET SIZE, BY GENERATIVE AI (GENAI), BY REGION, 2018-2030 (USD MILLION)
  • TABLE 18. GLOBAL AI SERVER MARKET SIZE, BY MACHINE LEARNING, BY REGION, 2018-2030 (USD MILLION)
  • TABLE 19. GLOBAL AI SERVER MARKET SIZE, BY NATURAL LANGUAGE PROCESSING, BY REGION, 2018-2030 (USD MILLION)
  • TABLE 20. GLOBAL AI SERVER MARKET SIZE, BY DEPLOYMENT MODE, 2018-2030 (USD MILLION)
  • TABLE 21. GLOBAL AI SERVER MARKET SIZE, BY CLOUD-BASED, BY REGION, 2018-2030 (USD MILLION)
  • TABLE 22. GLOBAL AI SERVER MARKET SIZE, BY ON-PREMISES, BY REGION, 2018-2030 (USD MILLION)
  • TABLE 23. AMERICAS AI SERVER MARKET SIZE, BY PROCESSOR, 2018-2030 (USD MILLION)
  • TABLE 24. AMERICAS AI SERVER MARKET SIZE, BY END-USER, 2018-2030 (USD MILLION)
  • TABLE 25. AMERICAS AI SERVER MARKET SIZE, BY APPLICATION, 2018-2030 (USD MILLION)
  • TABLE 26. AMERICAS AI SERVER MARKET SIZE, BY DEPLOYMENT MODE, 2018-2030 (USD MILLION)
  • TABLE 27. AMERICAS AI SERVER MARKET SIZE, BY COUNTRY, 2018-2030 (USD MILLION)
  • TABLE 28. ARGENTINA AI SERVER MARKET SIZE, BY PROCESSOR, 2018-2030 (USD MILLION)
  • TABLE 29. ARGENTINA AI SERVER MARKET SIZE, BY END-USER, 2018-2030 (USD MILLION)
  • TABLE 30. ARGENTINA AI SERVER MARKET SIZE, BY APPLICATION, 2018-2030 (USD MILLION)
  • TABLE 31. ARGENTINA AI SERVER MARKET SIZE, BY DEPLOYMENT MODE, 2018-2030 (USD MILLION)
  • TABLE 32. BRAZIL AI SERVER MARKET SIZE, BY PROCESSOR, 2018-2030 (USD MILLION)
  • TABLE 33. BRAZIL AI SERVER MARKET SIZE, BY END-USER, 2018-2030 (USD MILLION)
  • TABLE 34. BRAZIL AI SERVER MARKET SIZE, BY APPLICATION, 2018-2030 (USD MILLION)
  • TABLE 35. BRAZIL AI SERVER MARKET SIZE, BY DEPLOYMENT MODE, 2018-2030 (USD MILLION)
  • TABLE 36. CANADA AI SERVER MARKET SIZE, BY PROCESSOR, 2018-2030 (USD MILLION)
  • TABLE 37. CANADA AI SERVER MARKET SIZE, BY END-USER, 2018-2030 (USD MILLION)
  • TABLE 38. CANADA AI SERVER MARKET SIZE, BY APPLICATION, 2018-2030 (USD MILLION)
  • TABLE 39. CANADA AI SERVER MARKET SIZE, BY DEPLOYMENT MODE, 2018-2030 (USD MILLION)
  • TABLE 40. MEXICO AI SERVER MARKET SIZE, BY PROCESSOR, 2018-2030 (USD MILLION)
  • TABLE 41. MEXICO AI SERVER MARKET SIZE, BY END-USER, 2018-2030 (USD MILLION)
  • TABLE 42. MEXICO AI SERVER MARKET SIZE, BY APPLICATION, 2018-2030 (USD MILLION)
  • TABLE 43. MEXICO AI SERVER MARKET SIZE, BY DEPLOYMENT MODE, 2018-2030 (USD MILLION)
  • TABLE 44. UNITED STATES AI SERVER MARKET SIZE, BY PROCESSOR, 2018-2030 (USD MILLION)
  • TABLE 45. UNITED STATES AI SERVER MARKET SIZE, BY END-USER, 2018-2030 (USD MILLION)
  • TABLE 46. UNITED STATES AI SERVER MARKET SIZE, BY APPLICATION, 2018-2030 (USD MILLION)
  • TABLE 47. UNITED STATES AI SERVER MARKET SIZE, BY DEPLOYMENT MODE, 2018-2030 (USD MILLION)
  • TABLE 48. UNITED STATES AI SERVER MARKET SIZE, BY STATE, 2018-2030 (USD MILLION)
  • TABLE 49. ASIA-PACIFIC AI SERVER MARKET SIZE, BY PROCESSOR, 2018-2030 (USD MILLION)
  • TABLE 50. ASIA-PACIFIC AI SERVER MARKET SIZE, BY END-USER, 2018-2030 (USD MILLION)
  • TABLE 51. ASIA-PACIFIC AI SERVER MARKET SIZE, BY APPLICATION, 2018-2030 (USD MILLION)
  • TABLE 52. ASIA-PACIFIC AI SERVER MARKET SIZE, BY DEPLOYMENT MODE, 2018-2030 (USD MILLION)
  • TABLE 53. ASIA-PACIFIC AI SERVER MARKET SIZE, BY COUNTRY, 2018-2030 (USD MILLION)
  • TABLE 54. AUSTRALIA AI SERVER MARKET SIZE, BY PROCESSOR, 2018-2030 (USD MILLION)
  • TABLE 55. AUSTRALIA AI SERVER MARKET SIZE, BY END-USER, 2018-2030 (USD MILLION)
  • TABLE 56. AUSTRALIA AI SERVER MARKET SIZE, BY APPLICATION, 2018-2030 (USD MILLION)
  • TABLE 57. AUSTRALIA AI SERVER MARKET SIZE, BY DEPLOYMENT MODE, 2018-2030 (USD MILLION)
  • TABLE 58. CHINA AI SERVER MARKET SIZE, BY PROCESSOR, 2018-2030 (USD MILLION)
  • TABLE 59. CHINA AI SERVER MARKET SIZE, BY END-USER, 2018-2030 (USD MILLION)
  • TABLE 60. CHINA AI SERVER MARKET SIZE, BY APPLICATION, 2018-2030 (USD MILLION)
  • TABLE 61. CHINA AI SERVER MARKET SIZE, BY DEPLOYMENT MODE, 2018-2030 (USD MILLION)
  • TABLE 62. INDIA AI SERVER MARKET SIZE, BY PROCESSOR, 2018-2030 (USD MILLION)
  • TABLE 63. INDIA AI SERVER MARKET SIZE, BY END-USER, 2018-2030 (USD MILLION)
  • TABLE 64. INDIA AI SERVER MARKET SIZE, BY APPLICATION, 2018-2030 (USD MILLION)
  • TABLE 65. INDIA AI SERVER MARKET SIZE, BY DEPLOYMENT MODE, 2018-2030 (USD MILLION)
  • TABLE 66. INDONESIA AI SERVER MARKET SIZE, BY PROCESSOR, 2018-2030 (USD MILLION)
  • TABLE 67. INDONESIA AI SERVER MARKET SIZE, BY END-USER, 2018-2030 (USD MILLION)
  • TABLE 68. INDONESIA AI SERVER MARKET SIZE, BY APPLICATION, 2018-2030 (USD MILLION)
  • TABLE 69. INDONESIA AI SERVER MARKET SIZE, BY DEPLOYMENT MODE, 2018-2030 (USD MILLION)
  • TABLE 70. JAPAN AI SERVER MARKET SIZE, BY PROCESSOR, 2018-2030 (USD MILLION)
  • TABLE 71. JAPAN AI SERVER MARKET SIZE, BY END-USER, 2018-2030 (USD MILLION)
  • TABLE 72. JAPAN AI SERVER MARKET SIZE, BY APPLICATION, 2018-2030 (USD MILLION)
  • TABLE 73. JAPAN AI SERVER MARKET SIZE, BY DEPLOYMENT MODE, 2018-2030 (USD MILLION)
  • TABLE 74. MALAYSIA AI SERVER MARKET SIZE, BY PROCESSOR, 2018-2030 (USD MILLION)
  • TABLE 75. MALAYSIA AI SERVER MARKET SIZE, BY END-USER, 2018-2030 (USD MILLION)
  • TABLE 76. MALAYSIA AI SERVER MARKET SIZE, BY APPLICATION, 2018-2030 (USD MILLION)
  • TABLE 77. MALAYSIA AI SERVER MARKET SIZE, BY DEPLOYMENT MODE, 2018-2030 (USD MILLION)
  • TABLE 78. PHILIPPINES AI SERVER MARKET SIZE, BY PROCESSOR, 2018-2030 (USD MILLION)
  • TABLE 79. PHILIPPINES AI SERVER MARKET SIZE, BY END-USER, 2018-2030 (USD MILLION)
  • TABLE 80. PHILIPPINES AI SERVER MARKET SIZE, BY APPLICATION, 2018-2030 (USD MILLION)
  • TABLE 81. PHILIPPINES AI SERVER MARKET SIZE, BY DEPLOYMENT MODE, 2018-2030 (USD MILLION)
  • TABLE 82. SINGAPORE AI SERVER MARKET SIZE, BY PROCESSOR, 2018-2030 (USD MILLION)
  • TABLE 83. SINGAPORE AI SERVER MARKET SIZE, BY END-USER, 2018-2030 (USD MILLION)
  • TABLE 84. SINGAPORE AI SERVER MARKET SIZE, BY APPLICATION, 2018-2030 (USD MILLION)
  • TABLE 85. SINGAPORE AI SERVER MARKET SIZE, BY DEPLOYMENT MODE, 2018-2030 (USD MILLION)
  • TABLE 86. SOUTH KOREA AI SERVER MARKET SIZE, BY PROCESSOR, 2018-2030 (USD MILLION)
  • TABLE 87. SOUTH KOREA AI SERVER MARKET SIZE, BY END-USER, 2018-2030 (USD MILLION)
  • TABLE 88. SOUTH KOREA AI SERVER MARKET SIZE, BY APPLICATION, 2018-2030 (USD MILLION)
  • TABLE 89. SOUTH KOREA AI SERVER MARKET SIZE, BY DEPLOYMENT MODE, 2018-2030 (USD MILLION)
  • TABLE 90. TAIWAN AI SERVER MARKET SIZE, BY PROCESSOR, 2018-2030 (USD MILLION)
  • TABLE 91. TAIWAN AI SERVER MARKET SIZE, BY END-USER, 2018-2030 (USD MILLION)
  • TABLE 92. TAIWAN AI SERVER MARKET SIZE, BY APPLICATION, 2018-2030 (USD MILLION)
  • TABLE 93. TAIWAN AI SERVER MARKET SIZE, BY DEPLOYMENT MODE, 2018-2030 (USD MILLION)
  • TABLE 94. THAILAND AI SERVER MARKET SIZE, BY PROCESSOR, 2018-2030 (USD MILLION)
  • TABLE 95. THAILAND AI SERVER MARKET SIZE, BY END-USER, 2018-2030 (USD MILLION)
  • TABLE 96. THAILAND AI SERVER MARKET SIZE, BY APPLICATION, 2018-2030 (USD MILLION)
  • TABLE 97. THAILAND AI SERVER MARKET SIZE, BY DEPLOYMENT MODE, 2018-2030 (USD MILLION)
  • TABLE 98. VIETNAM AI SERVER MARKET SIZE, BY PROCESSOR, 2018-2030 (USD MILLION)
  • TABLE 99. VIETNAM AI SERVER MARKET SIZE, BY END-USER, 2018-2030 (USD MILLION)
  • TABLE 100. VIETNAM AI SERVER MARKET SIZE, BY APPLICATION, 2018-2030 (USD MILLION)
  • TABLE 101. VIETNAM AI SERVER MARKET SIZE, BY DEPLOYMENT MODE, 2018-2030 (USD MILLION)
  • TABLE 102. EUROPE, MIDDLE EAST & AFRICA AI SERVER MARKET SIZE, BY PROCESSOR, 2018-2030 (USD MILLION)
  • TABLE 103. EUROPE, MIDDLE EAST & AFRICA AI SERVER MARKET SIZE, BY END-USER, 2018-2030 (USD MILLION)
  • TABLE 104. EUROPE, MIDDLE EAST & AFRICA AI SERVER MARKET SIZE, BY APPLICATION, 2018-2030 (USD MILLION)
  • TABLE 105. EUROPE, MIDDLE EAST & AFRICA AI SERVER MARKET SIZE, BY DEPLOYMENT MODE, 2018-2030 (USD MILLION)
  • TABLE 106. EUROPE, MIDDLE EAST & AFRICA AI SERVER MARKET SIZE, BY COUNTRY, 2018-2030 (USD MILLION)
  • TABLE 107. DENMARK AI SERVER MARKET SIZE, BY PROCESSOR, 2018-2030 (USD MILLION)
  • TABLE 108. DENMARK AI SERVER MARKET SIZE, BY END-USER, 2018-2030 (USD MILLION)
  • TABLE 109. DENMARK AI SERVER MARKET SIZE, BY APPLICATION, 2018-2030 (USD MILLION)
  • TABLE 110. DENMARK AI SERVER MARKET SIZE, BY DEPLOYMENT MODE, 2018-2030 (USD MILLION)
  • TABLE 111. EGYPT AI SERVER MARKET SIZE, BY PROCESSOR, 2018-2030 (USD MILLION)
  • TABLE 112. EGYPT AI SERVER MARKET SIZE, BY END-USER, 2018-2030 (USD MILLION)
  • TABLE 113. EGYPT AI SERVER MARKET SIZE, BY APPLICATION, 2018-2030 (USD MILLION)
  • TABLE 114. EGYPT AI SERVER MARKET SIZE, BY DEPLOYMENT MODE, 2018-2030 (USD MILLION)
  • TABLE 115. FINLAND AI SERVER MARKET SIZE, BY PROCESSOR, 2018-2030 (USD MILLION)
  • TABLE 116. FINLAND AI SERVER MARKET SIZE, BY END-USER, 2018-2030 (USD MILLION)
  • TABLE 117. FINLAND AI SERVER MARKET SIZE, BY APPLICATION, 2018-2030 (USD MILLION)
  • TABLE 118. FINLAND AI SERVER MARKET SIZE, BY DEPLOYMENT MODE, 2018-2030 (USD MILLION)
  • TABLE 119. FRANCE AI SERVER MARKET SIZE, BY PROCESSOR, 2018-2030 (USD MILLION)
  • TABLE 120. FRANCE AI SERVER MARKET SIZE, BY END-USER, 2018-2030 (USD MILLION)
  • TABLE 121. FRANCE AI SERVER MARKET SIZE, BY APPLICATION, 2018-2030 (USD MILLION)
  • TABLE 122. FRANCE AI SERVER MARKET SIZE, BY DEPLOYMENT MODE, 2018-2030 (USD MILLION)
  • TABLE 123. GERMANY AI SERVER MARKET SIZE, BY PROCESSOR, 2018-2030 (USD MILLION)
  • TABLE 124. GERMANY AI SERVER MARKET SIZE, BY END-USER, 2018-2030 (USD MILLION)
  • TABLE 125. GERMANY AI SERVER MARKET SIZE, BY APPLICATION, 2018-2030 (USD MILLION)
  • TABLE 126. GERMANY AI SERVER MARKET SIZE, BY DEPLOYMENT MODE, 2018-2030 (USD MILLION)
  • TABLE 127. ISRAEL AI SERVER MARKET SIZE, BY PROCESSOR, 2018-2030 (USD MILLION)
  • TABLE 128. ISRAEL AI SERVER MARKET SIZE, BY END-USER, 2018-2030 (USD MILLION)
  • TABLE 129. ISRAEL AI SERVER MARKET SIZE, BY APPLICATION, 2018-2030 (USD MILLION)
  • TABLE 130. ISRAEL AI SERVER MARKET SIZE, BY DEPLOYMENT MODE, 2018-2030 (USD MILLION)
  • TABLE 131. ITALY AI SERVER MARKET SIZE, BY PROCESSOR, 2018-2030 (USD MILLION)
  • TABLE 132. ITALY AI SERVER MARKET SIZE, BY END-USER, 2018-2030 (USD MILLION)
  • TABLE 133. ITALY AI SERVER MARKET SIZE, BY APPLICATION, 2018-2030 (USD MILLION)
  • TABLE 134. ITALY AI SERVER MARKET SIZE, BY DEPLOYMENT MODE, 2018-2030 (USD MILLION)
  • TABLE 135. NETHERLANDS AI SERVER MARKET SIZE, BY PROCESSOR, 2018-2030 (USD MILLION)
  • TABLE 136. NETHERLANDS AI SERVER MARKET SIZE, BY END-USER, 2018-2030 (USD MILLION)
  • TABLE 137. NETHERLANDS AI SERVER MARKET SIZE, BY APPLICATION, 2018-2030 (USD MILLION)
  • TABLE 138. NETHERLANDS AI SERVER MARKET SIZE, BY DEPLOYMENT MODE, 2018-2030 (USD MILLION)
  • TABLE 139. NIGERIA AI SERVER MARKET SIZE, BY PROCESSOR, 2018-2030 (USD MILLION)
  • TABLE 140. NIGERIA AI SERVER MARKET SIZE, BY END-USER, 2018-2030 (USD MILLION)
  • TABLE 141. NIGERIA AI SERVER MARKET SIZE, BY APPLICATION, 2018-2030 (USD MILLION)
  • TABLE 142. NIGERIA AI SERVER MARKET SIZE, BY DEPLOYMENT MODE, 2018-2030 (USD MILLION)
  • TABLE 143. NORWAY AI SERVER MARKET SIZE, BY PROCESSOR, 2018-2030 (USD MILLION)
  • TABLE 144. NORWAY AI SERVER MARKET SIZE, BY END-USER, 2018-2030 (USD MILLION)
  • TABLE 145. NORWAY AI SERVER MARKET SIZE, BY APPLICATION, 2018-2030 (USD MILLION)
  • TABLE 146. NORWAY AI SERVER MARKET SIZE, BY DEPLOYMENT MODE, 2018-2030 (USD MILLION)
  • TABLE 147. POLAND AI SERVER MARKET SIZE, BY PROCESSOR, 2018-2030 (USD MILLION)
  • TABLE 148. POLAND AI SERVER MARKET SIZE, BY END-USER, 2018-2030 (USD MILLION)
  • TABLE 149. POLAND AI SERVER MARKET SIZE, BY APPLICATION, 2018-2030 (USD MILLION)
  • TABLE 150. POLAND AI SERVER MARKET SIZE, BY DEPLOYMENT MODE, 2018-2030 (USD MILLION)
  • TABLE 151. QATAR AI SERVER MARKET SIZE, BY PROCESSOR, 2018-2030 (USD MILLION)
  • TABLE 152. QATAR AI SERVER MARKET SIZE, BY END-USER, 2018-2030 (USD MILLION)
  • TABLE 153. QATAR AI SERVER MARKET SIZE, BY APPLICATION, 2018-2030 (USD MILLION)
  • TABLE 154. QATAR AI SERVER MARKET SIZE, BY DEPLOYMENT MODE, 2018-2030 (USD MILLION)
  • TABLE 155. RUSSIA AI SERVER MARKET SIZE, BY PROCESSOR, 2018-2030 (USD MILLION)
  • TABLE 156. RUSSIA AI SERVER MARKET SIZE, BY END-USER, 2018-2030 (USD MILLION)
  • TABLE 157. RUSSIA AI SERVER MARKET SIZE, BY APPLICATION, 2018-2030 (USD MILLION)
  • TABLE 158. RUSSIA AI SERVER MARKET SIZE, BY DEPLOYMENT MODE, 2018-2030 (USD MILLION)
  • TABLE 159. SAUDI ARABIA AI SERVER MARKET SIZE, BY PROCESSOR, 2018-2030 (USD MILLION)
  • TABLE 160. SAUDI ARABIA AI SERVER MARKET SIZE, BY END-USER, 2018-2030 (USD MILLION)
  • TABLE 161. SAUDI ARABIA AI SERVER MARKET SIZE, BY APPLICATION, 2018-2030 (USD MILLION)
  • TABLE 162. SAUDI ARABIA AI SERVER MARKET SIZE, BY DEPLOYMENT MODE, 2018-2030 (USD MILLION)
  • TABLE 163. SOUTH AFRICA AI SERVER MARKET SIZE, BY PROCESSOR, 2018-2030 (USD MILLION)
  • TABLE 164. SOUTH AFRICA AI SERVER MARKET SIZE, BY END-USER, 2018-2030 (USD MILLION)
  • TABLE 165. SOUTH AFRICA AI SERVER MARKET SIZE, BY APPLICATION, 2018-2030 (USD MILLION)
  • TABLE 166. SOUTH AFRICA AI SERVER MARKET SIZE, BY DEPLOYMENT MODE, 2018-2030 (USD MILLION)
  • TABLE 167. SPAIN AI SERVER MARKET SIZE, BY PROCESSOR, 2018-2030 (USD MILLION)
  • TABLE 168. SPAIN AI SERVER MARKET SIZE, BY END-USER, 2018-2030 (USD MILLION)
  • TABLE 169. SPAIN AI SERVER MARKET SIZE, BY APPLICATION, 2018-2030 (USD MILLION)
  • TABLE 170. SPAIN AI SERVER MARKET SIZE, BY DEPLOYMENT MODE, 2018-2030 (USD MILLION)
  • TABLE 171. SWEDEN AI SERVER MARKET SIZE, BY PROCESSOR, 2018-2030 (USD MILLION)
  • TABLE 172. SWEDEN AI SERVER MARKET SIZE, BY END-USER, 2018-2030 (USD MILLION)
  • TABLE 173. SWEDEN AI SERVER MARKET SIZE, BY APPLICATION, 2018-2030 (USD MILLION)
  • TABLE 174. SWEDEN AI SERVER MARKET SIZE, BY DEPLOYMENT MODE, 2018-2030 (USD MILLION)
  • TABLE 175. SWITZERLAND AI SERVER MARKET SIZE, BY PROCESSOR, 2018-2030 (USD MILLION)
  • TABLE 176. SWITZERLAND AI SERVER MARKET SIZE, BY END-USER, 2018-2030 (USD MILLION)
  • TABLE 177. SWITZERLAND AI SERVER MARKET SIZE, BY APPLICATION, 2018-2030 (USD MILLION)
  • TABLE 178. SWITZERLAND AI SERVER MARKET SIZE, BY DEPLOYMENT MODE, 2018-2030 (USD MILLION)
  • TABLE 179. TURKEY AI SERVER MARKET SIZE, BY PROCESSOR, 2018-2030 (USD MILLION)
  • TABLE 180. TURKEY AI SERVER MARKET SIZE, BY END-USER, 2018-2030 (USD MILLION)
  • TABLE 181. TURKEY AI SERVER MARKET SIZE, BY APPLICATION, 2018-2030 (USD MILLION)
  • TABLE 182. TURKEY AI SERVER MARKET SIZE, BY DEPLOYMENT MODE, 2018-2030 (USD MILLION)
  • TABLE 183. UNITED ARAB EMIRATES AI SERVER MARKET SIZE, BY PROCESSOR, 2018-2030 (USD MILLION)
  • TABLE 184. UNITED ARAB EMIRATES AI SERVER MARKET SIZE, BY END-USER, 2018-2030 (USD MILLION)
  • TABLE 185. UNITED ARAB EMIRATES AI SERVER MARKET SIZE, BY APPLICATION, 2018-2030 (USD MILLION)
  • TABLE 186. UNITED ARAB EMIRATES AI SERVER MARKET SIZE, BY DEPLOYMENT MODE, 2018-2030 (USD MILLION)
  • TABLE 187. UNITED KINGDOM AI SERVER MARKET SIZE, BY PROCESSOR, 2018-2030 (USD MILLION)
  • TABLE 188. UNITED KINGDOM AI SERVER MARKET SIZE, BY END-USER, 2018-2030 (USD MILLION)
  • TABLE 189. UNITED KINGDOM AI SERVER MARKET SIZE, BY APPLICATION, 2018-2030 (USD MILLION)
  • TABLE 190. UNITED KINGDOM AI SERVER MARKET SIZE, BY DEPLOYMENT MODE, 2018-2030 (USD MILLION)
  • TABLE 191. AI SERVER MARKET SHARE, BY KEY PLAYER, 2024
  • TABLE 192. AI SERVER MARKET, FPNV POSITIONING MATRIX, 2024
目次
Product Code: MRR-5D340F440BB2

The AI Server Market was valued at USD 50.48 billion in 2024 and is projected to grow to USD 59.78 billion in 2025, with a CAGR of 19.58%, reaching USD 147.65 billion by 2030.

KEY MARKET STATISTICS
Base Year [2024] USD 50.48 billion
Estimated Year [2025] USD 59.78 billion
Forecast Year [2030] USD 147.65 billion
CAGR (%) 19.58%

The evolution of artificial intelligence technologies has ushered in a new era in computing, where AI servers are increasingly becoming the backbone of digital transformation. In an industry characterized by dynamic advancements and the relentless pursuit of efficiency, the AI server market stands at the forefront of innovation. Organizations around the globe are leveraging these powerful servers to drive data-centric decisions and support complex machine learning operations. This report provides a comprehensive analysis of the current landscape, addressing key trends, shifts in market dynamics, and strategic insights that are redefining the competitive environment.

In recent years, rapid developments have seen the integration of advanced hardware architectures and optimized software frameworks that together enhance the performance and scalability of AI servers. Decision-makers are now more than ever focused on understanding how distributed architectures and cloud-based solutions are reshaping traditional computing models. As global businesses continue their digital transformation journeys, they are seeking out solutions that not only meet today's processing requirements but also anticipate the demands of tomorrow's AI-driven world.

This introduction sets the stage for a detailed exploration of the market, where the interplay between groundbreaking technology adoption and strategic investments is creating new opportunities and challenges in equal measure. The following sections of this report delve deeper into the forces shaping the AI server sector, combining market segmentation, regional analysis, company insights, and actionable recommendations to provide a well-rounded perspective for industry leaders and stakeholders.

Transformative Shifts in the AI Server Landscape

The AI server market is undergoing transformative shifts that are markedly changing the industry landscape. Cutting-edge advancements in processor architectures, along with the continuous evolution of AI algorithms, have led to a redefinition of computational capabilities. Traditional paradigms of centralized data centers are being reevaluated as more businesses shift toward hybrid and distributed infrastructures. This transition is influenced by a growing emphasis on adaptive resource management and network agility, allowing organizations to optimize performance while reducing operational costs.

Major factors contributing to this evolution include the integration of cloud-based infrastructures and the acceleration of edge computing. These drivers are making it possible for services to be delivered with increased speed and minimal latency, an essential requirement for applications that demand real-time processing. The rising popularity of AI-driven analytics has also encouraged the adoption of innovative computing models where servers are not only responsible for data processing but also for learning and adapting in near real time.

Moreover, industry players are increasingly investing in renewable energy sources and sustainable technologies to meet global demands for eco-friendly solutions. The shift from legacy computing systems to more robust platforms, which offer higher throughput and better energy efficiency, is paving the way for a more resilient and responsive market. As traditional models give way to a future dominated by AI and machine learning, businesses are finding themselves at a pivotal juncture where transformation is not optional but essential for survival and competitiveness.

Key Segmentation Insights in the AI Server Market

A closer look at the market segmentation reveals intricate layers that help in understanding the AI server domain from multiple perspectives. The analysis based on processors highlights the diverse technological ecosystem wherein the market is studied across Application-Specific Integrated Circuits, Field Programmable Gate Arrays, and Graphics Processing Units. Each of these processor types drives innovation in different ways, offering unique capabilities that cater to specific computational demands.

Segmentation by end-user further refines this understanding, with market analysis considering the distinct needs of Cloud Service Providers, Enterprises, and Government Organizations. Each customer segment brings its own set of challenges and requirements, from the need for scalable and flexible architectures to enhanced security protocols amidst increasing cyber threats. These end-users represent critical pillars upon which the deployment and advancement of AI servers are built, emphasizing customization and operational efficiency.

The study of market segmentation by application examines the technological underpinnings within domains such as Computer Vision, Generative AI, Machine Learning, and Natural Language Processing. Here, innovation is driven by the need to process vast amounts of data in real time, enabling breakthroughs in autonomous systems, predictive analytics, and conversational AI. The rapid uptake of these applications illustrates the profound impact that specialized AI solutions have had on diverse industries, catalyzing growth and technological convergence.

Finally, the segmentation by deployment mode-whether cloud-based or on-premises-sheds light on the flexibility and adaptability of AI server solutions in meeting varied operational preferences. While cloud-based deployments promise scalability and reduced maintenance overhead, on-premises systems remain essential for organizations that require enhanced data security and lower latency. Together, these segmentation insights form a multi-dimensional framework that not only reflects the current market conditions but also provides a roadmap for future innovation and expansion.

Based on Processor, market is studied across Application-Specific Integrated Circuit (ASICs), Field Programmable Gate Arrays (FPGAs), and Graphics Processing Units (GPUs).

Based on End-User, market is studied across Cloud Service Providers, Enterprises, and Goverment Organizations.

Based on Application, market is studied across Computer Vision, Generative AI (GenAI), Machine Learning, and Natural Language Processing.

Based on Deployment Mode, market is studied across Cloud-Based and On-Premises.

Regional Insights: Americas, EMEA, Asia-Pacific

Examining geographic trends further enriches the overall market perspective. The Americas continue to be a key driver in technology innovation, benefiting from robust investments in digital infrastructure and a well-established startup ecosystem. This region's dynamic business environment positions it as a fertile ground for the early adoption of advanced server technologies, enabling rapid prototyping and market validation.

The landscape in Europe, the Middle East, and Africa is characterized by progressive regulatory frameworks and government-led initiatives aimed at fostering digital transformation and cybersecurity. Here, the balance between regulatory oversight and the acceleration of technology deployment creates both opportunities and challenges for industry stakeholders. The region's strategic focus on innovation, combined with its diverse economic terrain, has spurred a significant increase in AI server deployments aimed at modernizing public and private sector IT infrastructures.

In contrast, the Asia-Pacific region is witnessing an exponential expansion in technology investments, underpinned by a high demand for scalable and sophisticated computing solutions. Rapid urbanization, coupled with massive investments in smart city projects and digitalization initiatives, has made this region a critical area of interest. As nations within this region push for homegrown technological innovations, competitive pressures are driving both local and international businesses to enhance their service offerings to meet and exceed evolving consumer expectations. The interplay between these regions creates a globally connected market that continues to set the stage for emerging trends and collaborative opportunities.

Based on Region, market is studied across Americas, Asia-Pacific, and Europe, Middle East & Africa. The Americas is further studied across Argentina, Brazil, Canada, Mexico, and United States. The United States is further studied across California, Florida, Illinois, New York, Ohio, Pennsylvania, and Texas. The Asia-Pacific is further studied across Australia, China, India, Indonesia, Japan, Malaysia, Philippines, Singapore, South Korea, Taiwan, Thailand, and Vietnam. The Europe, Middle East & Africa is further studied across Denmark, Egypt, Finland, France, Germany, Israel, Italy, Netherlands, Nigeria, Norway, Poland, Qatar, Russia, Saudi Arabia, South Africa, Spain, Sweden, Switzerland, Turkey, United Arab Emirates, and United Kingdom.

Leading Companies Shaping the AI Server Market

An analysis of the key companies driving the AI server market illustrates a rich tapestry of innovation and competitive vigor. Prominent players including ADLINK Technology Inc., Advanced Micro Devices, Inc., and ASUSTeK Computer Inc. are known for their relentless pursuit of technological excellence, each contributing uniquely to the ecosystem. Their efforts in research and development have laid the groundwork for improved computational performance and reduced latency.

Corporations such as Baidu, Inc. and Cerebras Systems Inc. are at the forefront of specialized AI applications, pushing the envelope in machine learning and deep learning capabilities. Industry giants like Cisco Systems, Inc., Dataknox Solutions, Inc., and Dell Inc. leverage robust infrastructure networks and cutting-edge server architectures, which in turn drive an era of unprecedented connectivity and data-driven decision-making. These organizations continuously refine their product roadmaps to meet evolving market demands.

Global leaders including Fujitsu Limited, GeoVision Inc., Hewlett Packard Enterprise Company, Huawei Technologies Co., Ltd., and IEIT SYSTEMS are instrumental in bridging the gap between legacy systems and next-generation computing platforms. Their expertise in both hardware and software integration ensures that enterprises are well-equipped to handle increasingly complex workloads. Inspiring further innovation, Inspur Group and Intel Corporation develop tailored solutions that cater to specific industry verticals, ensuring rapid and seamless technology integration.

Other influential companies such as Lenovo, M247 Europe S.R.L., Microsoft Corporation, MiTAC Computing Technology Corporation, NVIDIA Corporation, Oracle Corporation, Quanta Computer Inc., SNS Network, Super Micro Computer, Inc., and Wistron Corporation play strategic roles in setting market trends and accelerating technological advancements. Their collective focus not only fosters greater interoperability between devices and platforms but also ensures the sustainability and future-readiness of the AI server market. Together, these leaders are forging alliances and setting benchmarks that continue to redefine the landscape in meaningful ways.

The report delves into recent significant developments in the AI Server Market, highlighting leading vendors and their innovative profiles. These include ADLINK Technology Inc., Advanced Micro Devices, Inc., ASUSTeK Computer Inc., Baidu, Inc., Cerebras Systems Inc., Cisco Systems, Inc., Dataknox Solutions, Inc., Dell Inc., Fujitsu Limited, GeoVision Inc., Hewlett Packard Enterprise Company, Huawei Technologies Co., Ltd., IEIT SYSTEMS, Inspur Group, Intel Corporation, Lenovo, M247 Europe S.R.L., Microsoft Corporation, MiTAC Computing Technology Corporation, NVIDIA Corporation, Oracle Corporation, Quanta Computer lnc., SNS Network, Super Micro Computer, Inc., and Wistron Corporation. Actionable Recommendations for Industry Leaders

For industry leaders looking to position their organizations at the helm of the AI server revolution, a series of strategic recommendations is essential to navigate this rapidly evolving landscape. The first imperative is to invest in agile research and development programs that support iterative innovation. By continuously upgrading technology and integrating advanced computing architectures, companies can ensure that they remain resilient in the face of escalating market demands.

Leadership should focus on fostering cross-functional collaboration to bridge the gap between theoretical research and practical application. This includes establishing partnerships between technology developers, academic institutions, and business strategists to drive thought leadership and regulatory compliance concurrently. Emphasizing customer-centric innovation is crucial; organizations must listen to the needs and challenges of their end-users to tailor solutions that are both robust and adaptable.

It is also recommended that companies incorporate sustainable practices into their operational blueprint. Energy-efficient server designs and a commitment to reducing the carbon footprint are no longer just ethical considerations but strategic necessities in today's environmentally conscious market. Digital transformation initiatives should be paired with a strong cybersecurity framework to ensure data integrity and customer trust.

Finally, industry leaders are advised to keep a close watch on emerging trends in deployment modes, customer segmentation, and regional market behaviors. By proactively adapting to these evolving parameters, organizations can better anticipate market shifts and streamline their product roadmaps for long-term success. Taking calculated risks and driving innovation through both internal and external collaborations remain key pillars in achieving a competitive edge.

Conclusion and Strategic Perspective

The rapidly evolving world of AI servers is a mirror to the broader changes sweeping across the digital landscape. As businesses continue to invest in smarter, more efficient computing solutions, the integration of cutting-edge technologies and evolving market trends becomes ever more critical. The insights presented in this report underscore the pivotal role of sophisticated hardware, flexible deployment options, and a deep understanding of end-user needs in shaping the future of the market.

From transformative shifts in technology and evolving regional dynamics to nuanced segmentation insights and the concerted efforts of global industry leaders, the market is characterized by both immense opportunities and complex challenges. The adoption of AI servers has not only redefined traditional computing paradigms but has also set the stage for a disruptive new era in digital transformation. This evolution calls for strategic foresight, sustained investment in innovation, and a commitment to operational excellence.

The convergence of advanced processing units, dynamic cloud services, and specialized applications such as computer vision and natural language processing is a testament to the transformative impact that technology can have on global business operations. As companies align their strategies with these developments, they are better positioned to leverage new market opportunities and maintain a competitive edge. In essence, the lessons derived from our analysis point towards a future where adaptability and innovation are the cornerstones of industry success.

Table of Contents

1. Preface

  • 1.1. Objectives of the Study
  • 1.2. Market Segmentation & Coverage
  • 1.3. Years Considered for the Study
  • 1.4. Currency & Pricing
  • 1.5. Language
  • 1.6. Stakeholders

2. Research Methodology

  • 2.1. Define: Research Objective
  • 2.2. Determine: Research Design
  • 2.3. Prepare: Research Instrument
  • 2.4. Collect: Data Source
  • 2.5. Analyze: Data Interpretation
  • 2.6. Formulate: Data Verification
  • 2.7. Publish: Research Report
  • 2.8. Repeat: Report Update

3. Executive Summary

4. Market Overview

5. Market Insights

  • 5.1. Market Dynamics
    • 5.1.1. Drivers
      • 5.1.1.1. Increased use of AI in personalized user experiences
      • 5.1.1.2. Rising implementation of artificial intelligence technologies in enterprise applications
      • 5.1.1.3. Growing demand for scalable data storage solutions in various sectors
    • 5.1.2. Restraints
      • 5.1.2.1. Increased energy costs and thermal challenges
    • 5.1.3. Opportunities
      • 5.1.3.1. Leveraging AI technologies for enhanced cybersecurity measures in financial institutions
      • 5.1.3.2. Advancements in AI and machine learning
    • 5.1.4. Challenges
      • 5.1.4.1. Concerns about AI server security with potential vulnerabilities and cyber threats
  • 5.2. Market Segmentation Analysis
    • 5.2.1. Processor : High popularity of GPUs for complex AI computations owing to their flexibility and scalability
    • 5.2.2. Application : Significant adoption of AI servers in computer vision due to its proliferation in automotive and healthcare
  • 5.3. Porter's Five Forces Analysis
    • 5.3.1. Threat of New Entrants
    • 5.3.2. Threat of Substitutes
    • 5.3.3. Bargaining Power of Customers
    • 5.3.4. Bargaining Power of Suppliers
    • 5.3.5. Industry Rivalry
  • 5.4. PESTLE Analysis
    • 5.4.1. Political
    • 5.4.2. Economic
    • 5.4.3. Social
    • 5.4.4. Technological
    • 5.4.5. Legal
    • 5.4.6. Environmental

6. AI Server Market, by Processor

  • 6.1. Introduction
  • 6.2. Application-Specific Integrated Circuit (ASICs)
  • 6.3. Field Programmable Gate Arrays (FPGAs)
  • 6.4. Graphics Processing Units (GPUs)

7. AI Server Market, by End-User

  • 7.1. Introduction
  • 7.2. Cloud Service Providers
  • 7.3. Enterprises
  • 7.4. Goverment Organizations

8. AI Server Market, by Application

  • 8.1. Introduction
  • 8.2. Computer Vision
  • 8.3. Generative AI (GenAI)
  • 8.4. Machine Learning
  • 8.5. Natural Language Processing

9. AI Server Market, by Deployment Mode

  • 9.1. Introduction
  • 9.2. Cloud-Based
  • 9.3. On-Premises

10. Americas AI Server Market

  • 10.1. Introduction
  • 10.2. Argentina
  • 10.3. Brazil
  • 10.4. Canada
  • 10.5. Mexico
  • 10.6. United States

11. Asia-Pacific AI Server Market

  • 11.1. Introduction
  • 11.2. Australia
  • 11.3. China
  • 11.4. India
  • 11.5. Indonesia
  • 11.6. Japan
  • 11.7. Malaysia
  • 11.8. Philippines
  • 11.9. Singapore
  • 11.10. South Korea
  • 11.11. Taiwan
  • 11.12. Thailand
  • 11.13. Vietnam

12. Europe, Middle East & Africa AI Server Market

  • 12.1. Introduction
  • 12.2. Denmark
  • 12.3. Egypt
  • 12.4. Finland
  • 12.5. France
  • 12.6. Germany
  • 12.7. Israel
  • 12.8. Italy
  • 12.9. Netherlands
  • 12.10. Nigeria
  • 12.11. Norway
  • 12.12. Poland
  • 12.13. Qatar
  • 12.14. Russia
  • 12.15. Saudi Arabia
  • 12.16. South Africa
  • 12.17. Spain
  • 12.18. Sweden
  • 12.19. Switzerland
  • 12.20. Turkey
  • 12.21. United Arab Emirates
  • 12.22. United Kingdom

13. Competitive Landscape

  • 13.1. Market Share Analysis, 2024
  • 13.2. FPNV Positioning Matrix, 2024
  • 13.3. Competitive Scenario Analysis
    • 13.3.1. NationGate pioneers Malaysia's first AI servers, enhancing local tech innovation and economic growth
    • 13.3.2. Qubrid AI and Supermicro enhance enterprise AI with plug-and-play NVIDIA GPU server solutions
    • 13.3.3. HPE and Dell advance AI infrastructure with cutting-edge servers optimizing performance and efficiency
    • 13.3.4. Lenovo's strategic move to manufacture AI servers in India signals a shift in global tech production
  • 13.4. Strategy Analysis & Recommendation

Companies Mentioned

  • 1. ADLINK Technology Inc.
  • 2. Advanced Micro Devices, Inc.
  • 3. ASUSTeK Computer Inc.
  • 4. Baidu, Inc.
  • 5. Cerebras Systems Inc.
  • 6. Cisco Systems, Inc.
  • 7. Dataknox Solutions, Inc.
  • 8. Dell Inc.
  • 9. Fujitsu Limited
  • 10. GeoVision Inc.
  • 11. Hewlett Packard Enterprise Company
  • 12. Huawei Technologies Co., Ltd.
  • 13. IEIT SYSTEMS
  • 14. Inspur Group
  • 15. Intel Corporation
  • 16. Lenovo
  • 17. M247 Europe S.R.L.
  • 18. Microsoft Corporation
  • 19. MiTAC Computing Technology Corporation
  • 20. NVIDIA Corporation
  • 21. Oracle Corporation
  • 22. Quanta Computer lnc.
  • 23. SNS Network
  • 24. Super Micro Computer, Inc.
  • 25. Wistron Corporation