|
|
市場調査レポート
商品コード
1808653
自動車受託製造市場:車両タイプ、部品タイプ、サービスタイプ、契約タイプ、最終用途別-2025-2030年の世界予測Automotive Contract Manufacturing Market by Vehicle Type, Component Type, Service Type, Contract Type, End Use - Global Forecast 2025-2030 |
||||||
|
|||||||
カスタマイズ可能
適宜更新あり
|
|||||||

| 自動車受託製造市場:車両タイプ、部品タイプ、サービスタイプ、契約タイプ、最終用途別-2025-2030年の世界予測 |
|
出版日: 2025年08月28日
発行: 360iResearch
ページ情報: 英文 193 Pages
納期: 即日から翌営業日
|

概要
自動車受託製造市場は、2024年には712億8,000万米ドルとなり、2025年にはCAGR 5.66%で751億7,000万米ドルに成長し、2030年には992億1,000万米ドルに達すると予測されています。
| 主な市場の統計 | |
|---|---|
| 基準年2024 | 712億8,000万米ドル |
| 推定年2025 | 751億7,000万米ドル |
| 予測年2030 | 992億1,000万米ドル |
| CAGR(%) | 5.66% |
自動車受託製造市場の情勢を、業界関係者のためのコア促進要因動向と戦略的促進要因を通して明らかにします
自動車受託製造は、生産能力を最適化し、市場投入までの時間を短縮しようとする相手先商標製品メーカーにとって、重要な手段として浮上してきました。モジュール、アッセンブリ、完成車を専門パートナーにアウトソーシングすることで、OEMは設計革新とブランド差別化に集中できる一方、製造委託先が提供する業務専門知識とスケールメリットを活用することができます。グローバル化が進み、生産拠点が移動する時代において、製造委託は地理的な多様化というメリットももたらし、OEMは地域的な混乱を緩和し、複雑な貿易環境を乗り切ることができます。
世界の自動車受託製造にかつてない変革をもたらす技術的規制と市場の力を探る
デジタルマニュファクチャリングとインダストリー4.0の急速な進歩は、自動車受託製造に革命をもたらしています。ロボット工学、積層造形、リアルタイムデータ解析の統合は、かつてないレベルの精度と生産性を可能にしています。一方、世界的な電動化へのシフトにより、受託製造企業は、バッテリーパックの組み立てや高電圧コンポーネントの統合に対応できるよう、既存の設備を改修する必要に迫られています。その結果、従来の金属プレスやパワートレイン組立ラインは、効率を損なうことなく、モジュール式電動アーキテクチャや混合モデル生産に対応できるよう進化しています。
2025年米国関税のサプライチェーンへの連鎖的影響自動車受託生産における生産コストと競合ダイナミクスの評価
2025年に向けて発表された大規模な関税調整は、世界の自動車サプライチェーンに大きな複雑性をもたらしました。主要輸出市場を原産地とする重要部品とアセンブリに課される関税の増加により、受託製造業者とOEMの製造コストは同様に上昇しました。その結果、調達戦略には厳しい監視の目が向けられるようになり、調達チームは利益率の低下を緩和するために代替サプライヤーや原材料の選択肢を評価するようになっています。コスト構造の急激な変化により、進化する貿易政策との整合性を確保するために、既存の契約や価格モデルの再評価が必要となっています。
製造受託の成長軌道を形成する重要な自動車部品サービス契約と最終用途カテゴリーを明らかにするセグメント化レイヤーの解明
受託製造は商用車と乗用車のプラットフォームをサポートしており、それぞれに異なる製造専門知識が要求されます。大型商用車では、長距離運行に最適化された強化シャーシ製造と耐久性の高いアセンブリが必要であり、小型商用車ではモジュール式の貨物構成が重視されます。乗用車セグメントでは、ハッチバックはコンパクトなフットプリントとコスト効率を重視し、セダンは快適性と性能のバランスをとり、SUVは高度な安全性とインフォテインメント機能を統合し、カスタマイズされた製造アプローチを推進しています。
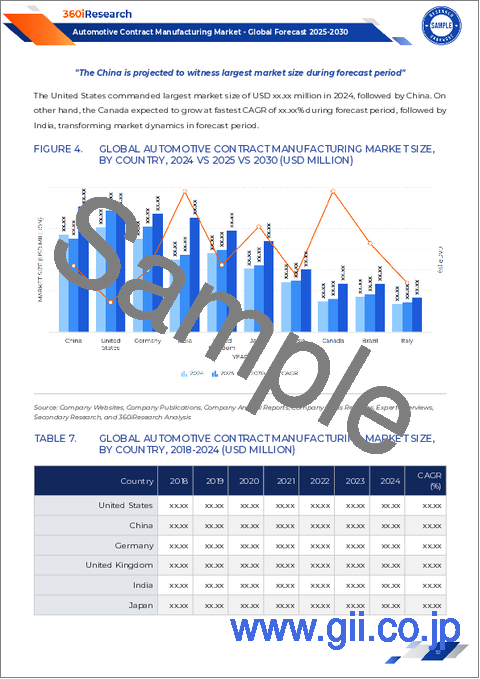
南北アメリカ、欧州、中東・アフリカ、アジア太平洋地域の市場力学を読み解き、新たな機会と拡大戦略を探る
南北アメリカ地域は、強固なOEMエコシステムと、米国、カナダ、メキシコで確立された受託製造ネットワークから利益を得ています。北米では、ニアショアリングの動向により、地域貿易協定や電気自動車プラットフォームの需要に後押しされて、組立工場や部品加工施設への投資が加速しています。ブラジルとアルゼンチンに代表される中南米市場は、小型商用車とパワートレイン・コンポーネントの成長機会を提供しているが、経済状況の変動と規制の不安定さにより、慎重な戦略立案が必要です。
主要な業界リーダーとイノベーターのプロファイリング戦略的提携と合併技術投資と運営のベストプラクティスを明らかにする
ダイナミックな自動車受託製造の分野では、実績のあるティア1サプライヤーや多角的なエンジニアリング企業が、引き続き競合ベンチマーキングを形成しています。マグナ・インターナショナル、フォーレシア、ロバート・ボッシュ、リア・コーポレーションなどの大手企業は、グローバルな生産拠点を活用して、従来型車両と電動化車両の両方のプラットフォームに対応しています。これらの企業は、パワーエレクトロニクスから先進シートシステムまで、補完的な能力を統合するために戦略的な合併・買収を進めており、次世代モジュールを共同開発するためにOEMと合弁会社を設立しています。インダストリー4.0のスマートファクトリーや拡張現実を利用したメンテナンスプロトコルなど、デジタル化イニシアティブへの投資は、オペレーショナルエクセレンスと迅速な拡張性へのコミットメントを裏付けています。
将来を見据えたアクションプランの実施により、持続可能な成長のためのイノベーション・オペレーショナル・エクセレンスとコラボレーティブ・エコシステムを活用するために、業界の利害関係者に力を与えます
業界のリーダーは、混合モデルや電動化車両の生産に対応する柔軟な製造アーキテクチャの展開を優先すべきです。これには、モジュラーツーリング、プログラマブルロボット、および迅速な切り替えとリアルタイムの性能監視を容易にするデジタルツインプラットフォームへの投資が必要です。同時に、予知保全のための高度な分析と機械学習を取り入れることで、予定外のダウンタイムを削減し、資源利用を最適化することができます。部品生産に持続可能な素材とクローズドループリサイクルプロセスを取り入れることは、強化される規制に準拠するだけでなく、ブランド価値とコスト効率を生み出します。さらに、リーン生産方式やシックス・シグマなどの継続的改善フレームワークを採用することで、品質基準を強化し、スループットを加速させ、競争力のあるアウトソーシング契約における利幅を拡大することができます。
データの完全性を保証する堅牢な調査手法を採用多元分析と専門家別検証により、実用的な市場洞察を提供
本調査では、2次調査と1次調査の手法を包括的に組み合わせることで、深さと信頼性を確保しています。二次調査の情報源には、規制当局への届出、企業の年次報告書、業界団体の出版物、学術誌などが含まれ、市場促進要因と技術動向に関する基礎的な視点を提供しています。これらの見識を深めるため、1次調査では、大手OEM、製造委託会社、段階的サプライヤーの経営幹部や業務管理者との綿密な面談を行いました。これらの定性的な議論は、生産プロセス、デジタル統合戦略、品質保証プロトコルを直接観察するために、現場での施設訪問とバーチャルワークショップによって補完されました。すべてのデータは、重要な仮定を検証し、新たなパターンを検出するために、定量的指標と専門家の意見を整合させる、厳格な三角測量の対象となりました。
自動車受託製造ダイナミクスの包括的な検証を締めくくるための重要な発見と戦略的インパータスの統合
本エグゼクティブサマリーでは、自動車受託製造のエコシステムを形成する極めて重要な動向を明らかにしました。デジタル生産、電動化、持続可能性における変革的なシフトは、メーカーに俊敏なモジュール式オペレーションと高度な品質保証システムの採用を迫っています。セグメンテーション分析では、商用車と乗用車、多様な部品カテゴリー、サービスと契約モデルで差別化された機会が強調され、地域別の洞察では、南北アメリカ、欧州・中東・アフリカ、アジア太平洋における明確な促進要因が明らかになりました。さらに、米国の2025年関税枠組みは、弾力性のあるサプライチェーンの重要性を強調し、ニアショアリング戦略とダイナミックな調達手配を促しています。主要企業プロファイルでは、戦略的パートナーシップ、M&A活動、競争優位性を高めるための投資の中心的役割を強調しています。
目次
第1章 序文
第2章 調査手法
第3章 エグゼクティブサマリー
第4章 市場の概要
第5章 市場力学
- 急増するEV需要に対応するため、電気自動車の大量生産契約ラインを拡大
- 契約組立における燃費向上のための先進軽量複合材料の採用
- デジタルツインシミュレーションとIoT分析を統合し、自動車製造ワークフローを最適化
- 部品生産における持続可能な製造方法と循環型経済の原則の実装
- リショアリングとニアショアリングの動向が地域の回復力と俊敏性を高める
- 高精度部品組立工程へのロボット自動化と人工知能の導入
- ラピッドプロトタイピングと少量生産の自動車部品における積層造形技術の活用
第6章 市場洞察
- ポーターのファイブフォース分析
- PESTEL分析
第7章 米国の関税の累積的な影響2025
第8章 自動車受託製造市場:車両タイプ別
- 商用車
- 大型商用車(HCV)
- 小型商用車(LCV)
- 乗用車
- ハッチバック
- セダン
- SUV
第9章 自動車受託製造市場:コンポーネントタイプ別
- エレクトロニクス
- 制御ユニット
- インフォテインメントシステム
- センサー
- 外装部品
- ボディパネル
- シャーシと構造部品
- ステアリングシステム
- サスペンションシステム
- 照明システム
- 屋根システム
- 内装部品
- センターコンソール
- ダッシュボードアセンブリ
- ドアパネルとトリム
- HVACシステム
- インストルメントクラスター
- シートとシートフレーム
- パワートレイン
- バッテリーシステム
- 電気モーター
- エンジン
- トランスミッション
第10章 自動車受託製造市場:サービスタイプ別
- 完成車製造
- コンポーネント/モジュール製造
- 設計・エンジニアリングサービス
第11章 自動車受託製造市場契約タイプ別
- ビルド・トゥ・プリント(BtP)
- 仕様に基づくビルド(BtS)
- 共同開発製造(JDM)
第12章 自動車受託製造市場:最終用途別
- アフターマーケット
- Oem
第13章 南北アメリカの自動車受託製造市場
- 米国
- カナダ
- メキシコ
- ブラジル
- アルゼンチン
第14章 欧州・中東・アフリカの自動車受託製造市場
- 英国
- ドイツ
- フランス
- ロシア
- イタリア
- スペイン
- アラブ首長国連邦
- サウジアラビア
- 南アフリカ
- デンマーク
- オランダ
- カタール
- フィンランド
- スウェーデン
- ナイジェリア
- エジプト
- トルコ
- イスラエル
- ノルウェー
- ポーランド
- スイス
第15章 アジア太平洋地域の自動車受託製造市場
- 中国
- インド
- 日本
- オーストラリア
- 韓国
- インドネシア
- タイ
- フィリピン
- マレーシア
- シンガポール
- ベトナム
- 台湾
第16章 競合情勢
- 市場シェア分析, 2024
- FPNVポジショニングマトリックス, 2024
- 競合分析
- Alchemy MFG
- Astro Machine Works
- Asteelflash Group
- Avalon Technologies Limited
- Avtec Inc. by Motorola Solutions, Inc.
- BorgWarner Inc.
- Brabus automotive GmbH
- Bunty LLC
- Edison Manufacturing & Engineering, Inc.
- HANA Technologies Inc.
- Machinemaze Integration Services Private Limited
- Magna International Inc.
- Providence Enterprise
- SGK India Engineering Pvt. Ltd.
- Steyr Automotive GmbH
- Valmet Automotive Group
- W Motors

