|
|
市場調査レポート
商品コード
1558477
食品用スプレー乾燥装置の世界市場、2024~2028年Global Food Spray Drying Equipment Market 2024-2028 |
||||||

|
|||||||
カスタマイズ可能
|
|||||||


| 食品用スプレー乾燥装置の世界市場、2024~2028年 |
|
出版日: 2024年08月14日
発行: TechNavio
ページ情報: 英文 191 Pages
納期: 即納可能
|

全表示
- 概要
- 図表
- 目次
食品用スプレー乾燥装置市場、2024~2028年
食品用スプレー乾燥装置市場は2023~2028年に5億5,170万米ドル、予測期間中のCAGRは4.36%で成長すると予測されます。当レポートでは、食品用スプレー乾燥装置市場の全体的な分析、市場規模・予測、動向、成長促進要因、課題、約25のベンダーを網羅したベンダー分析などを掲載しています。
現在の市場シナリオ、最新動向と促進要因、市場環境全体に関する最新分析を提供しています。市場は、乳児用調製粉乳の採用増加、食品加工業界の工場拡大、栄養強化食品やRTE食品市場の成長によって牽引されています。
| 市場範囲 | |
|---|---|
| 基準年 | 2024年 |
| 終了年 | 2028年 |
| 予測期間 | 2024~2028年 |
| 成長モメンタム | 加速 |
| 前年比[2024年] | 4.11% |
| CAGR | 4.36% |
| 増分額 | 5億5,170万米ドル |
本調査では、今後数年間の食品用スプレー乾燥装置市場成長を牽引する主要要因の1つとして、食品カプセル化のための噴霧乾燥装置の応用を挙げています。また、噴霧乾燥システムの市場開拓と磁気噴霧機(MSM)の普及が市場の大きな需要につながります。
目次
第1章 エグゼクティブサマリー
- 市場概要
第2章 市場情勢
- 市場エコシステム
- 市場の特徴
- バリューチェーン分析
第3章 市場規模の評価
- 市場の定義
- 市場セグメント分析
- 市場規模 2023年
- 市場の展望 2023~2028年
第4章 市場規模実績
- 食品用スプレー乾燥装置の世界市場 2018~2022年
- 用途別セグメント分析 2018~2022年
- 製品別セグメント分析 2018~2022年
- タイプ別セグメント分析 2018~2022年
- 地域別セグメント分析 2018~2022年
- 国別セグメント分析 2018~2022年
第5章 ファイブフォース分析
- ファイブフォースの要約
- 買い手の交渉力
- 供給企業の交渉力
- 新規参入業者の脅威
- 代替品の脅威
- 競争の脅威
- 市況
第6章 市場セグメンテーション:用途別
- 市場セグメンテーション
- 比較:用途別
- 乳製品:市場規模と予測 2023~2028年
- 植物性食品、魚類、肉類のタンパク質:市場規模と予測 2023~2028年
- 果物と野菜製品:市場規模と予測 2023~2028年
- 炭水化物製品:市場規模と予測 2023~2028年
- その他:市場規模と予測 2023~2028年
- 市場機会:用途別
第7章 市場セグメンテーション:製品別
- 市場セグメンテーション
- 比較:製品別
- 二段スプレー乾燥装置:市場規模と予測 2023~2028年
- 多段スプレー乾燥装置:市場規模と予測 2023~2028年
- 単段スプレー乾燥装置:市場規模と予測 2023~2028年
- 市場機会:製品別
第8章 市場セグメンテーション:タイプ別
- 市場セグメンテーション
- 比較:タイプ別
- 圧力式単流体ノズル噴霧器:市場規模と予測 2023~2028年
- ロータリーホイール噴霧器:市場規模と予測 2023~2028年
- 空気圧式二流体ノズル噴霧器:市場規模と予測 2023~2028年
- 市場機会:タイプ別
第9章 顧客情勢
- 顧客情勢概要
第10章 地域別情勢
- 地域別セグメンテーション
- 比較:地域別
- アジア太平洋:市場規模と予測 2023~2028年
- 欧州:市場規模と予測 2023~2028年
- 北米:市場規模と予測 2023~2028年
- 南米:市場規模と予測 2023~2028年
- 中東・アフリカ:市場規模と予測 2023~2028年
- 米国:市場規模と予測 2023~2028年
- 中国:市場規模と予測 2023~2028年
- ドイツ:市場規模と予測 2023~2028年
- 日本:市場規模と予測 2023~2028年
- 英国:市場規模と予測 2023~2028年
- 市場機会:地域情勢別
第11章 促進要因・課題・機会・抑制要因
- 市場促進要因
- 市場課題
- 促進要因と課題の影響
- 市場の機会・抑制要因
第12章 競合情勢
- 概要
- 競合情勢
- 混乱の状況
- 業界のリスク
第13章 競合分析
- 企業プロファイル
- 企業の市場ポジショニング
- Acmefil Engineering Systems Pvt. Ltd.
- Advanced Drying Systems
- BUCHI Labortechnik AG
- Changzhou Jinqiao Spray Drying and Engineering Co. Ltd.
- Changzhou Lemar Drying Engineering Co. Ltd.
- Freund Vector Corp.
- GEA Group AG
- Labplant UK Ltd.
- New AVM Systech Pvt. Ltd.
- Saka Engineering Systems Pvt. Ltd.
- Shandong Tianli Energy Co. Ltd.
- SiccaDania
- SPX FLOW Inc.
- Tetra Laval SA
- Yamato Scientific Co. Ltd.
第14章 付録
Exhibits:
- Exhibits1: Executive Summary - Chart on Market Overview
- Exhibits2: Executive Summary - Data Table on Market Overview
- Exhibits3: Executive Summary - Chart on Global Market Characteristics
- Exhibits4: Executive Summary - Chart on Market By Geographical Landscape
- Exhibits5: Executive Summary - Chart on Market Segmentation by Application
- Exhibits6: Executive Summary - Chart on Market Segmentation by Product
- Exhibits7: Executive Summary - Chart on Market Segmentation by Type
- Exhibits8: Executive Summary - Chart on Incremental Growth
- Exhibits9: Executive Summary - Data Table on Incremental Growth
- Exhibits10: Executive Summary - Chart on Company Market Positioning
- Exhibits11: Parent Market
- Exhibits12: Data Table on - Parent Market
- Exhibits13: Market characteristics analysis
- Exhibits14: Value Chain Analysis
- Exhibits15: Offerings of companies included in the market definition
- Exhibits16: Market segments
- Exhibits17: Chart on Global - Market size and forecast 2023-2028 ($ million)
- Exhibits18: Data Table on Global - Market size and forecast 2023-2028 ($ million)
- Exhibits19: Chart on Global Market: Year-over-year growth 2023-2028 (%)
- Exhibits20: Data Table on Global Market: Year-over-year growth 2023-2028 (%)
- Exhibits21: Historic Market Size - Data Table on Global Food Spray Drying Equipment Market 2018 - 2022 ($ million)
- Exhibits22: Historic Market Size - Application Segment 2018 - 2022 ($ million)
- Exhibits23: Historic Market Size - Product Segment 2018 - 2022 ($ million)
- Exhibits24: Historic Market Size - Type Segment 2018 - 2022 ($ million)
- Exhibits25: Historic Market Size - Geography Segment 2018 - 2022 ($ million)
- Exhibits26: Historic Market Size - Country Segment 2018 - 2022 ($ million)
- Exhibits27: Five forces analysis - Comparison between 2023 and 2028
- Exhibits28: Bargaining power of buyers - Impact of key factors 2023 and 2028
- Exhibits29: Bargaining power of suppliers - Impact of key factors in 2023 and 2028
- Exhibits30: Threat of new entrants - Impact of key factors in 2023 and 2028
- Exhibits31: Threat of substitutes - Impact of key factors in 2023 and 2028
- Exhibits32: Threat of rivalry - Impact of key factors in 2023 and 2028
- Exhibits33: Chart on Market condition - Five forces 2023 and 2028
- Exhibits34: Chart on Application - Market share 2023-2028 (%)
- Exhibits35: Data Table on Application - Market share 2023-2028 (%)
- Exhibits36: Chart on Comparison by Application
- Exhibits37: Data Table on Comparison by Application
- Exhibits38: Chart on Milk products - Market size and forecast 2023-2028 ($ million)
- Exhibits39: Data Table on Milk products - Market size and forecast 2023-2028 ($ million)
- Exhibits40: Chart on Milk products - Year-over-year growth 2023-2028 (%)
- Exhibits41: Data Table on Milk products - Year-over-year growth 2023-2028 (%)
- Exhibits42: Chart on Plant products fish and meat proteins - Market size and forecast 2023-2028 ($ million)
- Exhibits43: Data Table on Plant products fish and meat proteins - Market size and forecast 2023-2028 ($ million)
- Exhibits44: Chart on Plant products fish and meat proteins - Year-over-year growth 2023-2028 (%)
- Exhibits45: Data Table on Plant products fish and meat proteins - Year-over-year growth 2023-2028 (%)
- Exhibits46: Chart on Fruit and vegetable products - Market size and forecast 2023-2028 ($ million)
- Exhibits47: Data Table on Fruit and vegetable products - Market size and forecast 2023-2028 ($ million)
- Exhibits48: Chart on Fruit and vegetable products - Year-over-year growth 2023-2028 (%)
- Exhibits49: Data Table on Fruit and vegetable products - Year-over-year growth 2023-2028 (%)
- Exhibits50: Chart on Carbohydrate products - Market size and forecast 2023-2028 ($ million)
- Exhibits51: Data Table on Carbohydrate products - Market size and forecast 2023-2028 ($ million)
- Exhibits52: Chart on Carbohydrate products - Year-over-year growth 2023-2028 (%)
- Exhibits53: Data Table on Carbohydrate products - Year-over-year growth 2023-2028 (%)
- Exhibits54: Chart on Others - Market size and forecast 2023-2028 ($ million)
- Exhibits55: Data Table on Others - Market size and forecast 2023-2028 ($ million)
- Exhibits56: Chart on Others - Year-over-year growth 2023-2028 (%)
- Exhibits57: Data Table on Others - Year-over-year growth 2023-2028 (%)
- Exhibits58: Market opportunity by Application ($ million)
- Exhibits59: Data Table on Market opportunity by Application ($ million)
- Exhibits60: Chart on Product - Market share 2023-2028 (%)
- Exhibits61: Data Table on Product - Market share 2023-2028 (%)
- Exhibits62: Chart on Comparison by Product
- Exhibits63: Data Table on Comparison by Product
- Exhibits64: Chart on Two-stage spray dryer - Market size and forecast 2023-2028 ($ million)
- Exhibits65: Data Table on Two-stage spray dryer - Market size and forecast 2023-2028 ($ million)
- Exhibits66: Chart on Two-stage spray dryer - Year-over-year growth 2023-2028 (%)
- Exhibits67: Data Table on Two-stage spray dryer - Year-over-year growth 2023-2028 (%)
- Exhibits68: Chart on Multi-stage spray dryer - Market size and forecast 2023-2028 ($ million)
- Exhibits69: Data Table on Multi-stage spray dryer - Market size and forecast 2023-2028 ($ million)
- Exhibits70: Chart on Multi-stage spray dryer - Year-over-year growth 2023-2028 (%)
- Exhibits71: Data Table on Multi-stage spray dryer - Year-over-year growth 2023-2028 (%)
- Exhibits72: Chart on Single-stage spray dryer - Market size and forecast 2023-2028 ($ million)
- Exhibits73: Data Table on Single-stage spray dryer - Market size and forecast 2023-2028 ($ million)
- Exhibits74: Chart on Single-stage spray dryer - Year-over-year growth 2023-2028 (%)
- Exhibits75: Data Table on Single-stage spray dryer - Year-over-year growth 2023-2028 (%)
- Exhibits76: Market opportunity by Product ($ million)
- Exhibits77: Data Table on Market opportunity by Product ($ million)
- Exhibits78: Chart on Type - Market share 2023-2028 (%)
- Exhibits79: Data Table on Type - Market share 2023-2028 (%)
- Exhibits80: Chart on Comparison by Type
- Exhibits81: Data Table on Comparison by Type
- Exhibits82: Chart on Pressure single-fluid nozzle atomizer - Market size and forecast 2023-2028 ($ million)
- Exhibits83: Data Table on Pressure single-fluid nozzle atomizer - Market size and forecast 2023-2028 ($ million)
- Exhibits84: Chart on Pressure single-fluid nozzle atomizer - Year-over-year growth 2023-2028 (%)
- Exhibits85: Data Table on Pressure single-fluid nozzle atomizer - Year-over-year growth 2023-2028 (%)
- Exhibits86: Chart on Rotary wheel atomizer - Market size and forecast 2023-2028 ($ million)
- Exhibits87: Data Table on Rotary wheel atomizer - Market size and forecast 2023-2028 ($ million)
- Exhibits88: Chart on Rotary wheel atomizer - Year-over-year growth 2023-2028 (%)
- Exhibits89: Data Table on Rotary wheel atomizer - Year-over-year growth 2023-2028 (%)
- Exhibits90: Chart on Pneumatic two-fluid nozzle atomizer - Market size and forecast 2023-2028 ($ million)
- Exhibits91: Data Table on Pneumatic two-fluid nozzle atomizer - Market size and forecast 2023-2028 ($ million)
- Exhibits92: Chart on Pneumatic two-fluid nozzle atomizer - Year-over-year growth 2023-2028 (%)
- Exhibits93: Data Table on Pneumatic two-fluid nozzle atomizer - Year-over-year growth 2023-2028 (%)
- Exhibits94: Market opportunity by Type ($ million)
- Exhibits95: Data Table on Market opportunity by Type ($ million)
- Exhibits96: Analysis of price sensitivity, lifecycle, customer purchase basket, adoption rates, and purchase criteria
- Exhibits97: Chart on Market share By Geographical Landscape 2023-2028 (%)
- Exhibits98: Data Table on Market share By Geographical Landscape 2023-2028 (%)
- Exhibits99: Chart on Geographic comparison
- Exhibits100: Data Table on Geographic comparison
- Exhibits101: Chart on APAC - Market size and forecast 2023-2028 ($ million)
- Exhibits102: Data Table on APAC - Market size and forecast 2023-2028 ($ million)
- Exhibits103: Chart on APAC - Year-over-year growth 2023-2028 (%)
- Exhibits104: Data Table on APAC - Year-over-year growth 2023-2028 (%)
- Exhibits105: Chart on Europe - Market size and forecast 2023-2028 ($ million)
- Exhibits106: Data Table on Europe - Market size and forecast 2023-2028 ($ million)
- Exhibits107: Chart on Europe - Year-over-year growth 2023-2028 (%)
- Exhibits108: Data Table on Europe - Year-over-year growth 2023-2028 (%)
- Exhibits109: Chart on North America - Market size and forecast 2023-2028 ($ million)
- Exhibits110: Data Table on North America - Market size and forecast 2023-2028 ($ million)
- Exhibits111: Chart on North America - Year-over-year growth 2023-2028 (%)
- Exhibits112: Data Table on North America - Year-over-year growth 2023-2028 (%)
- Exhibits113: Chart on South America - Market size and forecast 2023-2028 ($ million)
- Exhibits114: Data Table on South America - Market size and forecast 2023-2028 ($ million)
- Exhibits115: Chart on South America - Year-over-year growth 2023-2028 (%)
- Exhibits116: Data Table on South America - Year-over-year growth 2023-2028 (%)
- Exhibits117: Chart on Middle East and Africa - Market size and forecast 2023-2028 ($ million)
- Exhibits118: Data Table on Middle East and Africa - Market size and forecast 2023-2028 ($ million)
- Exhibits119: Chart on Middle East and Africa - Year-over-year growth 2023-2028 (%)
- Exhibits120: Data Table on Middle East and Africa - Year-over-year growth 2023-2028 (%)
- Exhibits121: Chart on US - Market size and forecast 2023-2028 ($ million)
- Exhibits122: Data Table on US - Market size and forecast 2023-2028 ($ million)
- Exhibits123: Chart on US - Year-over-year growth 2023-2028 (%)
- Exhibits124: Data Table on US - Year-over-year growth 2023-2028 (%)
- Exhibits125: Chart on China - Market size and forecast 2023-2028 ($ million)
- Exhibits126: Data Table on China - Market size and forecast 2023-2028 ($ million)
- Exhibits127: Chart on China - Year-over-year growth 2023-2028 (%)
- Exhibits128: Data Table on China - Year-over-year growth 2023-2028 (%)
- Exhibits129: Chart on Germany - Market size and forecast 2023-2028 ($ million)
- Exhibits130: Data Table on Germany - Market size and forecast 2023-2028 ($ million)
- Exhibits131: Chart on Germany - Year-over-year growth 2023-2028 (%)
- Exhibits132: Data Table on Germany - Year-over-year growth 2023-2028 (%)
- Exhibits133: Chart on Japan - Market size and forecast 2023-2028 ($ million)
- Exhibits134: Data Table on Japan - Market size and forecast 2023-2028 ($ million)
- Exhibits135: Chart on Japan - Year-over-year growth 2023-2028 (%)
- Exhibits136: Data Table on Japan - Year-over-year growth 2023-2028 (%)
- Exhibits137: Chart on UK - Market size and forecast 2023-2028 ($ million)
- Exhibits138: Data Table on UK - Market size and forecast 2023-2028 ($ million)
- Exhibits139: Chart on UK - Year-over-year growth 2023-2028 (%)
- Exhibits140: Data Table on UK - Year-over-year growth 2023-2028 (%)
- Exhibits141: Market opportunity By Geographical Landscape ($ million)
- Exhibits142: Data Tables on Market opportunity By Geographical Landscape ($ million)
- Exhibits143: Impact of drivers and challenges in 2023 and 2028
- Exhibits144: Overview on criticality of inputs and factors of differentiation
- Exhibits145: Overview on factors of disruption
- Exhibits146: Impact of key risks on business
- Exhibits147: Companies covered
- Exhibits148: Matrix on companies position and classification
- Exhibits149: Acmefil Engineering Systems Pvt. Ltd. - Overview
- Exhibits150: Acmefil Engineering Systems Pvt. Ltd. - Product / Service
- Exhibits151: Acmefil Engineering Systems Pvt. Ltd. - Key offerings
- Exhibits152: Advanced Drying Systems - Overview
- Exhibits153: Advanced Drying Systems - Product / Service
- Exhibits154: Advanced Drying Systems - Key offerings
- Exhibits155: BUCHI Labortechnik AG - Overview
- Exhibits156: BUCHI Labortechnik AG - Product / Service
- Exhibits157: BUCHI Labortechnik AG - Key offerings
- Exhibits158: Changzhou Jinqiao Spray Drying and Engineering Co. Ltd. - Overview
- Exhibits159: Changzhou Jinqiao Spray Drying and Engineering Co. Ltd. - Product / Service
- Exhibits160: Changzhou Jinqiao Spray Drying and Engineering Co. Ltd. - Key offerings
- Exhibits161: Changzhou Lemar Drying Engineering Co. Ltd. - Overview
- Exhibits162: Changzhou Lemar Drying Engineering Co. Ltd. - Product / Service
- Exhibits163: Changzhou Lemar Drying Engineering Co. Ltd. - Key offerings
- Exhibits164: Freund Vector Corp. - Overview
- Exhibits165: Freund Vector Corp. - Product / Service
- Exhibits166: Freund Vector Corp. - Key offerings
- Exhibits167: GEA Group AG - Overview
- Exhibits168: GEA Group AG - Business segments
- Exhibits169: GEA Group AG - Key news
- Exhibits170: GEA Group AG - Key offerings
- Exhibits171: GEA Group AG - Segment focus
- Exhibits172: Labplant UK Ltd. - Overview
- Exhibits173: Labplant UK Ltd. - Product / Service
- Exhibits174: Labplant UK Ltd. - Key offerings
- Exhibits175: New AVM Systech Pvt. Ltd. - Overview
- Exhibits176: New AVM Systech Pvt. Ltd. - Product / Service
- Exhibits177: New AVM Systech Pvt. Ltd. - Key offerings
- Exhibits178: Saka Engineering Systems Pvt. Ltd. - Overview
- Exhibits179: Saka Engineering Systems Pvt. Ltd. - Product / Service
- Exhibits180: Saka Engineering Systems Pvt. Ltd. - Key offerings
- Exhibits181: Shandong Tianli Energy Co. Ltd. - Overview
- Exhibits182: Shandong Tianli Energy Co. Ltd. - Product / Service
- Exhibits183: Shandong Tianli Energy Co. Ltd. - Key offerings
- Exhibits184: SiccaDania - Overview
- Exhibits185: SiccaDania - Product / Service
- Exhibits186: SiccaDania - Key offerings
- Exhibits187: SPX FLOW Inc. - Overview
- Exhibits188: SPX FLOW Inc. - Product / Service
- Exhibits189: SPX FLOW Inc. - Key news
- Exhibits190: SPX FLOW Inc. - Key offerings
- Exhibits191: Tetra Laval SA - Overview
- Exhibits192: Tetra Laval SA - Product / Service
- Exhibits193: Tetra Laval SA - Key news
- Exhibits194: Tetra Laval SA - Key offerings
- Exhibits195: Yamato Scientific Co. Ltd. - Overview
- Exhibits196: Yamato Scientific Co. Ltd. - Product / Service
- Exhibits197: Yamato Scientific Co. Ltd. - Key offerings
- Exhibits198: Inclusions checklist
- Exhibits199: Exclusions checklist
- Exhibits200: Currency conversion rates for US$
- Exhibits201: Research methodology
- Exhibits202: Information sources
- Exhibits203: Data validation
- Exhibits204: Validation techniques employed for market sizing
- Exhibits205: Data synthesis
- Exhibits206: 360 degree market analysis
- Exhibits207: List of abbreviations
Food Spray Drying Equipment Market 2024-2028
The food spray drying equipment market is forecasted to grow by USD 551.7 mn during 2023-2028, accelerating at a CAGR of 4.36% during the forecast period. The report on the food spray drying equipment market provides a holistic analysis, market size and forecast, trends, growth drivers, and challenges, as well as vendor analysis covering around 25 vendors.
The report offers an up-to-date analysis regarding the current market scenario, the latest trends and drivers, and the overall market environment. The market is driven by rise in adoption of infant formula, expansions of plants in food processing industry, and growing market for fortified and RTE food products.
| Market Scope | |
|---|---|
| Base Year | 2024 |
| End Year | 2028 |
| Series Year | 2024-2028 |
| Growth Momentum | Accelerate |
| YOY 2024 | 4.11% |
| CAGR | 4.36% |
| Incremental Value | $551.7 mn |
Technavio's food spray drying equipment market is segmented as below:
By Application
- Milk products
- Plant products fish and meat proteins
- Fruit and vegetable products
- Carbohydrate products
- Others
By Product
- Two-stage spray dryer
- Multi-stage spray dryer
- Single-stage spray dryer
By Type
- Pressure single-fluid nozzle atomizer
- Rotary wheel atomizer
- Pneumatic two-fluid nozzle atomizer
By Geographical Landscape
- APAC
- Europe
- North America
- South America
- Middle East and Africa
This study identifies the application of spray drying equipment for food encapsulation as one of the prime reasons driving the food spray drying equipment market growth during the next few years. Also, developments in spray drying systems and prevalence of magnetic spray machines (MSM) will lead to sizable demand in the market.
The report on the food spray drying equipment market covers the following areas:
- Food spray drying equipment market sizing
- Food spray drying equipment market forecast
- Food spray drying equipment market industry analysis
The robust vendor analysis is designed to help clients improve their market position, and in line with this, this report provides a detailed analysis of several leading food spray drying equipment market vendors that include Acmefil Engineering Systems Pvt. Ltd., Advanced Drying Systems, BUCHI Labortechnik AG, Carrier Process Equipment Group Inc., Changzhou Jinqiao Spray Drying and Engineering Co. Ltd., Changzhou Lemar Drying Engineering Co. Ltd., Durr AG, Freund Vector Corp., G. Larsson Starch Technology AB, GEA Group AG, Hemraj Engineering India LLP, Labplant UK Ltd., New AVM Systech Pvt. Ltd., Saka Engineering Systems Pvt. Ltd., Shandong Tianli Energy Co. Ltd., SiccaDania, SPX FLOW Inc., TETRA Laval SA, and Yamato Scientific Co. Ltd.. Also, the food spray drying equipment market analysis report includes information on upcoming trends and challenges that will influence market growth. This is to help companies strategize and leverage all forthcoming growth opportunities.
The study was conducted using an objective combination of primary and secondary information including inputs from key participants in the industry. The report contains a comprehensive market and vendor landscape in addition to an analysis of the key vendors.
The publisher presents a detailed picture of the market by the way of study, synthesis, and summation of data from multiple sources by an analysis of key parameters such as profit, pricing, competition, and promotions. It presents various market facets by identifying the key industry influencers. The data presented is comprehensive, reliable, and a result of extensive research - both primary and secondary. The market research reports provide a complete competitive landscape and an in-depth vendor selection methodology and analysis using qualitative and quantitative research to forecast the accurate market growth.
Table of Contents
1 Executive Summary
- 1.1 Market overview
- Executive Summary - Chart on Market Overview
- Executive Summary - Data Table on Market Overview
- Executive Summary - Chart on Global Market Characteristics
- Executive Summary - Chart on Market By Geographical Landscape
- Executive Summary - Chart on Market Segmentation by Application
- Executive Summary - Chart on Market Segmentation by Product
- Executive Summary - Chart on Market Segmentation by Type
- Executive Summary - Chart on Incremental Growth
- Executive Summary - Data Table on Incremental Growth
- Executive Summary - Chart on Company Market Positioning
2 Market Landscape
- 2.1 Market ecosystem
- Parent Market
- Data Table on - Parent Market
- 2.2 Market characteristics
- Market characteristics analysis
- 2.3 Value chain analysis
- Value Chain Analysis
3 Market Sizing
- 3.1 Market definition
- Offerings of companies included in the market definition
- 3.2 Market segment analysis
- Market segments
- 3.3 Market size 2023
- 3.4 Market outlook: Forecast for 2023-2028
- Chart on Global - Market size and forecast 2023-2028 ($ million)
- Data Table on Global - Market size and forecast 2023-2028 ($ million)
- Chart on Global Market: Year-over-year growth 2023-2028 (%)
- Data Table on Global Market: Year-over-year growth 2023-2028 (%)
4 Historic Market Size
- 4.1 Global Food Spray Drying Equipment Market 2018 - 2022
- Historic Market Size - Data Table on Global Food Spray Drying Equipment Market 2018 - 2022 ($ million)
- 4.2 Application segment analysis 2018 - 2022
- Historic Market Size - Application Segment 2018 - 2022 ($ million)
- 4.3 Product segment analysis 2018 - 2022
- Historic Market Size - Product Segment 2018 - 2022 ($ million)
- 4.4 Type segment analysis 2018 - 2022
- Historic Market Size - Type Segment 2018 - 2022 ($ million)
- 4.5 Geography segment analysis 2018 - 2022
- Historic Market Size - Geography Segment 2018 - 2022 ($ million)
- 4.6 Country segment analysis 2018 - 2022
- Historic Market Size - Country Segment 2018 - 2022 ($ million)
5 Five Forces Analysis
- 5.1 Five forces summary
- Five forces analysis - Comparison between 2023 and 2028
- 5.2 Bargaining power of buyers
- Bargaining power of buyers - Impact of key factors 2023 and 2028
- 5.3 Bargaining power of suppliers
- Bargaining power of suppliers - Impact of key factors in 2023 and 2028
- 5.4 Threat of new entrants
- Threat of new entrants - Impact of key factors in 2023 and 2028
- 5.5 Threat of substitutes
- Threat of substitutes - Impact of key factors in 2023 and 2028
- 5.6 Threat of rivalry
- Threat of rivalry - Impact of key factors in 2023 and 2028
- 5.7 Market condition
- Chart on Market condition - Five forces 2023 and 2028
6 Market Segmentation by Application
- 6.1 Market segments
- Chart on Application - Market share 2023-2028 (%)
- Data Table on Application - Market share 2023-2028 (%)
- 6.2 Comparison by Application
- Chart on Comparison by Application
- Data Table on Comparison by Application
- 6.3 Milk products - Market size and forecast 2023-2028
- Chart on Milk products - Market size and forecast 2023-2028 ($ million)
- Data Table on Milk products - Market size and forecast 2023-2028 ($ million)
- Chart on Milk products - Year-over-year growth 2023-2028 (%)
- Data Table on Milk products - Year-over-year growth 2023-2028 (%)
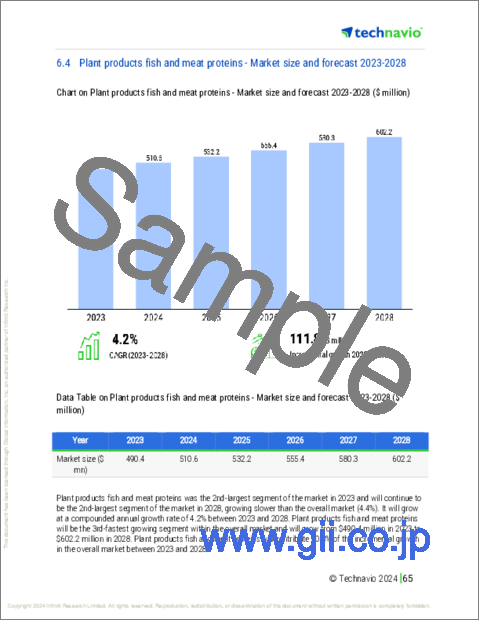
- 6.4 Plant products fish and meat proteins - Market size and forecast 2023-2028
- Chart on Plant products fish and meat proteins - Market size and forecast 2023-2028 ($ million)
- Data Table on Plant products fish and meat proteins - Market size and forecast 2023-2028 ($ million)
- Chart on Plant products fish and meat proteins - Year-over-year growth 2023-2028 (%)
- Data Table on Plant products fish and meat proteins - Year-over-year growth 2023-2028 (%)
- 6.5 Fruit and vegetable products - Market size and forecast 2023-2028
- Chart on Fruit and vegetable products - Market size and forecast 2023-2028 ($ million)
- Data Table on Fruit and vegetable products - Market size and forecast 2023-2028 ($ million)
- Chart on Fruit and vegetable products - Year-over-year growth 2023-2028 (%)
- Data Table on Fruit and vegetable products - Year-over-year growth 2023-2028 (%)
- 6.6 Carbohydrate products - Market size and forecast 2023-2028
- Chart on Carbohydrate products - Market size and forecast 2023-2028 ($ million)
- Data Table on Carbohydrate products - Market size and forecast 2023-2028 ($ million)
- Chart on Carbohydrate products - Year-over-year growth 2023-2028 (%)
- Data Table on Carbohydrate products - Year-over-year growth 2023-2028 (%)
- 6.7 Others - Market size and forecast 2023-2028
- Chart on Others - Market size and forecast 2023-2028 ($ million)
- Data Table on Others - Market size and forecast 2023-2028 ($ million)
- Chart on Others - Year-over-year growth 2023-2028 (%)
- Data Table on Others - Year-over-year growth 2023-2028 (%)
- 6.8 Market opportunity by Application
- Market opportunity by Application ($ million)
- Data Table on Market opportunity by Application ($ million)
7 Market Segmentation by Product
- 7.1 Market segments
- Chart on Product - Market share 2023-2028 (%)
- Data Table on Product - Market share 2023-2028 (%)
- 7.2 Comparison by Product
- Chart on Comparison by Product
- Data Table on Comparison by Product
- 7.3 Two-stage spray dryer - Market size and forecast 2023-2028
- Chart on Two-stage spray dryer - Market size and forecast 2023-2028 ($ million)
- Data Table on Two-stage spray dryer - Market size and forecast 2023-2028 ($ million)
- Chart on Two-stage spray dryer - Year-over-year growth 2023-2028 (%)
- Data Table on Two-stage spray dryer - Year-over-year growth 2023-2028 (%)
- 7.4 Multi-stage spray dryer - Market size and forecast 2023-2028
- Chart on Multi-stage spray dryer - Market size and forecast 2023-2028 ($ million)
- Data Table on Multi-stage spray dryer - Market size and forecast 2023-2028 ($ million)
- Chart on Multi-stage spray dryer - Year-over-year growth 2023-2028 (%)
- Data Table on Multi-stage spray dryer - Year-over-year growth 2023-2028 (%)
- 7.5 Single-stage spray dryer - Market size and forecast 2023-2028
- Chart on Single-stage spray dryer - Market size and forecast 2023-2028 ($ million)
- Data Table on Single-stage spray dryer - Market size and forecast 2023-2028 ($ million)
- Chart on Single-stage spray dryer - Year-over-year growth 2023-2028 (%)
- Data Table on Single-stage spray dryer - Year-over-year growth 2023-2028 (%)
- 7.6 Market opportunity by Product
- Market opportunity by Product ($ million)
- Data Table on Market opportunity by Product ($ million)
8 Market Segmentation by Type
- 8.1 Market segments
- Chart on Type - Market share 2023-2028 (%)
- Data Table on Type - Market share 2023-2028 (%)
- 8.2 Comparison by Type
- Chart on Comparison by Type
- Data Table on Comparison by Type
- 8.3 Pressure single-fluid nozzle atomizer - Market size and forecast 2023-2028
- Chart on Pressure single-fluid nozzle atomizer - Market size and forecast 2023-2028 ($ million)
- Data Table on Pressure single-fluid nozzle atomizer - Market size and forecast 2023-2028 ($ million)
- Chart on Pressure single-fluid nozzle atomizer - Year-over-year growth 2023-2028 (%)
- Data Table on Pressure single-fluid nozzle atomizer - Year-over-year growth 2023-2028 (%)
- 8.4 Rotary wheel atomizer - Market size and forecast 2023-2028
- Chart on Rotary wheel atomizer - Market size and forecast 2023-2028 ($ million)
- Data Table on Rotary wheel atomizer - Market size and forecast 2023-2028 ($ million)
- Chart on Rotary wheel atomizer - Year-over-year growth 2023-2028 (%)
- Data Table on Rotary wheel atomizer - Year-over-year growth 2023-2028 (%)
- 8.5 Pneumatic two-fluid nozzle atomizer - Market size and forecast 2023-2028
- Chart on Pneumatic two-fluid nozzle atomizer - Market size and forecast 2023-2028 ($ million)
- Data Table on Pneumatic two-fluid nozzle atomizer - Market size and forecast 2023-2028 ($ million)
- Chart on Pneumatic two-fluid nozzle atomizer - Year-over-year growth 2023-2028 (%)
- Data Table on Pneumatic two-fluid nozzle atomizer - Year-over-year growth 2023-2028 (%)
- 8.6 Market opportunity by Type
- Market opportunity by Type ($ million)
- Data Table on Market opportunity by Type ($ million)
9 Customer Landscape
- 9.1 Customer landscape overview
- Analysis of price sensitivity, lifecycle, customer purchase basket, adoption rates, and purchase criteria
10 Geographic Landscape
- 10.1 Geographic segmentation
- Chart on Market share By Geographical Landscape 2023-2028 (%)
- Data Table on Market share By Geographical Landscape 2023-2028 (%)
- 10.2 Geographic comparison
- Chart on Geographic comparison
- Data Table on Geographic comparison
- 10.3 APAC - Market size and forecast 2023-2028
- Chart on APAC - Market size and forecast 2023-2028 ($ million)
- Data Table on APAC - Market size and forecast 2023-2028 ($ million)
- Chart on APAC - Year-over-year growth 2023-2028 (%)
- Data Table on APAC - Year-over-year growth 2023-2028 (%)
- 10.4 Europe - Market size and forecast 2023-2028
- Chart on Europe - Market size and forecast 2023-2028 ($ million)
- Data Table on Europe - Market size and forecast 2023-2028 ($ million)
- Chart on Europe - Year-over-year growth 2023-2028 (%)
- Data Table on Europe - Year-over-year growth 2023-2028 (%)
- 10.5 North America - Market size and forecast 2023-2028
- Chart on North America - Market size and forecast 2023-2028 ($ million)
- Data Table on North America - Market size and forecast 2023-2028 ($ million)
- Chart on North America - Year-over-year growth 2023-2028 (%)
- Data Table on North America - Year-over-year growth 2023-2028 (%)
- 10.6 South America - Market size and forecast 2023-2028
- Chart on South America - Market size and forecast 2023-2028 ($ million)
- Data Table on South America - Market size and forecast 2023-2028 ($ million)
- Chart on South America - Year-over-year growth 2023-2028 (%)
- Data Table on South America - Year-over-year growth 2023-2028 (%)
- 10.7 Middle East and Africa - Market size and forecast 2023-2028
- Chart on Middle East and Africa - Market size and forecast 2023-2028 ($ million)
- Data Table on Middle East and Africa - Market size and forecast 2023-2028 ($ million)
- Chart on Middle East and Africa - Year-over-year growth 2023-2028 (%)
- Data Table on Middle East and Africa - Year-over-year growth 2023-2028 (%)
- 10.8 US - Market size and forecast 2023-2028
- Chart on US - Market size and forecast 2023-2028 ($ million)
- Data Table on US - Market size and forecast 2023-2028 ($ million)
- Chart on US - Year-over-year growth 2023-2028 (%)
- Data Table on US - Year-over-year growth 2023-2028 (%)
- 10.9 China - Market size and forecast 2023-2028
- Chart on China - Market size and forecast 2023-2028 ($ million)
- Data Table on China - Market size and forecast 2023-2028 ($ million)
- Chart on China - Year-over-year growth 2023-2028 (%)
- Data Table on China - Year-over-year growth 2023-2028 (%)
- 10.10 Germany - Market size and forecast 2023-2028
- Chart on Germany - Market size and forecast 2023-2028 ($ million)
- Data Table on Germany - Market size and forecast 2023-2028 ($ million)
- Chart on Germany - Year-over-year growth 2023-2028 (%)
- Data Table on Germany - Year-over-year growth 2023-2028 (%)
- 10.11 Japan - Market size and forecast 2023-2028
- Chart on Japan - Market size and forecast 2023-2028 ($ million)
- Data Table on Japan - Market size and forecast 2023-2028 ($ million)
- Chart on Japan - Year-over-year growth 2023-2028 (%)
- Data Table on Japan - Year-over-year growth 2023-2028 (%)
- 10.12 UK - Market size and forecast 2023-2028
- Chart on UK - Market size and forecast 2023-2028 ($ million)
- Data Table on UK - Market size and forecast 2023-2028 ($ million)
- Chart on UK - Year-over-year growth 2023-2028 (%)
- Data Table on UK - Year-over-year growth 2023-2028 (%)
- 10.13 Market opportunity By Geographical Landscape
- Market opportunity By Geographical Landscape ($ million)
- Data Tables on Market opportunity By Geographical Landscape ($ million)
11 Drivers, Challenges, and Opportunity/Restraints
- 11.1 Market drivers
- 11.2 Market challenges
- 11.3 Impact of drivers and challenges
- Impact of drivers and challenges in 2023 and 2028
- 11.4 Market opportunities/restraints
12 Competitive Landscape
- 12.1 Overview
- 12.2 Competitive Landscape
- Overview on criticality of inputs and factors of differentiation
- 12.3 Landscape disruption
- Overview on factors of disruption
- 12.4 Industry risks
- Impact of key risks on business
13 Competitive Analysis
- 13.1 Companies profiled
- Companies covered
- 13.2 Market positioning of companies
- Matrix on companies position and classification
- 13.3 Acmefil Engineering Systems Pvt. Ltd.
- Acmefil Engineering Systems Pvt. Ltd. - Overview
- Acmefil Engineering Systems Pvt. Ltd. - Product / Service
- Acmefil Engineering Systems Pvt. Ltd. - Key offerings
- 13.4 Advanced Drying Systems
- Advanced Drying Systems - Overview
- Advanced Drying Systems - Product / Service
- Advanced Drying Systems - Key offerings
- 13.5 BUCHI Labortechnik AG
- BUCHI Labortechnik AG - Overview
- BUCHI Labortechnik AG - Product / Service
- BUCHI Labortechnik AG - Key offerings
- 13.6 Changzhou Jinqiao Spray Drying and Engineering Co. Ltd.
- Changzhou Jinqiao Spray Drying and Engineering Co. Ltd. - Overview
- Changzhou Jinqiao Spray Drying and Engineering Co. Ltd. - Product / Service
- Changzhou Jinqiao Spray Drying and Engineering Co. Ltd. - Key offerings
- 13.7 Changzhou Lemar Drying Engineering Co. Ltd.
- Changzhou Lemar Drying Engineering Co. Ltd. - Overview
- Changzhou Lemar Drying Engineering Co. Ltd. - Product / Service
- Changzhou Lemar Drying Engineering Co. Ltd. - Key offerings
- 13.8 Freund Vector Corp.
- Freund Vector Corp. - Overview
- Freund Vector Corp. - Product / Service
- Freund Vector Corp. - Key offerings
- 13.9 GEA Group AG
- GEA Group AG - Overview
- GEA Group AG - Business segments
- GEA Group AG - Key news
- GEA Group AG - Key offerings
- GEA Group AG - Segment focus
- 13.10 Labplant UK Ltd.
- Labplant UK Ltd. - Overview
- Labplant UK Ltd. - Product / Service
- Labplant UK Ltd. - Key offerings
- 13.11 New AVM Systech Pvt. Ltd.
- New AVM Systech Pvt. Ltd. - Overview
- New AVM Systech Pvt. Ltd. - Product / Service
- New AVM Systech Pvt. Ltd. - Key offerings
- 13.12 Saka Engineering Systems Pvt. Ltd.
- Saka Engineering Systems Pvt. Ltd. - Overview
- Saka Engineering Systems Pvt. Ltd. - Product / Service
- Saka Engineering Systems Pvt. Ltd. - Key offerings
- 13.13 Shandong Tianli Energy Co. Ltd.
- Shandong Tianli Energy Co. Ltd. - Overview
- Shandong Tianli Energy Co. Ltd. - Product / Service
- Shandong Tianli Energy Co. Ltd. - Key offerings
- 13.14 SiccaDania
- SiccaDania - Overview
- SiccaDania - Product / Service
- SiccaDania - Key offerings
- 13.15 SPX FLOW Inc.
- SPX FLOW Inc. - Overview
- SPX FLOW Inc. - Product / Service
- SPX FLOW Inc. - Key news
- SPX FLOW Inc. - Key offerings
- 13.16 Tetra Laval SA
- Tetra Laval SA - Overview
- Tetra Laval SA - Product / Service
- Tetra Laval SA - Key news
- Tetra Laval SA - Key offerings
- 13.17 Yamato Scientific Co. Ltd.
- Yamato Scientific Co. Ltd. - Overview
- Yamato Scientific Co. Ltd. - Product / Service
- Yamato Scientific Co. Ltd. - Key offerings
14 Appendix
- 14.1 Scope of the report
- 14.2 Inclusions and exclusions checklist
- Inclusions checklist
- Exclusions checklist
- 14.3 Currency conversion rates for US$
- Currency conversion rates for US$
- 14.4 Research methodology
- Research methodology
- 14.5 Data procurement
- Information sources
- 14.6 Data validation
- Data validation
- 14.7 Validation techniques employed for market sizing
- Validation techniques employed for market sizing
- 14.8 Data synthesis
- Data synthesis
- 14.9 360 degree market analysis
- 360 degree market analysis
- 14.10 List of abbreviations
- List of abbreviations
