|
|
市場調査レポート
商品コード
1557428
オンライン・ランジェリーの世界市場 2024年~2028年Global Online Lingerie Market 2024-2028 |
||||||

|
|||||||
カスタマイズ可能
|
|||||||


| オンライン・ランジェリーの世界市場 2024年~2028年 |
|
出版日: 2024年08月14日
発行: TechNavio
ページ情報: 英文 171 Pages
納期: 即納可能
|

全表示
- 概要
- 図表
- 目次
オンライン・ランジェリー市場は2023年~2028年年に101億5,100万米ドル、予測期間中のCAGRは10.87%で成長すると予測されます。
当レポートでは、オンライン・ランジェリー市場の全体的な分析、市場規模・予測、動向、成長促進要因、課題、約25のベンダーを網羅したベンダー分析などを掲載しています。
現在の市場シナリオ、最新動向と促進要因、市場環境全体に関する最新分析を提供しています。市場は、オンラインスペースで事業を展開する小売業者にとってのコストメリット、eコマース産業の成長に伴うスマートフォンの普及率の増加、価格割引、商品バンドル、限定オファーに伴う消費者の嗜好の変化などが牽引しています。
| 市場範囲 | |
|---|---|
| 基準年 | 2024年 |
| 終了年 | 2028年 |
| 予測期間 | 2024年~2028年 |
| 成長モメンタム | 加速 |
| 前年比2024年 | 9.53% |
| CAGR | 10.87% |
| 増分額 | 101億5,100万米ドル |
本調査では、サブスクリプションサービスの登場が、今後数年間のオンライン・ランジェリー市場の成長を牽引する主要因の1つであると分析しています。また、ソーシャルメディアプラットフォームと組み合わされた最先端技術や、トップブランド、測定アプリ、位置情報サービスの利用可能性が、市場の大きな需要につながります。
目次
第1章 エグゼクティブサマリー
- 市場概要
第2章 市場情勢
- 市場エコシステム
- 市場の特徴
- バリューチェーン分析
第3章 市場規模の評価
- 市場の定義
- 市場セグメント分析
- 市場規模 2023
- 市場の見通し 2023年~2028年
第4章 市場規模実績
- オンライン・ランジェリーの世界市場 2018年~2022年
- 製品セグメント分析 2018年~2022年
- 価格帯セグメント分析 2018年~2022年
- 地域別セグメント分析 2018年~2022年
- 国別セグメント分析 2018年~2022年
第5章 ファイブフォース分析
- ファイブフォースの要約
- 買い手の交渉力
- 供給企業の交渉力
- 新規参入業者の脅威
- 代替品の脅威
- 競争の脅威
- 市況
第6章 市場セグメンテーション:製品別
- 市場セグメンテーション
- 比較:製品別
- ブラジャー:市場規模と予測 2023年~2028年
- パンティー:市場規模と予測 2023年~2028年
- その他:市場規模と予測 2023年~2028年
- 市場機会:製品別
第7章 市場セグメンテーション:価格帯別
- 市場セグメンテーション
- 比較:価格帯別
- 経済的:市場規模と予測 2023年~2028年
- プレミアム:市場規模と予測 2023年~2028年
- 市場機会:価格帯別
第8章 顧客情勢
- 顧客情勢の概要
第9章 地域別情勢
- 地域別セグメンテーション
- 地域別比較
- アジア太平洋:市場規模と予測 2023年~2028年
- 北米:市場規模と予測 2023年~2028年
- 欧州:市場規模と予測 2023年~2028年
- 中東・アフリカ:市場規模と予測 2023年~2028年
- 南米:市場規模と予測 2023年~2028年
- 米国:市場規模と予測 2023年~2028年
- 中国:市場規模と予測 2023年~2028年
- 英国:市場規模と予測 2023年~2028年
- 日本:市場規模と予測 2023年~2028年
- ドイツ:市場規模と予測 2023年~2028年
- 市場機会:地域情勢別
第10章 促進要因・課題・機会・抑制要因
- 市場促進要因
- 市場の課題
- 促進要因と課題の影響
- 市場の機会・抑制要因
第11章 競合情勢
- 概要
- 競合情勢
- 混乱の状況
- 業界のリスク
第12章 競合分析
- 企業プロファイル
- 企業の市場ポジショニング
- Adidas AG
- American Eagle Outfitters Inc
- Chantelle Group
- H and M Hennes and Mauritz GBC AB
- Hanesbrands Inc.
- Jockey International Inc.
- La Maison Lejaby SASU
- Lise Charmel
- Nike Inc.
- Nubian Skin Ltd.
- PVH Corp.
- Reliance Industries Ltd.
- Stockmann Plc
- Victorias Secret and Co.
- Wolf Lingerie SAS
第13章 付録
Exhibits:
- Exhibits1: Executive Summary - Chart on Market Overview
- Exhibits2: Executive Summary - Data Table on Market Overview
- Exhibits3: Executive Summary - Chart on Global Market Characteristics
- Exhibits4: Executive Summary - Chart on Market By Geographical Landscape
- Exhibits5: Executive Summary - Chart on Market Segmentation by Product
- Exhibits6: Executive Summary - Chart on Market Segmentation by Price Range
- Exhibits7: Executive Summary - Chart on Incremental Growth
- Exhibits8: Executive Summary - Data Table on Incremental Growth
- Exhibits9: Executive Summary - Chart on Company Market Positioning
- Exhibits10: Parent Market
- Exhibits11: Data Table on - Parent Market
- Exhibits12: Market characteristics analysis
- Exhibits13: Value Chain Analysis
- Exhibits14: Offerings of companies included in the market definition
- Exhibits15: Market segments
- Exhibits16: Chart on Global - Market size and forecast 2023-2028 ($ million)
- Exhibits17: Data Table on Global - Market size and forecast 2023-2028 ($ million)
- Exhibits18: Chart on Global Market: Year-over-year growth 2023-2028 (%)
- Exhibits19: Data Table on Global Market: Year-over-year growth 2023-2028 (%)
- Exhibits20: Historic Market Size - Data Table on Global Online Lingerie Market 2018 - 2022 ($ million)
- Exhibits21: Historic Market Size - Product Segment 2018 - 2022 ($ million)
- Exhibits22: Historic Market Size - Price Range Segment 2018 - 2022 ($ million)
- Exhibits23: Historic Market Size - Geography Segment 2018 - 2022 ($ million)
- Exhibits24: Historic Market Size - Country Segment 2018 - 2022 ($ million)
- Exhibits25: Five forces analysis - Comparison between 2023 and 2028
- Exhibits26: Bargaining power of buyers - Impact of key factors 2023 and 2028
- Exhibits27: Bargaining power of suppliers - Impact of key factors in 2023 and 2028
- Exhibits28: Threat of new entrants - Impact of key factors in 2023 and 2028
- Exhibits29: Threat of substitutes - Impact of key factors in 2023 and 2028
- Exhibits30: Threat of rivalry - Impact of key factors in 2023 and 2028
- Exhibits31: Chart on Market condition - Five forces 2023 and 2028
- Exhibits32: Chart on Product - Market share 2023-2028 (%)
- Exhibits33: Data Table on Product - Market share 2023-2028 (%)
- Exhibits34: Chart on Comparison by Product
- Exhibits35: Data Table on Comparison by Product
- Exhibits36: Chart on Bras - Market size and forecast 2023-2028 ($ million)
- Exhibits37: Data Table on Bras - Market size and forecast 2023-2028 ($ million)
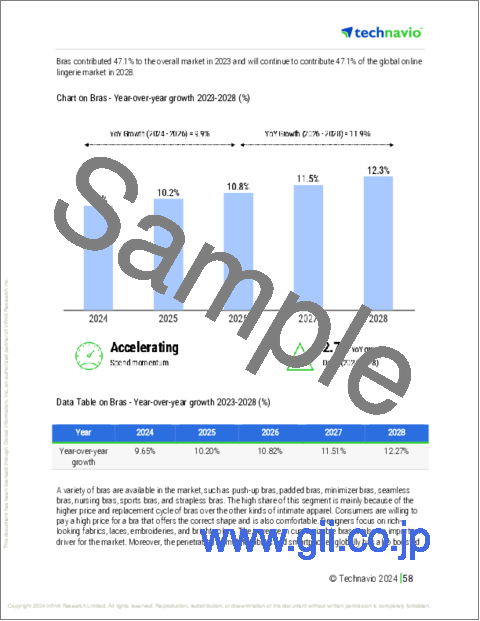
- Exhibits38: Chart on Bras - Year-over-year growth 2023-2028 (%)
- Exhibits39: Data Table on Bras - Year-over-year growth 2023-2028 (%)
- Exhibits40: Chart on Panties - Market size and forecast 2023-2028 ($ million)
- Exhibits41: Data Table on Panties - Market size and forecast 2023-2028 ($ million)
- Exhibits42: Chart on Panties - Year-over-year growth 2023-2028 (%)
- Exhibits43: Data Table on Panties - Year-over-year growth 2023-2028 (%)
- Exhibits44: Chart on Others - Market size and forecast 2023-2028 ($ million)
- Exhibits45: Data Table on Others - Market size and forecast 2023-2028 ($ million)
- Exhibits46: Chart on Others - Year-over-year growth 2023-2028 (%)
- Exhibits47: Data Table on Others - Year-over-year growth 2023-2028 (%)
- Exhibits48: Market opportunity by Product ($ million)
- Exhibits49: Data Table on Market opportunity by Product ($ million)
- Exhibits50: Chart on Price Range - Market share 2023-2028 (%)
- Exhibits51: Data Table on Price Range - Market share 2023-2028 (%)
- Exhibits52: Chart on Comparison by Price Range
- Exhibits53: Data Table on Comparison by Price Range
- Exhibits54: Chart on Economy - Market size and forecast 2023-2028 ($ million)
- Exhibits55: Data Table on Economy - Market size and forecast 2023-2028 ($ million)
- Exhibits56: Chart on Economy - Year-over-year growth 2023-2028 (%)
- Exhibits57: Data Table on Economy - Year-over-year growth 2023-2028 (%)
- Exhibits58: Chart on Premium - Market size and forecast 2023-2028 ($ million)
- Exhibits59: Data Table on Premium - Market size and forecast 2023-2028 ($ million)
- Exhibits60: Chart on Premium - Year-over-year growth 2023-2028 (%)
- Exhibits61: Data Table on Premium - Year-over-year growth 2023-2028 (%)
- Exhibits62: Market opportunity by Price Range ($ million)
- Exhibits63: Data Table on Market opportunity by Price Range ($ million)
- Exhibits64: Analysis of price sensitivity, lifecycle, customer purchase basket, adoption rates, and purchase criteria
- Exhibits65: Chart on Market share By Geographical Landscape 2023-2028 (%)
- Exhibits66: Data Table on Market share By Geographical Landscape 2023-2028 (%)
- Exhibits67: Chart on Geographic comparison
- Exhibits68: Data Table on Geographic comparison
- Exhibits69: Chart on APAC - Market size and forecast 2023-2028 ($ million)
- Exhibits70: Data Table on APAC - Market size and forecast 2023-2028 ($ million)
- Exhibits71: Chart on APAC - Year-over-year growth 2023-2028 (%)
- Exhibits72: Data Table on APAC - Year-over-year growth 2023-2028 (%)
- Exhibits73: Chart on North America - Market size and forecast 2023-2028 ($ million)
- Exhibits74: Data Table on North America - Market size and forecast 2023-2028 ($ million)
- Exhibits75: Chart on North America - Year-over-year growth 2023-2028 (%)
- Exhibits76: Data Table on North America - Year-over-year growth 2023-2028 (%)
- Exhibits77: Chart on Europe - Market size and forecast 2023-2028 ($ million)
- Exhibits78: Data Table on Europe - Market size and forecast 2023-2028 ($ million)
- Exhibits79: Chart on Europe - Year-over-year growth 2023-2028 (%)
- Exhibits80: Data Table on Europe - Year-over-year growth 2023-2028 (%)
- Exhibits81: Chart on Middle East and Africa - Market size and forecast 2023-2028 ($ million)
- Exhibits82: Data Table on Middle East and Africa - Market size and forecast 2023-2028 ($ million)
- Exhibits83: Chart on Middle East and Africa - Year-over-year growth 2023-2028 (%)
- Exhibits84: Data Table on Middle East and Africa - Year-over-year growth 2023-2028 (%)
- Exhibits85: Chart on South America - Market size and forecast 2023-2028 ($ million)
- Exhibits86: Data Table on South America - Market size and forecast 2023-2028 ($ million)
- Exhibits87: Chart on South America - Year-over-year growth 2023-2028 (%)
- Exhibits88: Data Table on South America - Year-over-year growth 2023-2028 (%)
- Exhibits89: Chart on US - Market size and forecast 2023-2028 ($ million)
- Exhibits90: Data Table on US - Market size and forecast 2023-2028 ($ million)
- Exhibits91: Chart on US - Year-over-year growth 2023-2028 (%)
- Exhibits92: Data Table on US - Year-over-year growth 2023-2028 (%)
- Exhibits93: Chart on China - Market size and forecast 2023-2028 ($ million)
- Exhibits94: Data Table on China - Market size and forecast 2023-2028 ($ million)
- Exhibits95: Chart on China - Year-over-year growth 2023-2028 (%)
- Exhibits96: Data Table on China - Year-over-year growth 2023-2028 (%)
- Exhibits97: Chart on UK - Market size and forecast 2023-2028 ($ million)
- Exhibits98: Data Table on UK - Market size and forecast 2023-2028 ($ million)
- Exhibits99: Chart on UK - Year-over-year growth 2023-2028 (%)
- Exhibits100: Data Table on UK - Year-over-year growth 2023-2028 (%)
- Exhibits101: Chart on Japan - Market size and forecast 2023-2028 ($ million)
- Exhibits102: Data Table on Japan - Market size and forecast 2023-2028 ($ million)
- Exhibits103: Chart on Japan - Year-over-year growth 2023-2028 (%)
- Exhibits104: Data Table on Japan - Year-over-year growth 2023-2028 (%)
- Exhibits105: Chart on Germany - Market size and forecast 2023-2028 ($ million)
- Exhibits106: Data Table on Germany - Market size and forecast 2023-2028 ($ million)
- Exhibits107: Chart on Germany - Year-over-year growth 2023-2028 (%)
- Exhibits108: Data Table on Germany - Year-over-year growth 2023-2028 (%)
- Exhibits109: Market opportunity By Geographical Landscape ($ million)
- Exhibits110: Data Tables on Market opportunity By Geographical Landscape ($ million)
- Exhibits111: Impact of drivers and challenges in 2023 and 2028
- Exhibits112: Overview on criticality of inputs and factors of differentiation
- Exhibits113: Overview on factors of disruption
- Exhibits114: Impact of key risks on business
- Exhibits115: Companies covered
- Exhibits116: Matrix on companies position and classification
- Exhibits117: Adidas AG - Overview
- Exhibits118: Adidas AG - Business segments
- Exhibits119: Adidas AG - Key news
- Exhibits120: Adidas AG - Key offerings
- Exhibits121: Adidas AG - Segment focus
- Exhibits122: American Eagle Outfitters Inc - Overview
- Exhibits123: American Eagle Outfitters Inc - Business segments
- Exhibits124: American Eagle Outfitters Inc - Key offerings
- Exhibits125: American Eagle Outfitters Inc - Segment focus
- Exhibits126: Chantelle Group - Overview
- Exhibits127: Chantelle Group - Product / Service
- Exhibits128: Chantelle Group - Key offerings
- Exhibits129: H and M Hennes and Mauritz GBC AB - Overview
- Exhibits130: H and M Hennes and Mauritz GBC AB - Business segments
- Exhibits131: H and M Hennes and Mauritz GBC AB - Key news
- Exhibits132: H and M Hennes and Mauritz GBC AB - Key offerings
- Exhibits133: H and M Hennes and Mauritz GBC AB - Segment focus
- Exhibits134: Hanesbrands Inc. - Overview
- Exhibits135: Hanesbrands Inc. - Business segments
- Exhibits136: Hanesbrands Inc. - Key news
- Exhibits137: Hanesbrands Inc. - Key offerings
- Exhibits138: Hanesbrands Inc. - Segment focus
- Exhibits139: Jockey International Inc. - Overview
- Exhibits140: Jockey International Inc. - Product / Service
- Exhibits141: Jockey International Inc. - Key offerings
- Exhibits142: La Maison Lejaby SASU - Overview
- Exhibits143: La Maison Lejaby SASU - Product / Service
- Exhibits144: La Maison Lejaby SASU - Key offerings
- Exhibits145: Lise Charmel - Overview
- Exhibits146: Lise Charmel - Product / Service
- Exhibits147: Lise Charmel - Key offerings
- Exhibits148: Nike Inc. - Overview
- Exhibits149: Nike Inc. - Business segments
- Exhibits150: Nike Inc. - Key news
- Exhibits151: Nike Inc. - Key offerings
- Exhibits152: Nike Inc. - Segment focus
- Exhibits153: Nubian Skin Ltd. - Overview
- Exhibits154: Nubian Skin Ltd. - Product / Service
- Exhibits155: Nubian Skin Ltd. - Key offerings
- Exhibits156: PVH Corp. - Overview
- Exhibits157: PVH Corp. - Business segments
- Exhibits158: PVH Corp. - Key offerings
- Exhibits159: PVH Corp. - Segment focus
- Exhibits160: Reliance Industries Ltd. - Overview
- Exhibits161: Reliance Industries Ltd. - Business segments
- Exhibits162: Reliance Industries Ltd. - Key news
- Exhibits163: Reliance Industries Ltd. - Key offerings
- Exhibits164: Reliance Industries Ltd. - Segment focus
- Exhibits165: Stockmann Plc - Overview
- Exhibits166: Stockmann Plc - Business segments
- Exhibits167: Stockmann Plc - Key offerings
- Exhibits168: Stockmann Plc - Segment focus
- Exhibits169: Victorias Secret and Co. - Overview
- Exhibits170: Victorias Secret and Co. - Product / Service
- Exhibits171: Victorias Secret and Co. - Key offerings
- Exhibits172: Wolf Lingerie SAS - Overview
- Exhibits173: Wolf Lingerie SAS - Product / Service
- Exhibits174: Wolf Lingerie SAS - Key offerings
- Exhibits175: Inclusions checklist
- Exhibits176: Exclusions checklist
- Exhibits177: Currency conversion rates for US$
- Exhibits178: Research methodology
- Exhibits179: Information sources
- Exhibits180: Data validation
- Exhibits181: Validation techniques employed for market sizing
- Exhibits182: Data synthesis
- Exhibits183: 360 degree market analysis
- Exhibits184: List of abbreviations
The online lingerie market is forecasted to grow by USD 10151 mn during 2023-2028, accelerating at a CAGR of 10.87% during the forecast period. The report on the online lingerie market provides a holistic analysis, market size and forecast, trends, growth drivers, and challenges, as well as vendor analysis covering around 25 vendors.
The report offers an up-to-date analysis regarding the current market scenario, the latest trends and drivers, and the overall market environment. The market is driven by cost benefits for retailers operating in online space, increasing smartphone penetration along with growing e-commerce industry, and changing consumer preferences along with price discounts, product bundling, and exclusive offers.
Technavio's online lingerie market is segmented as below:
| Market Scope | |
|---|---|
| Base Year | 2024 |
| End Year | 2028 |
| Series Year | 2024-2028 |
| Growth Momentum | Accelerate |
| YOY 2024 | 9.53% |
| CAGR | 10.87% |
| Incremental Value | $10151 mn |
By Product
- Bras
- Panties
- Others
By Price Range
- Economy
- Premium
By Geographical Landscape
- APAC
- North America
- Europe
- Middle East and Africa
- South America
This study identifies the advent of subscription services as one of the prime reasons driving the online lingerie market growth during the next few years. Also, cutting edge technology paired with social media platforms and availability of top brands, measurement apps, and location-based services will lead to sizable demand in the market.
The report on the online lingerie market covers the following areas:
- Online lingerie market sizing
- Online lingerie market forecast
- Online lingerie market industry analysis
The robust vendor analysis is designed to help clients improve their market position, and in line with this, this report provides a detailed analysis of several leading online lingerie market vendors that include Adidas AG, American Eagle Outfitters Inc, Chantelle Group, Chantelle SA, Etam Developpement, H and M Hennes and Mauritz GBC AB, Hanesbrands Inc., Jockey International Inc., La Maison Lejaby SASU, Lise Charmel, Nike Inc., Noelle Wolf Ltd., Nubian Skin Ltd., PVH Corp., Reliance Industries Ltd., Stockmann Plc, Triumph Intertrade AG, Victorias Secret and Co., Wacoal Holdings Corp., and Wolf Lingerie SAS. Also, the online lingerie market analysis report includes information on upcoming trends and challenges that will influence market growth. This is to help companies strategize and leverage all forthcoming growth opportunities.
The study was conducted using an objective combination of primary and secondary information including inputs from key participants in the industry. The report contains a comprehensive market and vendor landscape in addition to an analysis of the key vendors.
The publisher presents a detailed picture of the market by the way of study, synthesis, and summation of data from multiple sources by an analysis of key parameters such as profit, pricing, competition, and promotions. It presents various market facets by identifying the key industry influencers. The data presented is comprehensive, reliable, and a result of extensive research - both primary and secondary. The market research reports provide a complete competitive landscape and an in-depth vendor selection methodology and analysis using qualitative and quantitative research to forecast the accurate market growth.
Table of Contents
1 Executive Summary
- 1.1 Market overview
- Executive Summary - Chart on Market Overview
- Executive Summary - Data Table on Market Overview
- Executive Summary - Chart on Global Market Characteristics
- Executive Summary - Chart on Market By Geographical Landscape
- Executive Summary - Chart on Market Segmentation by Product
- Executive Summary - Chart on Market Segmentation by Price Range
- Executive Summary - Chart on Incremental Growth
- Executive Summary - Data Table on Incremental Growth
- Executive Summary - Chart on Company Market Positioning
2 Market Landscape
- 2.1 Market ecosystem
- Parent Market
- Data Table on - Parent Market
- 2.2 Market characteristics
- Market characteristics analysis
- 2.3 Value chain analysis
- Value Chain Analysis
3 Market Sizing
- 3.1 Market definition
- Offerings of companies included in the market definition
- 3.2 Market segment analysis
- Market segments
- 3.3 Market size 2023
- 3.4 Market outlook: Forecast for 2023-2028
- Chart on Global - Market size and forecast 2023-2028 ($ million)
- Data Table on Global - Market size and forecast 2023-2028 ($ million)
- Chart on Global Market: Year-over-year growth 2023-2028 (%)
- Data Table on Global Market: Year-over-year growth 2023-2028 (%)
4 Historic Market Size
- 4.1 Global Online Lingerie Market 2018 - 2022
- Historic Market Size - Data Table on Global Online Lingerie Market 2018 - 2022 ($ million)
- 4.2 Product segment analysis 2018 - 2022
- Historic Market Size - Product Segment 2018 - 2022 ($ million)
- 4.3 Price Range segment analysis 2018 - 2022
- Historic Market Size - Price Range Segment 2018 - 2022 ($ million)
- 4.4 Geography segment analysis 2018 - 2022
- Historic Market Size - Geography Segment 2018 - 2022 ($ million)
- 4.5 Country segment analysis 2018 - 2022
- Historic Market Size - Country Segment 2018 - 2022 ($ million)
5 Five Forces Analysis
- 5.1 Five forces summary
- Five forces analysis - Comparison between 2023 and 2028
- 5.2 Bargaining power of buyers
- Bargaining power of buyers - Impact of key factors 2023 and 2028
- 5.3 Bargaining power of suppliers
- Bargaining power of suppliers - Impact of key factors in 2023 and 2028
- 5.4 Threat of new entrants
- Threat of new entrants - Impact of key factors in 2023 and 2028
- 5.5 Threat of substitutes
- Threat of substitutes - Impact of key factors in 2023 and 2028
- 5.6 Threat of rivalry
- Threat of rivalry - Impact of key factors in 2023 and 2028
- 5.7 Market condition
- Chart on Market condition - Five forces 2023 and 2028
6 Market Segmentation by Product
- 6.1 Market segments
- Chart on Product - Market share 2023-2028 (%)
- Data Table on Product - Market share 2023-2028 (%)
- 6.2 Comparison by Product
- Chart on Comparison by Product
- Data Table on Comparison by Product
- 6.3 Bras - Market size and forecast 2023-2028
- Chart on Bras - Market size and forecast 2023-2028 ($ million)
- Data Table on Bras - Market size and forecast 2023-2028 ($ million)
- Chart on Bras - Year-over-year growth 2023-2028 (%)
- Data Table on Bras - Year-over-year growth 2023-2028 (%)
- 6.4 Panties - Market size and forecast 2023-2028
- Chart on Panties - Market size and forecast 2023-2028 ($ million)
- Data Table on Panties - Market size and forecast 2023-2028 ($ million)
- Chart on Panties - Year-over-year growth 2023-2028 (%)
- Data Table on Panties - Year-over-year growth 2023-2028 (%)
- 6.5 Others - Market size and forecast 2023-2028
- Chart on Others - Market size and forecast 2023-2028 ($ million)
- Data Table on Others - Market size and forecast 2023-2028 ($ million)
- Chart on Others - Year-over-year growth 2023-2028 (%)
- Data Table on Others - Year-over-year growth 2023-2028 (%)
- 6.6 Market opportunity by Product
- Market opportunity by Product ($ million)
- Data Table on Market opportunity by Product ($ million)
7 Market Segmentation by Price Range
- 7.1 Market segments
- Chart on Price Range - Market share 2023-2028 (%)
- Data Table on Price Range - Market share 2023-2028 (%)
- 7.2 Comparison by Price Range
- Chart on Comparison by Price Range
- Data Table on Comparison by Price Range
- 7.3 Economy - Market size and forecast 2023-2028
- Chart on Economy - Market size and forecast 2023-2028 ($ million)
- Data Table on Economy - Market size and forecast 2023-2028 ($ million)
- Chart on Economy - Year-over-year growth 2023-2028 (%)
- Data Table on Economy - Year-over-year growth 2023-2028 (%)
- 7.4 Premium - Market size and forecast 2023-2028
- Chart on Premium - Market size and forecast 2023-2028 ($ million)
- Data Table on Premium - Market size and forecast 2023-2028 ($ million)
- Chart on Premium - Year-over-year growth 2023-2028 (%)
- Data Table on Premium - Year-over-year growth 2023-2028 (%)
- 7.5 Market opportunity by Price Range
- Market opportunity by Price Range ($ million)
- Data Table on Market opportunity by Price Range ($ million)
8 Customer Landscape
- 8.1 Customer landscape overview
- Analysis of price sensitivity, lifecycle, customer purchase basket, adoption rates, and purchase criteria
9 Geographic Landscape
- 9.1 Geographic segmentation
- Chart on Market share By Geographical Landscape 2023-2028 (%)
- Data Table on Market share By Geographical Landscape 2023-2028 (%)
- 9.2 Geographic comparison
- Chart on Geographic comparison
- Data Table on Geographic comparison
- 9.3 APAC - Market size and forecast 2023-2028
- Chart on APAC - Market size and forecast 2023-2028 ($ million)
- Data Table on APAC - Market size and forecast 2023-2028 ($ million)
- Chart on APAC - Year-over-year growth 2023-2028 (%)
- Data Table on APAC - Year-over-year growth 2023-2028 (%)
- 9.4 North America - Market size and forecast 2023-2028
- Chart on North America - Market size and forecast 2023-2028 ($ million)
- Data Table on North America - Market size and forecast 2023-2028 ($ million)
- Chart on North America - Year-over-year growth 2023-2028 (%)
- Data Table on North America - Year-over-year growth 2023-2028 (%)
- 9.5 Europe - Market size and forecast 2023-2028
- Chart on Europe - Market size and forecast 2023-2028 ($ million)
- Data Table on Europe - Market size and forecast 2023-2028 ($ million)
- Chart on Europe - Year-over-year growth 2023-2028 (%)
- Data Table on Europe - Year-over-year growth 2023-2028 (%)
- 9.6 Middle East and Africa - Market size and forecast 2023-2028
- Chart on Middle East and Africa - Market size and forecast 2023-2028 ($ million)
- Data Table on Middle East and Africa - Market size and forecast 2023-2028 ($ million)
- Chart on Middle East and Africa - Year-over-year growth 2023-2028 (%)
- Data Table on Middle East and Africa - Year-over-year growth 2023-2028 (%)
- 9.7 South America - Market size and forecast 2023-2028
- Chart on South America - Market size and forecast 2023-2028 ($ million)
- Data Table on South America - Market size and forecast 2023-2028 ($ million)
- Chart on South America - Year-over-year growth 2023-2028 (%)
- Data Table on South America - Year-over-year growth 2023-2028 (%)
- 9.8 US - Market size and forecast 2023-2028
- Chart on US - Market size and forecast 2023-2028 ($ million)
- Data Table on US - Market size and forecast 2023-2028 ($ million)
- Chart on US - Year-over-year growth 2023-2028 (%)
- Data Table on US - Year-over-year growth 2023-2028 (%)
- 9.9 China - Market size and forecast 2023-2028
- Chart on China - Market size and forecast 2023-2028 ($ million)
- Data Table on China - Market size and forecast 2023-2028 ($ million)
- Chart on China - Year-over-year growth 2023-2028 (%)
- Data Table on China - Year-over-year growth 2023-2028 (%)
- 9.10 UK - Market size and forecast 2023-2028
- Chart on UK - Market size and forecast 2023-2028 ($ million)
- Data Table on UK - Market size and forecast 2023-2028 ($ million)
- Chart on UK - Year-over-year growth 2023-2028 (%)
- Data Table on UK - Year-over-year growth 2023-2028 (%)
- 9.11 Japan - Market size and forecast 2023-2028
- Chart on Japan - Market size and forecast 2023-2028 ($ million)
- Data Table on Japan - Market size and forecast 2023-2028 ($ million)
- Chart on Japan - Year-over-year growth 2023-2028 (%)
- Data Table on Japan - Year-over-year growth 2023-2028 (%)
- 9.12 Germany - Market size and forecast 2023-2028
- Chart on Germany - Market size and forecast 2023-2028 ($ million)
- Data Table on Germany - Market size and forecast 2023-2028 ($ million)
- Chart on Germany - Year-over-year growth 2023-2028 (%)
- Data Table on Germany - Year-over-year growth 2023-2028 (%)
- 9.13 Market opportunity By Geographical Landscape
- Market opportunity By Geographical Landscape ($ million)
- Data Tables on Market opportunity By Geographical Landscape ($ million)
10 Drivers, Challenges, and Opportunity/Restraints
- 10.1 Market drivers
- 10.2 Market challenges
- 10.3 Impact of drivers and challenges
- Impact of drivers and challenges in 2023 and 2028
- 10.4 Market opportunities/restraints
11 Competitive Landscape
- 11.1 Overview
- 11.2 Competitive Landscape
- Overview on criticality of inputs and factors of differentiation
- 11.3 Landscape disruption
- Overview on factors of disruption
- 11.4 Industry risks
- Impact of key risks on business
12 Competitive Analysis
- 12.1 Companies profiled
- Companies covered
- 12.2 Market positioning of companies
- Matrix on companies position and classification
- 12.3 Adidas AG
- Adidas AG - Overview
- Adidas AG - Business segments
- Adidas AG - Key news
- Adidas AG - Key offerings
- Adidas AG - Segment focus
- 12.4 American Eagle Outfitters Inc
- American Eagle Outfitters Inc - Overview
- American Eagle Outfitters Inc - Business segments
- American Eagle Outfitters Inc - Key offerings
- American Eagle Outfitters Inc - Segment focus
- 12.5 Chantelle Group
- Chantelle Group - Overview
- Chantelle Group - Product / Service
- Chantelle Group - Key offerings
- 12.6 H and M Hennes and Mauritz GBC AB
- H and M Hennes and Mauritz GBC AB - Overview
- H and M Hennes and Mauritz GBC AB - Business segments
- H and M Hennes and Mauritz GBC AB - Key news
- H and M Hennes and Mauritz GBC AB - Key offerings
- H and M Hennes and Mauritz GBC AB - Segment focus
- 12.7 Hanesbrands Inc.
- Hanesbrands Inc. - Overview
- Hanesbrands Inc. - Business segments
- Hanesbrands Inc. - Key news
- Hanesbrands Inc. - Key offerings
- Hanesbrands Inc. - Segment focus
- 12.8 Jockey International Inc.
- Jockey International Inc. - Overview
- Jockey International Inc. - Product / Service
- Jockey International Inc. - Key offerings
- 12.9 La Maison Lejaby SASU
- La Maison Lejaby SASU - Overview
- La Maison Lejaby SASU - Product / Service
- La Maison Lejaby SASU - Key offerings
- 12.10 Lise Charmel
- Lise Charmel - Overview
- Lise Charmel - Product / Service
- Lise Charmel - Key offerings
- 12.11 Nike Inc.
- Nike Inc. - Overview
- Nike Inc. - Business segments
- Nike Inc. - Key news
- Nike Inc. - Key offerings
- Nike Inc. - Segment focus
- 12.12 Nubian Skin Ltd.
- Nubian Skin Ltd. - Overview
- Nubian Skin Ltd. - Product / Service
- Nubian Skin Ltd. - Key offerings
- 12.13 PVH Corp.
- PVH Corp. - Overview
- PVH Corp. - Business segments
- PVH Corp. - Key offerings
- PVH Corp. - Segment focus
- 12.14 Reliance Industries Ltd.
- Reliance Industries Ltd. - Overview
- Reliance Industries Ltd. - Business segments
- Reliance Industries Ltd. - Key news
- Reliance Industries Ltd. - Key offerings
- Reliance Industries Ltd. - Segment focus
- 12.15 Stockmann Plc
- Stockmann Plc - Overview
- Stockmann Plc - Business segments
- Stockmann Plc - Key offerings
- Stockmann Plc - Segment focus
- 12.16 Victorias Secret and Co.
- Victorias Secret and Co. - Overview
- Victorias Secret and Co. - Product / Service
- Victorias Secret and Co. - Key offerings
- 12.17 Wolf Lingerie SAS
- Wolf Lingerie SAS - Overview
- Wolf Lingerie SAS - Product / Service
- Wolf Lingerie SAS - Key offerings
13 Appendix
- 13.1 Scope of the report
- 13.2 Inclusions and exclusions checklist
- Inclusions checklist
- Exclusions checklist
- 13.3 Currency conversion rates for US$
- Currency conversion rates for US$
- 13.4 Research methodology
- Research methodology
- 13.5 Data procurement
- Information sources
- 13.6 Data validation
- Data validation
- 13.7 Validation techniques employed for market sizing
- Validation techniques employed for market sizing
- 13.8 Data synthesis
- Data synthesis
- 13.9 360 degree market analysis
- 360 degree market analysis
- 13.10 List of abbreviations
- List of abbreviations

