|
|
市場調査レポート
商品コード
1727140
食品安全検査の世界市場 2025-2029Global Food Safety Testing Market 2025-2029 |
||||||

|
|||||||
カスタマイズ可能
|
|||||||


| 食品安全検査の世界市場 2025-2029 |
|
出版日: 2025年05月09日
発行: TechNavio
ページ情報: 英文 229 Pages
納期: 即納可能
|

全表示
- 概要
- 図表
- 目次
食品安全検査市場は2024-2029年に153億8,480万米ドル、予測期間中のCAGRは9%で成長すると予測されます。
当レポートでは、食品安全検査市場の全体的な分析、市場規模・予測、動向、成長促進要因、課題、約25のベンダーを網羅したベンダー分析などを掲載しています。
現在の市場シナリオ、最新動向と促進要因、市場環境全体に関する最新分析を提供しています。市場を牽引しているのは、政府機関の関与の増加、食品安全基準の重要性の高まり、飲食品業界における分析機器需要の高まりなどです。
| 市場範囲 | |
|---|---|
| 基準年 | 2025 |
| 終了年 | 2029 |
| 予測期間 | 2025-2029 |
| 成長モメンタム | 加速 |
| 前年比 | 8% |
| CAGR | 9% |
| 増分額 | 153億8,480万米ドル |
本調査は、業界の主要参加者からのインプットを含め、一次情報と二次情報を客観的に組み合わせて実施しました。レポートには、主要企業の分析に加え、包括的な市場規模データ、地域別分析によるセグメント、ベンダー情勢が含まれています。レポートには過去データと予測データがあります。
本調査では、食品安全検査の自動化のための高度なロボット工学の採用が、今後数年間の食品安全検査市場の成長を促進する主要な理由の1つであると特定しています。また、微生物のアプリケーションの増加、検査技術の向上と市場開拓は、市場の大きな需要につながります。
目次
第1章 エグゼクティブサマリー
- 市場概要
第2章 Technavio分析
- 価格・ライフサイクル・顧客購入バスケット・採用率・購入基準の分析
- インプットの重要性と差別化の要因
- 混乱の要因
- 促進要因と課題の影響
第3章 市場情勢
- 市場エコシステム
- 市場の特徴
- バリューチェーン分析
第4章 市場規模
- 市場の定義
- 市場セグメント分析
- 市場規模 2024
- 市場の見通し 2024-2029
第5章 市場規模実績
- 食品安全検査の世界市場 2019-2023
- タイプセグメント分析 2019-2023
- 技術セグメント分析 2019-2023
- 製品タイプセグメント分析 2019-2023
- 地域別セグメント分析 2019-2023
- 国別セグメント分析 2019-2023
第6章 定性分析
- AIの影響:食品安全検査の世界市場
第7章 ファイブフォース分析
- ファイブフォースの要約
- 買い手の交渉力
- 供給企業の交渉力
- 新規参入業者の脅威
- 代替品の脅威
- 競争の脅威
- 市況
第8章 市場セグメンテーション:タイプ別
- 市場セグメント
- 比較:タイプ別
- 肉類と鶏肉:市場規模と予測 2024-2029
- 果物と野菜:市場規模と予測 2024-2029
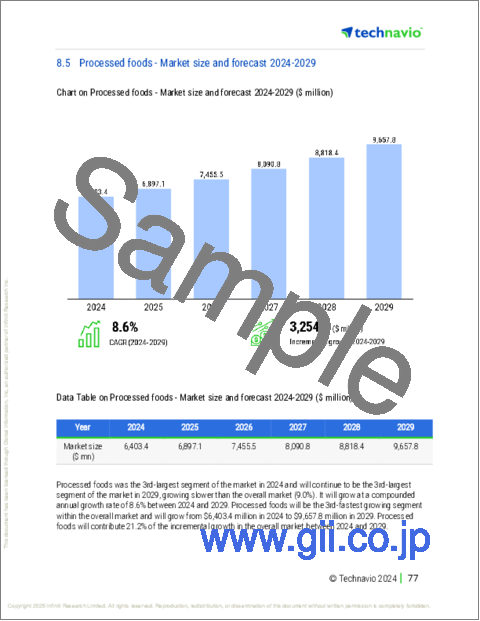
- 加工食品:市場規模と予測 2024-2029
- 乳製品:市場規模と予測 2024-2029
- その他:市場規模と予測 2024-2029
- 市場機会:タイプ別
第9章 市場セグメンテーション:技術別
- 市場セグメント
- 比較:技術別
- 急速な:市場規模と予測 2024-2029
- 伝統的:市場規模と予測 2024-2029
- 市場機会:技術別
第10章 市場セグメンテーション:製品タイプ別
- 市場セグメント
- 比較:製品タイプ別
- 病原体:市場規模と予測 2024-2029
- 遺伝子組み換え生物:市場規模と予測 2024-2029
- アレルゲン:市場規模と予測 2024-2029
- 化学物質と農薬:市場規模と予測 2024-2029
- その他:市場規模と予測 2024-2029
- 市場機会:製品タイプ別
第11章 顧客情勢
- 顧客情勢の概要
第12章 地域別情勢
- 地域別セグメンテーション
- 地域別比較
- 北米:市場規模と予測 2024-2029
- 欧州:市場規模と予測 2024-2029
- アジア:市場規模と予測 2024-2029
- 世界のその他の地域:市場規模と予測 2024-2029
- 米国:市場規模と予測 2024-2029
- ドイツ:市場規模と予測 2024-2029
- 中国:市場規模と予測 2024-2029
- 英国:市場規模と予測 2024-2029
- カナダ:市場規模と予測 2024-2029
- 日本:市場規模と予測 2024-2029
- フランス:市場規模と予測 2024-2029
- ブラジル:市場規模と予測 2024-2029
- インド:市場規模と予測 2024-2029
- アラブ首長国連邦:市場規模と予測 2024-2029
- 市場機会:地域情勢別
第13章 促進要因・課題・機会・抑制要因
- 市場促進要因
- 市場の課題
- 促進要因と課題の影響
- 市場の機会・抑制要因
第14章 競合情勢
- 概要
- 競合情勢
- 混乱の状況
- 業界のリスク
第15章 競合分析
- 企業プロファイル
- 企業ランキング指数
- 企業の市場ポジショニング
- ADPEN Laboratories Inc.
- Agilent Technologies Inc.
- ALS Ltd.
- AsureQuality Ltd.
- BioMerieux SA
- Bureau Veritas SA
- Element Materials Technology
- FoodChain ID Group Inc.
- Intertek Group Plc
- Merieux NutriSciences Corp.
- Microbac Laboratories Inc.
- Neogen Corp.
- RJ Hill Laboratories Ltd.
- Thermo Fisher Scientific Inc.
- TUV SUD AG
第16章 付録
Exhibits:
- Exhibits1: Executive Summary - Chart on Market Overview
- Exhibits2: Executive Summary - Data Table on Market Overview
- Exhibits3: Executive Summary - Chart on Global Market Characteristics
- Exhibits4: Executive Summary - Chart on Market By Geographical Landscape
- Exhibits5: Executive Summary - Chart on Market Segmentation by Type
- Exhibits6: Executive Summary - Chart on Market Segmentation by Technology
- Exhibits7: Executive Summary - Chart on Market Segmentation by Product Type
- Exhibits8: Executive Summary - Chart on Incremental Growth
- Exhibits9: Executive Summary - Data Table on Incremental Growth
- Exhibits10: Executive Summary - Chart on Company Market Positioning
- Exhibits11: Analysis of price sensitivity, lifecycle, customer purchase basket, adoption rates, and purchase criteria
- Exhibits12: Overview on criticality of inputs and factors of differentiation
- Exhibits13: Overview on factors of disruption
- Exhibits14: Impact of drivers and challenges in 2024 and 2029
- Exhibits15: Parent Market
- Exhibits16: Data Table on - Parent Market
- Exhibits17: Market characteristics analysis
- Exhibits18: Value chain analysis
- Exhibits19: Offerings of companies included in the market definition
- Exhibits20: Market segments
- Exhibits21: Chart on Global - Market size and forecast 2024-2029 ($ million)
- Exhibits22: Data Table on Global - Market size and forecast 2024-2029 ($ million)
- Exhibits23: Chart on Global Market: Year-over-year growth 2024-2029 (%)
- Exhibits24: Data Table on Global Market: Year-over-year growth 2024-2029 (%)
- Exhibits25: Historic Market Size - Data Table on Global Food Safety Testing Market 2019 - 2023 ($ million)
- Exhibits26: Historic Market Size - Type Segment 2019 - 2023 ($ million)
- Exhibits27: Historic Market Size - Technology Segment 2019 - 2023 ($ million)
- Exhibits28: Historic Market Size - Product Type Segment 2019 - 2023 ($ million)
- Exhibits29: Historic Market Size - Geography Segment 2019 - 2023 ($ million)
- Exhibits30: Historic Market Size - Country Segment 2019 - 2023 ($ million)
- Exhibits31: Five forces analysis - Comparison between 2024 and 2029
- Exhibits32: Bargaining power of buyers - Impact of key factors 2024 and 2029
- Exhibits33: Bargaining power of suppliers - Impact of key factors in 2024 and 2029
- Exhibits34: Threat of new entrants - Impact of key factors in 2024 and 2029
- Exhibits35: Threat of substitutes - Impact of key factors in 2024 and 2029
- Exhibits36: Threat of rivalry - Impact of key factors in 2024 and 2029
- Exhibits37: Chart on Market condition - Five forces 2024 and 2029
- Exhibits38: Chart on Type - Market share 2024-2029 (%)
- Exhibits39: Data Table on Type - Market share 2024-2029 (%)
- Exhibits40: Chart on Comparison by Type
- Exhibits41: Data Table on Comparison by Type
- Exhibits42: Chart on Meat and poultry - Market size and forecast 2024-2029 ($ million)
- Exhibits43: Data Table on Meat and poultry - Market size and forecast 2024-2029 ($ million)
- Exhibits44: Chart on Meat and poultry - Year-over-year growth 2024-2029 (%)
- Exhibits45: Data Table on Meat and poultry - Year-over-year growth 2024-2029 (%)
- Exhibits46: Chart on Fruits and vegetables - Market size and forecast 2024-2029 ($ million)
- Exhibits47: Data Table on Fruits and vegetables - Market size and forecast 2024-2029 ($ million)
- Exhibits48: Chart on Fruits and vegetables - Year-over-year growth 2024-2029 (%)
- Exhibits49: Data Table on Fruits and vegetables - Year-over-year growth 2024-2029 (%)
- Exhibits50: Chart on Processed foods - Market size and forecast 2024-2029 ($ million)
- Exhibits51: Data Table on Processed foods - Market size and forecast 2024-2029 ($ million)
- Exhibits52: Chart on Processed foods - Year-over-year growth 2024-2029 (%)
- Exhibits53: Data Table on Processed foods - Year-over-year growth 2024-2029 (%)
- Exhibits54: Chart on Dairy - Market size and forecast 2024-2029 ($ million)
- Exhibits55: Data Table on Dairy - Market size and forecast 2024-2029 ($ million)
- Exhibits56: Chart on Dairy - Year-over-year growth 2024-2029 (%)
- Exhibits57: Data Table on Dairy - Year-over-year growth 2024-2029 (%)
- Exhibits58: Chart on Others - Market size and forecast 2024-2029 ($ million)
- Exhibits59: Data Table on Others - Market size and forecast 2024-2029 ($ million)
- Exhibits60: Chart on Others - Year-over-year growth 2024-2029 (%)
- Exhibits61: Data Table on Others - Year-over-year growth 2024-2029 (%)
- Exhibits62: Market opportunity by Type ($ million)
- Exhibits63: Data Table on Market opportunity by Type ($ million)
- Exhibits64: Chart on Technology - Market share 2024-2029 (%)
- Exhibits65: Data Table on Technology - Market share 2024-2029 (%)
- Exhibits66: Chart on Comparison by Technology
- Exhibits67: Data Table on Comparison by Technology
- Exhibits68: Chart on Rapid - Market size and forecast 2024-2029 ($ million)
- Exhibits69: Data Table on Rapid - Market size and forecast 2024-2029 ($ million)
- Exhibits70: Chart on Rapid - Year-over-year growth 2024-2029 (%)
- Exhibits71: Data Table on Rapid - Year-over-year growth 2024-2029 (%)
- Exhibits72: Chart on Traditional - Market size and forecast 2024-2029 ($ million)
- Exhibits73: Data Table on Traditional - Market size and forecast 2024-2029 ($ million)
- Exhibits74: Chart on Traditional - Year-over-year growth 2024-2029 (%)
- Exhibits75: Data Table on Traditional - Year-over-year growth 2024-2029 (%)
- Exhibits76: Market opportunity by Technology ($ million)
- Exhibits77: Data Table on Market opportunity by Technology ($ million)
- Exhibits78: Chart on Product Type - Market share 2024-2029 (%)
- Exhibits79: Data Table on Product Type - Market share 2024-2029 (%)
- Exhibits80: Chart on Comparison by Product Type
- Exhibits81: Data Table on Comparison by Product Type
- Exhibits82: Chart on Pathogen - Market size and forecast 2024-2029 ($ million)
- Exhibits83: Data Table on Pathogen - Market size and forecast 2024-2029 ($ million)
- Exhibits84: Chart on Pathogen - Year-over-year growth 2024-2029 (%)
- Exhibits85: Data Table on Pathogen - Year-over-year growth 2024-2029 (%)
- Exhibits86: Chart on Genetically modified organism - Market size and forecast 2024-2029 ($ million)
- Exhibits87: Data Table on Genetically modified organism - Market size and forecast 2024-2029 ($ million)
- Exhibits88: Chart on Genetically modified organism - Year-over-year growth 2024-2029 (%)
- Exhibits89: Data Table on Genetically modified organism - Year-over-year growth 2024-2029 (%)
- Exhibits90: Chart on Allergen - Market size and forecast 2024-2029 ($ million)
- Exhibits91: Data Table on Allergen - Market size and forecast 2024-2029 ($ million)
- Exhibits92: Chart on Allergen - Year-over-year growth 2024-2029 (%)
- Exhibits93: Data Table on Allergen - Year-over-year growth 2024-2029 (%)
- Exhibits94: Chart on Chemical and pesticides - Market size and forecast 2024-2029 ($ million)
- Exhibits95: Data Table on Chemical and pesticides - Market size and forecast 2024-2029 ($ million)
- Exhibits96: Chart on Chemical and pesticides - Year-over-year growth 2024-2029 (%)
- Exhibits97: Data Table on Chemical and pesticides - Year-over-year growth 2024-2029 (%)
- Exhibits98: Chart on Others - Market size and forecast 2024-2029 ($ million)
- Exhibits99: Data Table on Others - Market size and forecast 2024-2029 ($ million)
- Exhibits100: Chart on Others - Year-over-year growth 2024-2029 (%)
- Exhibits101: Data Table on Others - Year-over-year growth 2024-2029 (%)
- Exhibits102: Market opportunity by Product Type ($ million)
- Exhibits103: Data Table on Market opportunity by Product Type ($ million)
- Exhibits104: Analysis of price sensitivity, lifecycle, customer purchase basket, adoption rates, and purchase criteria
- Exhibits105: Chart on Market share By Geographical Landscape 2024-2029 (%)
- Exhibits106: Data Table on Market share By Geographical Landscape 2024-2029 (%)
- Exhibits107: Chart on Geographic comparison
- Exhibits108: Data Table on Geographic comparison
- Exhibits109: Chart on North America - Market size and forecast 2024-2029 ($ million)
- Exhibits110: Data Table on North America - Market size and forecast 2024-2029 ($ million)
- Exhibits111: Chart on North America - Year-over-year growth 2024-2029 (%)
- Exhibits112: Data Table on North America - Year-over-year growth 2024-2029 (%)
- Exhibits113: Chart on Europe - Market size and forecast 2024-2029 ($ million)
- Exhibits114: Data Table on Europe - Market size and forecast 2024-2029 ($ million)
- Exhibits115: Chart on Europe - Year-over-year growth 2024-2029 (%)
- Exhibits116: Data Table on Europe - Year-over-year growth 2024-2029 (%)
- Exhibits117: Chart on Asia - Market size and forecast 2024-2029 ($ million)
- Exhibits118: Data Table on Asia - Market size and forecast 2024-2029 ($ million)
- Exhibits119: Chart on Asia - Year-over-year growth 2024-2029 (%)
- Exhibits120: Data Table on Asia - Year-over-year growth 2024-2029 (%)
- Exhibits121: Chart on Rest of World (ROW) - Market size and forecast 2024-2029 ($ million)
- Exhibits122: Data Table on Rest of World (ROW) - Market size and forecast 2024-2029 ($ million)
- Exhibits123: Chart on Rest of World (ROW) - Year-over-year growth 2024-2029 (%)
- Exhibits124: Data Table on Rest of World (ROW) - Year-over-year growth 2024-2029 (%)
- Exhibits125: Chart on US - Market size and forecast 2024-2029 ($ million)
- Exhibits126: Data Table on US - Market size and forecast 2024-2029 ($ million)
- Exhibits127: Chart on US - Year-over-year growth 2024-2029 (%)
- Exhibits128: Data Table on US - Year-over-year growth 2024-2029 (%)
- Exhibits129: Chart on Germany - Market size and forecast 2024-2029 ($ million)
- Exhibits130: Data Table on Germany - Market size and forecast 2024-2029 ($ million)
- Exhibits131: Chart on Germany - Year-over-year growth 2024-2029 (%)
- Exhibits132: Data Table on Germany - Year-over-year growth 2024-2029 (%)
- Exhibits133: Chart on China - Market size and forecast 2024-2029 ($ million)
- Exhibits134: Data Table on China - Market size and forecast 2024-2029 ($ million)
- Exhibits135: Chart on China - Year-over-year growth 2024-2029 (%)
- Exhibits136: Data Table on China - Year-over-year growth 2024-2029 (%)
- Exhibits137: Chart on UK - Market size and forecast 2024-2029 ($ million)
- Exhibits138: Data Table on UK - Market size and forecast 2024-2029 ($ million)
- Exhibits139: Chart on UK - Year-over-year growth 2024-2029 (%)
- Exhibits140: Data Table on UK - Year-over-year growth 2024-2029 (%)
- Exhibits141: Chart on Canada - Market size and forecast 2024-2029 ($ million)
- Exhibits142: Data Table on Canada - Market size and forecast 2024-2029 ($ million)
- Exhibits143: Chart on Canada - Year-over-year growth 2024-2029 (%)
- Exhibits144: Data Table on Canada - Year-over-year growth 2024-2029 (%)
- Exhibits145: Chart on Japan - Market size and forecast 2024-2029 ($ million)
- Exhibits146: Data Table on Japan - Market size and forecast 2024-2029 ($ million)
- Exhibits147: Chart on Japan - Year-over-year growth 2024-2029 (%)
- Exhibits148: Data Table on Japan - Year-over-year growth 2024-2029 (%)
- Exhibits149: Chart on France - Market size and forecast 2024-2029 ($ million)
- Exhibits150: Data Table on France - Market size and forecast 2024-2029 ($ million)
- Exhibits151: Chart on France - Year-over-year growth 2024-2029 (%)
- Exhibits152: Data Table on France - Year-over-year growth 2024-2029 (%)
- Exhibits153: Chart on Brazil - Market size and forecast 2024-2029 ($ million)
- Exhibits154: Data Table on Brazil - Market size and forecast 2024-2029 ($ million)
- Exhibits155: Chart on Brazil - Year-over-year growth 2024-2029 (%)
- Exhibits156: Data Table on Brazil - Year-over-year growth 2024-2029 (%)
- Exhibits157: Chart on India - Market size and forecast 2024-2029 ($ million)
- Exhibits158: Data Table on India - Market size and forecast 2024-2029 ($ million)
- Exhibits159: Chart on India - Year-over-year growth 2024-2029 (%)
- Exhibits160: Data Table on India - Year-over-year growth 2024-2029 (%)
- Exhibits161: Chart on UAE - Market size and forecast 2024-2029 ($ million)
- Exhibits162: Data Table on UAE - Market size and forecast 2024-2029 ($ million)
- Exhibits163: Chart on UAE - Year-over-year growth 2024-2029 (%)
- Exhibits164: Data Table on UAE - Year-over-year growth 2024-2029 (%)
- Exhibits165: Market opportunity By Geographical Landscape ($ million)
- Exhibits166: Data Tables on Market opportunity By Geographical Landscape ($ million)
- Exhibits167: Impact of drivers and challenges in 2024 and 2029
- Exhibits168: Overview on criticality of inputs and factors of differentiation
- Exhibits169: Overview on factors of disruption
- Exhibits170: Impact of key risks on business
- Exhibits171: Companies covered
- Exhibits172: Company ranking index
- Exhibits173: Matrix on companies position and classification
- Exhibits174: ADPEN Laboratories Inc. - Overview
- Exhibits175: ADPEN Laboratories Inc. - Product / Service
- Exhibits176: ADPEN Laboratories Inc. - Key offerings
- Exhibits177: SWOT
- Exhibits178: Agilent Technologies Inc. - Overview
- Exhibits179: Agilent Technologies Inc. - Business segments
- Exhibits180: Agilent Technologies Inc. - Key news
- Exhibits181: Agilent Technologies Inc. - Key offerings
- Exhibits182: Agilent Technologies Inc. - Segment focus
- Exhibits183: SWOT
- Exhibits184: ALS Ltd. - Overview
- Exhibits185: ALS Ltd. - Business segments
- Exhibits186: ALS Ltd. - Key news
- Exhibits187: ALS Ltd. - Key offerings
- Exhibits188: ALS Ltd. - Segment focus
- Exhibits189: SWOT
- Exhibits190: AsureQuality Ltd. - Overview
- Exhibits191: AsureQuality Ltd. - Product / Service
- Exhibits192: AsureQuality Ltd. - Key offerings
- Exhibits193: SWOT
- Exhibits194: BioMerieux SA - Overview
- Exhibits195: BioMerieux SA - Business segments
- Exhibits196: BioMerieux SA - Key news
- Exhibits197: BioMerieux SA - Key offerings
- Exhibits198: BioMerieux SA - Segment focus
- Exhibits199: SWOT
- Exhibits200: Bureau Veritas SA - Overview
- Exhibits201: Bureau Veritas SA - Business segments
- Exhibits202: Bureau Veritas SA - Key offerings
- Exhibits203: Bureau Veritas SA - Segment focus
- Exhibits204: SWOT
- Exhibits205: Element Materials Technology - Overview
- Exhibits206: Element Materials Technology - Product / Service
- Exhibits207: Element Materials Technology - Key offerings
- Exhibits208: SWOT
- Exhibits209: FoodChain ID Group Inc. - Overview
- Exhibits210: FoodChain ID Group Inc. - Product / Service
- Exhibits211: FoodChain ID Group Inc. - Key offerings
- Exhibits212: SWOT
- Exhibits213: Intertek Group Plc - Overview
- Exhibits214: Intertek Group Plc - Business segments
- Exhibits215: Intertek Group Plc - Key offerings
- Exhibits216: Intertek Group Plc - Segment focus
- Exhibits217: SWOT
- Exhibits218: Merieux NutriSciences Corp. - Overview
- Exhibits219: Merieux NutriSciences Corp. - Product / Service
- Exhibits220: Merieux NutriSciences Corp. - Key offerings
- Exhibits221: SWOT
- Exhibits222: Microbac Laboratories Inc. - Overview
- Exhibits223: Microbac Laboratories Inc. - Product / Service
- Exhibits224: Microbac Laboratories Inc. - Key offerings
- Exhibits225: SWOT
- Exhibits226: Neogen Corp. - Overview
- Exhibits227: Neogen Corp. - Business segments
- Exhibits228: Neogen Corp. - Key offerings
- Exhibits229: Neogen Corp. - Segment focus
- Exhibits230: SWOT
- Exhibits231: RJ Hill Laboratories Ltd. - Overview
- Exhibits232: RJ Hill Laboratories Ltd. - Product / Service
- Exhibits233: RJ Hill Laboratories Ltd. - Key offerings
- Exhibits234: SWOT
- Exhibits235: Thermo Fisher Scientific Inc. - Overview
- Exhibits236: Thermo Fisher Scientific Inc. - Business segments
- Exhibits237: Thermo Fisher Scientific Inc. - Key news
- Exhibits238: Thermo Fisher Scientific Inc. - Key offerings
- Exhibits239: Thermo Fisher Scientific Inc. - Segment focus
- Exhibits240: SWOT
- Exhibits241: TUV SUD AG - Overview
- Exhibits242: TUV SUD AG - Product / Service
- Exhibits243: TUV SUD AG - Key offerings
- Exhibits244: SWOT
- Exhibits245: Inclusions checklist
- Exhibits246: Exclusions checklist
- Exhibits247: Currency conversion rates for US$
- Exhibits248: Research methodology
- Exhibits249: Information sources
- Exhibits250: Data validation
- Exhibits251: Validation techniques employed for market sizing
- Exhibits252: Data synthesis
- Exhibits253: 360 degree market analysis
- Exhibits254: List of abbreviations
The food safety testing market is forecasted to grow by USD 15,384.8 mn during 2024-2029, accelerating at a CAGR of 9% during the forecast period. The report on the food safety testing market provides a holistic analysis, market size and forecast, trends, growth drivers, and challenges, as well as vendor analysis covering around 25 vendors.
The report offers an up-to-date analysis regarding the current market scenario, the latest trends and drivers, and the overall market environment. The market is driven by increase in involvement of government agencies, growing importance of food safety standards, and rising demand for analytical instruments in food and beverage industries.
| Market Scope | |
|---|---|
| Base Year | 2025 |
| End Year | 2029 |
| Series Year | 2025-2029 |
| Growth Momentum | Accelerate |
| YOY 2025 | 8% |
| CAGR | 9% |
| Incremental Value | $15,384.8 mn |
The study was conducted using an objective combination of primary and secondary information including inputs from key participants in the industry. The report contains a comprehensive market size data, segment with regional analysis and vendor landscape in addition to an analysis of the key companies. Reports have historic and forecast data.
Technavio's food safety testing market is segmented as below:
By Type
- Meat and poultry
- Fruits and vegetables
- Processed foods
- Dairy
- Others
By Technology
- Rapid
- Traditional
By Product Type
- Pathogen
- Genetically modified organism
- Allergen
- Chemical and pesticides
- Others
By Geographical Landscape
- North America
- Europe
- Asia
- Rest of World (ROW)
This study identifies the adoption of advanced robotics for automation of food safety testing as one of the prime reasons driving the food safety testing market growth during the next few years. Also, increasing applications of microorganisms and rising improvisation and development of testing technology will lead to sizable demand in the market.
The report on the food safety testing market covers the following areas:
- Food Safety Testing Market sizing
- Food Safety Testing Market forecast
- Food Safety Testing Market industry analysis
The robust vendor analysis is designed to help clients improve their market position, and in line with this, this report provides a detailed analysis of several leading food safety testing market vendors that include ADPEN Laboratories Inc., Agilent Technologies Inc., ALS Ltd., AsureQuality Ltd., Bio Rad Laboratories Inc., BioMerieux SA, Bureau Veritas SA, Campden BRI, Element Materials Technology, EMSL Analytical Inc., Eurofins Scientific SE, FoodChain ID Group Inc., Intertek Group Plc, Merieux NutriSciences Corp., Microbac Laboratories Inc., Neogen Corp., RJ Hill Laboratories Ltd., Romer Labs Division Holding GmbH, Thermo Fisher Scientific Inc., and TUV SUD AG. Also, the food safety testing market analysis report includes information on upcoming trends and challenges that will influence market growth. This is to help companies strategize and leverage all forthcoming growth opportunities.
The publisher presents a detailed picture of the market by the way of study, synthesis, and summation of data from multiple sources by an analysis of key parameters such as profit, pricing, competition, and promotions. It presents various market facets by identifying the key industry influencers. The data presented is comprehensive, reliable, and a result of extensive primary and secondary research. The market research reports provide a complete competitive landscape and an in-depth vendor selection methodology and analysis using qualitative and quantitative research to forecast accurate market growth.
Table of Contents
1 Executive Summary
- 1.1 Market overview
- Executive Summary - Chart on Market Overview
- Executive Summary - Data Table on Market Overview
- Executive Summary - Chart on Global Market Characteristics
- Executive Summary - Chart on Market By Geographical Landscape
- Executive Summary - Chart on Market Segmentation by Type
- Executive Summary - Chart on Market Segmentation by Technology
- Executive Summary - Chart on Market Segmentation by Product Type
- Executive Summary - Chart on Incremental Growth
- Executive Summary - Data Table on Incremental Growth
- Executive Summary - Chart on Company Market Positioning
2 Technavio Analysis
- 2.1 Analysis of price sensitivity, lifecycle, customer purchase basket, adoption rates, and purchase criteria
- Analysis of price sensitivity, lifecycle, customer purchase basket, adoption rates, and purchase criteria
- 2.2 Criticality of inputs and Factors of differentiation
- Overview on criticality of inputs and factors of differentiation
- 2.3 Factors of disruption
- Overview on factors of disruption
- 2.4 Impact of drivers and challenges
- Impact of drivers and challenges in 2024 and 2029
3 Market Landscape
- 3.1 Market ecosystem
- Parent Market
- Data Table on - Parent Market
- 3.2 Market characteristics
- Market characteristics analysis
- 3.3 Value chain analysis
- Value chain analysis
4 Market Sizing
- 4.1 Market definition
- Offerings of companies included in the market definition
- 4.2 Market segment analysis
- Market segments
- 4.3 Market size 2024
- 4.4 Market outlook: Forecast for 2024-2029
- Chart on Global - Market size and forecast 2024-2029 ($ million)
- Data Table on Global - Market size and forecast 2024-2029 ($ million)
- Chart on Global Market: Year-over-year growth 2024-2029 (%)
- Data Table on Global Market: Year-over-year growth 2024-2029 (%)
5 Historic Market Size
- 5.1 Global Food Safety Testing Market 2019 - 2023
- Historic Market Size - Data Table on Global Food Safety Testing Market 2019 - 2023 ($ million)
- 5.2 Type segment analysis 2019 - 2023
- Historic Market Size - Type Segment 2019 - 2023 ($ million)
- 5.3 Technology segment analysis 2019 - 2023
- Historic Market Size - Technology Segment 2019 - 2023 ($ million)
- 5.4 Product Type segment analysis 2019 - 2023
- Historic Market Size - Product Type Segment 2019 - 2023 ($ million)
- 5.5 Geography segment analysis 2019 - 2023
- Historic Market Size - Geography Segment 2019 - 2023 ($ million)
- 5.6 Country segment analysis 2019 - 2023
- Historic Market Size - Country Segment 2019 - 2023 ($ million)
6 Qualitative Analysis
- 6.1 Impact of AI on Global Food Safety Testing Market
7 Five Forces Analysis
- 7.1 Five forces summary
- Five forces analysis - Comparison between 2024 and 2029
- 7.2 Bargaining power of buyers
- Bargaining power of buyers - Impact of key factors 2024 and 2029
- 7.3 Bargaining power of suppliers
- Bargaining power of suppliers - Impact of key factors in 2024 and 2029
- 7.4 Threat of new entrants
- Threat of new entrants - Impact of key factors in 2024 and 2029
- 7.5 Threat of substitutes
- Threat of substitutes - Impact of key factors in 2024 and 2029
- 7.6 Threat of rivalry
- Threat of rivalry - Impact of key factors in 2024 and 2029
- 7.7 Market condition
- Chart on Market condition - Five forces 2024 and 2029
8 Market Segmentation by Type
- 8.1 Market segments
- Chart on Type - Market share 2024-2029 (%)
- Data Table on Type - Market share 2024-2029 (%)
- 8.2 Comparison by Type
- Chart on Comparison by Type
- Data Table on Comparison by Type
- 8.3 Meat and poultry - Market size and forecast 2024-2029
- Chart on Meat and poultry - Market size and forecast 2024-2029 ($ million)
- Data Table on Meat and poultry - Market size and forecast 2024-2029 ($ million)
- Chart on Meat and poultry - Year-over-year growth 2024-2029 (%)
- Data Table on Meat and poultry - Year-over-year growth 2024-2029 (%)
- 8.4 Fruits and vegetables - Market size and forecast 2024-2029
- Chart on Fruits and vegetables - Market size and forecast 2024-2029 ($ million)
- Data Table on Fruits and vegetables - Market size and forecast 2024-2029 ($ million)
- Chart on Fruits and vegetables - Year-over-year growth 2024-2029 (%)
- Data Table on Fruits and vegetables - Year-over-year growth 2024-2029 (%)
- 8.5 Processed foods - Market size and forecast 2024-2029
- Chart on Processed foods - Market size and forecast 2024-2029 ($ million)
- Data Table on Processed foods - Market size and forecast 2024-2029 ($ million)
- Chart on Processed foods - Year-over-year growth 2024-2029 (%)
- Data Table on Processed foods - Year-over-year growth 2024-2029 (%)
- 8.6 Dairy - Market size and forecast 2024-2029
- Chart on Dairy - Market size and forecast 2024-2029 ($ million)
- Data Table on Dairy - Market size and forecast 2024-2029 ($ million)
- Chart on Dairy - Year-over-year growth 2024-2029 (%)
- Data Table on Dairy - Year-over-year growth 2024-2029 (%)
- 8.7 Others - Market size and forecast 2024-2029
- Chart on Others - Market size and forecast 2024-2029 ($ million)
- Data Table on Others - Market size and forecast 2024-2029 ($ million)
- Chart on Others - Year-over-year growth 2024-2029 (%)
- Data Table on Others - Year-over-year growth 2024-2029 (%)
- 8.8 Market opportunity by Type
- Market opportunity by Type ($ million)
- Data Table on Market opportunity by Type ($ million)
9 Market Segmentation by Technology
- 9.1 Market segments
- Chart on Technology - Market share 2024-2029 (%)
- Data Table on Technology - Market share 2024-2029 (%)
- 9.2 Comparison by Technology
- Chart on Comparison by Technology
- Data Table on Comparison by Technology
- 9.3 Rapid - Market size and forecast 2024-2029
- Chart on Rapid - Market size and forecast 2024-2029 ($ million)
- Data Table on Rapid - Market size and forecast 2024-2029 ($ million)
- Chart on Rapid - Year-over-year growth 2024-2029 (%)
- Data Table on Rapid - Year-over-year growth 2024-2029 (%)
- 9.4 Traditional - Market size and forecast 2024-2029
- Chart on Traditional - Market size and forecast 2024-2029 ($ million)
- Data Table on Traditional - Market size and forecast 2024-2029 ($ million)
- Chart on Traditional - Year-over-year growth 2024-2029 (%)
- Data Table on Traditional - Year-over-year growth 2024-2029 (%)
- 9.5 Market opportunity by Technology
- Market opportunity by Technology ($ million)
- Data Table on Market opportunity by Technology ($ million)
10 Market Segmentation by Product Type
- 10.1 Market segments
- Chart on Product Type - Market share 2024-2029 (%)
- Data Table on Product Type - Market share 2024-2029 (%)
- 10.2 Comparison by Product Type
- Chart on Comparison by Product Type
- Data Table on Comparison by Product Type
- 10.3 Pathogen - Market size and forecast 2024-2029
- Chart on Pathogen - Market size and forecast 2024-2029 ($ million)
- Data Table on Pathogen - Market size and forecast 2024-2029 ($ million)
- Chart on Pathogen - Year-over-year growth 2024-2029 (%)
- Data Table on Pathogen - Year-over-year growth 2024-2029 (%)
- 10.4 Genetically modified organism - Market size and forecast 2024-2029
- Chart on Genetically modified organism - Market size and forecast 2024-2029 ($ million)
- Data Table on Genetically modified organism - Market size and forecast 2024-2029 ($ million)
- Chart on Genetically modified organism - Year-over-year growth 2024-2029 (%)
- Data Table on Genetically modified organism - Year-over-year growth 2024-2029 (%)
- 10.5 Allergen - Market size and forecast 2024-2029
- Chart on Allergen - Market size and forecast 2024-2029 ($ million)
- Data Table on Allergen - Market size and forecast 2024-2029 ($ million)
- Chart on Allergen - Year-over-year growth 2024-2029 (%)
- Data Table on Allergen - Year-over-year growth 2024-2029 (%)
- 10.6 Chemical and pesticides - Market size and forecast 2024-2029
- Chart on Chemical and pesticides - Market size and forecast 2024-2029 ($ million)
- Data Table on Chemical and pesticides - Market size and forecast 2024-2029 ($ million)
- Chart on Chemical and pesticides - Year-over-year growth 2024-2029 (%)
- Data Table on Chemical and pesticides - Year-over-year growth 2024-2029 (%)
- 10.7 Others - Market size and forecast 2024-2029
- Chart on Others - Market size and forecast 2024-2029 ($ million)
- Data Table on Others - Market size and forecast 2024-2029 ($ million)
- Chart on Others - Year-over-year growth 2024-2029 (%)
- Data Table on Others - Year-over-year growth 2024-2029 (%)
- 10.8 Market opportunity by Product Type
- Market opportunity by Product Type ($ million)
- Data Table on Market opportunity by Product Type ($ million)
11 Customer Landscape
- 11.1 Customer landscape overview
- Analysis of price sensitivity, lifecycle, customer purchase basket, adoption rates, and purchase criteria
12 Geographic Landscape
- 12.1 Geographic segmentation
- Chart on Market share By Geographical Landscape 2024-2029 (%)
- Data Table on Market share By Geographical Landscape 2024-2029 (%)
- 12.2 Geographic comparison
- Chart on Geographic comparison
- Data Table on Geographic comparison
- 12.3 North America - Market size and forecast 2024-2029
- Chart on North America - Market size and forecast 2024-2029 ($ million)
- Data Table on North America - Market size and forecast 2024-2029 ($ million)
- Chart on North America - Year-over-year growth 2024-2029 (%)
- Data Table on North America - Year-over-year growth 2024-2029 (%)
- 12.4 Europe - Market size and forecast 2024-2029
- Chart on Europe - Market size and forecast 2024-2029 ($ million)
- Data Table on Europe - Market size and forecast 2024-2029 ($ million)
- Chart on Europe - Year-over-year growth 2024-2029 (%)
- Data Table on Europe - Year-over-year growth 2024-2029 (%)
- 12.5 Asia - Market size and forecast 2024-2029
- Chart on Asia - Market size and forecast 2024-2029 ($ million)
- Data Table on Asia - Market size and forecast 2024-2029 ($ million)
- Chart on Asia - Year-over-year growth 2024-2029 (%)
- Data Table on Asia - Year-over-year growth 2024-2029 (%)
- 12.6 Rest of World (ROW) - Market size and forecast 2024-2029
- Chart on Rest of World (ROW) - Market size and forecast 2024-2029 ($ million)
- Data Table on Rest of World (ROW) - Market size and forecast 2024-2029 ($ million)
- Chart on Rest of World (ROW) - Year-over-year growth 2024-2029 (%)
- Data Table on Rest of World (ROW) - Year-over-year growth 2024-2029 (%)
- 12.7 US - Market size and forecast 2024-2029
- Chart on US - Market size and forecast 2024-2029 ($ million)
- Data Table on US - Market size and forecast 2024-2029 ($ million)
- Chart on US - Year-over-year growth 2024-2029 (%)
- Data Table on US - Year-over-year growth 2024-2029 (%)
- 12.8 Germany - Market size and forecast 2024-2029
- Chart on Germany - Market size and forecast 2024-2029 ($ million)
- Data Table on Germany - Market size and forecast 2024-2029 ($ million)
- Chart on Germany - Year-over-year growth 2024-2029 (%)
- Data Table on Germany - Year-over-year growth 2024-2029 (%)
- 12.9 China - Market size and forecast 2024-2029
- Chart on China - Market size and forecast 2024-2029 ($ million)
- Data Table on China - Market size and forecast 2024-2029 ($ million)
- Chart on China - Year-over-year growth 2024-2029 (%)
- Data Table on China - Year-over-year growth 2024-2029 (%)
- 12.10 UK - Market size and forecast 2024-2029
- Chart on UK - Market size and forecast 2024-2029 ($ million)
- Data Table on UK - Market size and forecast 2024-2029 ($ million)
- Chart on UK - Year-over-year growth 2024-2029 (%)
- Data Table on UK - Year-over-year growth 2024-2029 (%)
- 12.11 Canada - Market size and forecast 2024-2029
- Chart on Canada - Market size and forecast 2024-2029 ($ million)
- Data Table on Canada - Market size and forecast 2024-2029 ($ million)
- Chart on Canada - Year-over-year growth 2024-2029 (%)
- Data Table on Canada - Year-over-year growth 2024-2029 (%)
- 12.12 Japan - Market size and forecast 2024-2029
- Chart on Japan - Market size and forecast 2024-2029 ($ million)
- Data Table on Japan - Market size and forecast 2024-2029 ($ million)
- Chart on Japan - Year-over-year growth 2024-2029 (%)
- Data Table on Japan - Year-over-year growth 2024-2029 (%)
- 12.13 France - Market size and forecast 2024-2029
- Chart on France - Market size and forecast 2024-2029 ($ million)
- Data Table on France - Market size and forecast 2024-2029 ($ million)
- Chart on France - Year-over-year growth 2024-2029 (%)
- Data Table on France - Year-over-year growth 2024-2029 (%)
- 12.14 Brazil - Market size and forecast 2024-2029
- Chart on Brazil - Market size and forecast 2024-2029 ($ million)
- Data Table on Brazil - Market size and forecast 2024-2029 ($ million)
- Chart on Brazil - Year-over-year growth 2024-2029 (%)
- Data Table on Brazil - Year-over-year growth 2024-2029 (%)
- 12.15 India - Market size and forecast 2024-2029
- Chart on India - Market size and forecast 2024-2029 ($ million)
- Data Table on India - Market size and forecast 2024-2029 ($ million)
- Chart on India - Year-over-year growth 2024-2029 (%)
- Data Table on India - Year-over-year growth 2024-2029 (%)
- 12.16 UAE - Market size and forecast 2024-2029
- Chart on UAE - Market size and forecast 2024-2029 ($ million)
- Data Table on UAE - Market size and forecast 2024-2029 ($ million)
- Chart on UAE - Year-over-year growth 2024-2029 (%)
- Data Table on UAE - Year-over-year growth 2024-2029 (%)
- 12.17 Market opportunity By Geographical Landscape
- Market opportunity By Geographical Landscape ($ million)
- Data Tables on Market opportunity By Geographical Landscape ($ million)
13 Drivers, Challenges, and Opportunity/Restraints
- 13.1 Market drivers
- 13.2 Market challenges
- 13.3 Impact of drivers and challenges
- Impact of drivers and challenges in 2024 and 2029
- 13.4 Market opportunities/restraints
14 Competitive Landscape
- 14.1 Overview
- 14.2 Competitive Landscape
- Overview on criticality of inputs and factors of differentiation
- 14.3 Landscape disruption
- Overview on factors of disruption
- 14.4 Industry risks
- Impact of key risks on business
15 Competitive Analysis
- 15.1 Companies profiled
- Companies covered
- 15.2 Company ranking index
- Company ranking index
- 15.3 Market positioning of companies
- Matrix on companies position and classification
- 15.4 ADPEN Laboratories Inc.
- ADPEN Laboratories Inc. - Overview
- ADPEN Laboratories Inc. - Product / Service
- ADPEN Laboratories Inc. - Key offerings
- SWOT
- 15.5 Agilent Technologies Inc.
- Agilent Technologies Inc. - Overview
- Agilent Technologies Inc. - Business segments
- Agilent Technologies Inc. - Key news
- Agilent Technologies Inc. - Key offerings
- Agilent Technologies Inc. - Segment focus
- SWOT
- 15.6 ALS Ltd.
- ALS Ltd. - Overview
- ALS Ltd. - Business segments
- ALS Ltd. - Key news
- ALS Ltd. - Key offerings
- ALS Ltd. - Segment focus
- SWOT
- 15.7 AsureQuality Ltd.
- AsureQuality Ltd. - Overview
- AsureQuality Ltd. - Product / Service
- AsureQuality Ltd. - Key offerings
- SWOT
- 15.8 BioMerieux SA
- BioMerieux SA - Overview
- BioMerieux SA - Business segments
- BioMerieux SA - Key news
- BioMerieux SA - Key offerings
- BioMerieux SA - Segment focus
- SWOT
- 15.9 Bureau Veritas SA
- Bureau Veritas SA - Overview
- Bureau Veritas SA - Business segments
- Bureau Veritas SA - Key offerings
- Bureau Veritas SA - Segment focus
- SWOT
- 15.10 Element Materials Technology
- Element Materials Technology - Overview
- Element Materials Technology - Product / Service
- Element Materials Technology - Key offerings
- SWOT
- 15.11 FoodChain ID Group Inc.
- FoodChain ID Group Inc. - Overview
- FoodChain ID Group Inc. - Product / Service
- FoodChain ID Group Inc. - Key offerings
- SWOT
- 15.12 Intertek Group Plc
- Intertek Group Plc - Overview
- Intertek Group Plc - Business segments
- Intertek Group Plc - Key offerings
- Intertek Group Plc - Segment focus
- SWOT
- 15.13 Merieux NutriSciences Corp.
- Merieux NutriSciences Corp. - Overview
- Merieux NutriSciences Corp. - Product / Service
- Merieux NutriSciences Corp. - Key offerings
- SWOT
- 15.14 Microbac Laboratories Inc.
- Microbac Laboratories Inc. - Overview
- Microbac Laboratories Inc. - Product / Service
- Microbac Laboratories Inc. - Key offerings
- SWOT
- 15.15 Neogen Corp.
- Neogen Corp. - Overview
- Neogen Corp. - Business segments
- Neogen Corp. - Key offerings
- Neogen Corp. - Segment focus
- SWOT
- 15.16 RJ Hill Laboratories Ltd.
- RJ Hill Laboratories Ltd. - Overview
- RJ Hill Laboratories Ltd. - Product / Service
- RJ Hill Laboratories Ltd. - Key offerings
- SWOT
- 15.17 Thermo Fisher Scientific Inc.
- Thermo Fisher Scientific Inc. - Overview
- Thermo Fisher Scientific Inc. - Business segments
- Thermo Fisher Scientific Inc. - Key news
- Thermo Fisher Scientific Inc. - Key offerings
- Thermo Fisher Scientific Inc. - Segment focus
- SWOT
- 15.18 TUV SUD AG
- TUV SUD AG - Overview
- TUV SUD AG - Product / Service
- TUV SUD AG - Key offerings
- SWOT
16 Appendix
- 16.1 Scope of the report
- 16.2 Inclusions and exclusions checklist
- Inclusions checklist
- Exclusions checklist
- 16.3 Currency conversion rates for US$
- Currency conversion rates for US$
- 16.4 Research methodology
- Research methodology
- 16.5 Data procurement
- Information sources
- 16.6 Data validation
- Data validation
- 16.7 Validation techniques employed for market sizing
- Validation techniques employed for market sizing
- 16.8 Data synthesis
- Data synthesis
- 16.9 360 degree market analysis
- 360 degree market analysis
- 16.10 List of abbreviations
- List of abbreviations
