
|
市場調査レポート
商品コード
1755309
食品安全モニタリングシステムの市場機会、成長促進要因、産業動向分析、2025年~2034年予測Food Safety Monitoring Systems Market Opportunity, Growth Drivers, Industry Trend Analysis, and Forecast 2025 - 2034 |
||||||
カスタマイズ可能
|
|||||||
| 食品安全モニタリングシステムの市場機会、成長促進要因、産業動向分析、2025年~2034年予測 |
|
出版日: 2025年05月23日
発行: Global Market Insights Inc.
ページ情報: 英文 135 Pages
納期: 2~3営業日
|

全表示
- 概要
- 目次
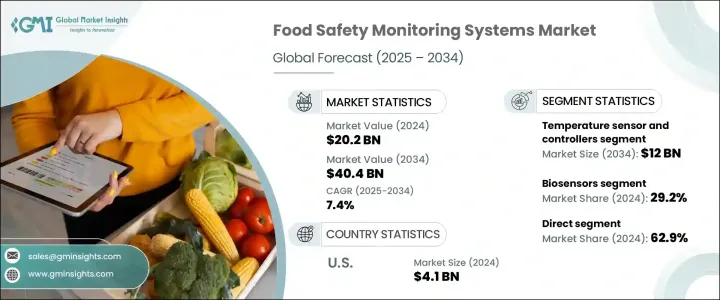
食品安全モニタリングシステムの世界市場は、2024年には202億米ドルと評価され、CAGR 7.4%で成長し、2034年には404億米ドルに達すると推定されています。
国際的な食品取引が相互関係を深めるにつれて、一貫した安全性と品質の維持はますます大きな関心事となっています。食品は消費者に届くまでに複数の国を通過することが多いため、インテリジェントモニタリングシステムの需要が急増しています。これらのシステムは、自動化されたデータ収集、リアルタイムの監視、予測分析などの機能を提供し、ソースから棚に並ぶまでのエンドツーエンドの安全性を確保します。
国際的な食品法や規制の枠組みへの準拠は今や最優先事項であり、企業はEU一般食品法や米国の食品安全近代化法などの要件をサポートするソリューションの採用を促しています。これらのシステムは、規制基準を満たすだけでなく、ブランドの完全性を保護し、製品回収やコンプライアンス違反による金銭的な損失を軽減する上で重要な役割を果たしています。
| 市場範囲 | |
|---|---|
| 開始年 | 2024 |
| 予測年 | 2025-2034 |
| 開始金額 | 202億米ドル |
| 予測金額 | 404億米ドル |
| CAGR | 7.4% |
2024年、温度センサーとコントローラー分野は68億米ドルを生み出し、2034年には120億米ドルにまで上昇すると予測されています。これらのツールは、微生物リスクを最小限に抑え、サプライチェーンの様々なポイントにわたって生鮮品の品質を維持するのに役立つため、食品安全モニタリングに不可欠です。その用途は、加工、輸送、冷蔵保管、小売業務に及ぶ。大規模な製造施設であろうと小規模な施設であろうと、これらのシステムは信頼性が高く、スケーラブルで、さまざまな業務ニーズに適合する統合ソリューションを提供します。
直接流通チャネルは、2024年には62.9%という大きなシェアを獲得し、2025年から2034年までのCAGRは7.3%で成長するとみられています。直接販売チャネルは、食品安全モニタリングシステムのプロバイダーがエンドユーザーと密接に関わり、カスタマイズされた技術、迅速なサポート、延長サービス契約を提供する機会を創出することを可能にします。このような直接的な関係は、システムベンダーが製造業や加工業の顧客との長期的なパートナーシップを構築する上で、ユニークな業務上の要求に応えるのに役立っています。
米国の食品安全モニタリングシステム2024年の市場規模は41億米ドルで、2034年までCAGR 7%で成長すると予測されています。同国は、その強固な規制環境と先進的な食品生産状況により、世界のリーダーであり続けています。食品安全を担当する機関は、トレーサビリティとコンプライアンスに対する業界の取り組みを保証する規制を厳格に実施しています。食品の品質と安全性に関する消費者の期待の高さ、頻繁な規制監査、IoT対応センサーやAIを活用した分析などの最先端技術の広範な採用は、この地域における市場の力強い成長の主な要因です。
食品安全モニタリングシステム市場をリードする主要企業には、Honeywell International Inc.、Shimadzu Corporation、Bio-Rad Laboratories, Inc.、ABB Ltd.、Rockwell Automation, Inc.、Mettler-Toledo International Inc.、3M Company、General Electric(GE)、Siemens AG、Thermo Fisher Scientific Inc.、横河電機株式会社、Endress+Hauser Group、Danaher Corporation、Emerson Electric Co.、Agilent Technologies, Inc.などがあります。食品安全モニタリングシステム分野の企業は、市場での存在感を確固たるものにするため、いくつかの戦略的イニシアチブを展開しています。その多くは、システムの精度、統合、自動化を強化するための研究開発に多額の投資を行っています。また、サプライチェーンのさまざまな段階にわたってシームレスなモニタリングを提供するため、ソフトウェアとハードウェアの相互運用性に注力している企業もあります。食品生産者や加工業者との戦略的パートナーシップは採用の拡大に役立ち、地域的な拡大努力は新興国市場での需要の増大に対応することを目的としています。
目次
第1章 調査手法と範囲
第2章 エグゼクティブサマリー
第3章 業界考察
- エコシステム分析
- バリューチェーンに影響を与える要因
- 利益率分析
- ディスラプション
- 将来の展望
- 製造業者
- 販売代理店
- 小売業者
- トランプ政権の関税分析
- 貿易への影響
- 貿易量の混乱
- 報復措置
- 業界への影響
- 供給側の影響(原材料)
- 主要原材料の価格変動
- サプライチェーンの再構築
- 生産コストへの影響
- 需要側の影響(販売価格)
- 最終市場への価格伝達
- 市場シェアの動向
- 消費者の反応パターン
- 影響を受ける主要企業
- 戦略的な業界対応
- サプライチェーンの再構成
- 価格設定と製品戦略
- 政策関与
- 展望と今後の検討事項
- 貿易への影響
- サプライヤーの情勢
- 利益率分析
- 主なニュースと取り組み
- 規制情勢
- 影響要因
- 促進要因
- 食中毒の発生率の上昇
- 厳格な政府規制
- 食品サプライチェーンの世界化
- 業界の潜在的リスク&課題
- 高い導入コスト
- 地域間の標準化の欠如
- 促進要因
- 成長可能性分析
- 貿易分析
- ポーター分析
- PESTEL分析
第4章 競合情勢
- イントロダクション
- 企業の市場シェア分析
- 競合ポジショニングマトリックス
- 戦略的展望マトリックス
第5章 市場推計・予測:機器種別、2021年~2034年
- 主要動向
- 温度センサーとコントローラー
- 湿度監視システム
- 圧力監視装置
- 流量計とコントローラ
- ガス分析装置
- その他(pH計、水分活性計、金属探知機など)
第6章 市場推計・予測:技術別、2021年~2034年
- 主要動向
- バイオセンサー
- IoTとワイヤレスセンサー
- AIとマシンビジョン
- ブロックチェーン統合
- その他
第7章 市場推計・予測:コンポーネント別、2021年~2034年
- 主要動向
- ハードウェア
- ソフトウェア
第8章 市場推計・予測:用途別、2021年~2034年
- 主要動向
- 食肉・鶏肉加工工場
- 乳製品およびチーズ製造ライン
- 水産加工設備
- 飲料瓶詰め施設
- 調理済み食品および包装食品の組立ライン
- その他
第9章 市場推計・予測:流通チャネル別、2021年~2034年
- 主要動向
- 直接
- 間接的
第10章 市場推計・予測:地域別、2021年~2034年
- 主要動向
- 北米
- 米国
- カナダ
- 欧州
- 英国
- ドイツ
- フランス
- イタリア
- スペイン
- アジア太平洋地域
- 中国
- 日本
- インド
- 韓国
- オーストラリア
- ラテンアメリカ
- ブラジル
- メキシコ
- 中東・アフリカ
- 南アフリカ
- サウジアラビア
- アラブ首長国連邦
第11章 企業プロファイル
- 3M
- ABB Ltd.
- Agilent Technologies, Inc.
- Bio-Rad Laboratories, Inc.
- Danaher Corporation
- Emerson Electric Co
- Endress+Hauser Group
- General Electric(GE)
- Honeywell International Inc.
- Mettler-Toledo International Inc.
- Rockwell Automation, Inc.
- Shimadzu Corporation
- Siemens AG
- Thermo Fisher Scientific Inc.
- Yokogawa Electric Corporation
The Global Food Safety Monitoring Systems Market was valued at USD 20.2 billion in 2024 and is estimated to grow at a CAGR of 7.4% to reach USD 40.4 billion by 2034, driven by the escalating number of foodborne illnesses and contamination incidents. As international food trade becomes more interconnected, maintaining consistent safety and quality has become a growing concern. With food items often passing through multiple countries before reaching consumers, the demand for intelligent monitoring systems has surged. These systems offer capabilities like automated data gathering, real-time surveillance, and predictive analytics, ensuring end-to-end safety from source to shelf.
Compliance with international food laws and regulatory frameworks is now a top priority, prompting businesses to adopt solutions that support requirements such as the EU General Food Law and the United States' Food Safety Modernization Act. In addition to meeting regulatory standards, these systems play a critical role in protecting brand integrity and reducing financial exposure due to product recalls or non-compliance.
| Market Scope | |
|---|---|
| Start Year | 2024 |
| Forecast Year | 2025-2034 |
| Start Value | $20.2 Billion |
| Forecast Value | $40.4 Billion |
| CAGR | 7.4% |
In 2024, the temperature sensors and controllers segment generated USD 6.8 billion and is projected to climb to USD 12 billion by 2034. These tools are essential in food safety monitoring as they help minimize microbial risks and preserve the quality of perishable goods across various points in the supply chain. Their application spans processing, transportation, cold storage, and retail operations. Whether in large-scale manufacturing or smaller facilities, these systems offer dependable, scalable, and integrated solutions that fit various operational needs.
The direct distribution channel captured a significant share of 62.9% in 2024 and is set to grow at a CAGR of 7.3% from 2025 through 2034. Direct channels allow providers of food safety monitoring systems to engage closely with end users, creating opportunities to offer customized technology, responsive support, and extended service agreements. These direct relationships help system vendors cater to unique operational demands and build long-term partnerships with clients in manufacturing and processing sectors.
United States Food Safety Monitoring Systems Market generated USD 4.1 billion in 2024 and is projected to grow at a CAGR of 7% through 2034. The country remains a global leader due to its robust regulatory environment and advanced food production landscape. Agencies responsible for food safety strictly enforce regulations that ensure the industry's commitment to traceability and compliance. High consumer expectations around food quality and safety, frequent regulatory audits, and widespread adoption of cutting-edge technologies-including IoT-enabled sensors and AI-powered analytics-are key contributors to the strong market growth in the region.
Key players leading the Food Safety Monitoring Systems Market include Honeywell International Inc., Shimadzu Corporation, Bio-Rad Laboratories, Inc., ABB Ltd., Rockwell Automation, Inc., Mettler-Toledo International Inc., 3M Company, General Electric (GE), Siemens AG, Thermo Fisher Scientific Inc., Yokogawa Electric Corporation, Endress+Hauser Group, Danaher Corporation, Emerson Electric Co, and Agilent Technologies, Inc. To solidify their market presence, companies in the food safety monitoring systems space are deploying several strategic initiatives. Many are investing heavily in R&D to enhance system accuracy, integration, and automation. Others are focusing on software and hardware interoperability to offer seamless monitoring across different stages of the supply chain. Strategic partnerships with food producers and processors help increase adoption, while regional expansion efforts aim to address growing demand in developing markets.
Table of Contents
Chapter 1 Methodology & Scope
- 1.1 Market scope & definition
- 1.2 Base estimates & calculations
- 1.3 Forecast parameters
- 1.4 Data sources
- 1.4.1 Primary
- 1.5 Secondary
- 1.5.1 Paid sources
- 1.5.2 Public sources
Chapter 2 Executive Summary
- 2.1 Industry synopsis, 2021 - 2034
Chapter 3 Industry Insights
- 3.1 Industry ecosystem analysis
- 3.1.1 Factor affecting the value chain
- 3.1.2 Profit margin analysis
- 3.1.3 Disruptions
- 3.1.4 Future outlook
- 3.1.5 Manufacturers
- 3.1.6 Distributors
- 3.1.7 Retailers
- 3.2 Trump administration tariffs analysis
- 3.2.1 Impact on trade
- 3.2.1.1 Trade volume disruptions
- 3.2.1.2 Retaliatory measures
- 3.2.2 Impact on the industry
- 3.2.3 Supply-side impact (raw materials)
- 3.2.3.1 Price volatility in key materials
- 3.2.3.2 Supply chain restructuring
- 3.2.3.3 Production cost implications
- 3.2.3.4 Demand-side impact (selling price)
- 3.2.3.5 Price transmission to end markets
- 3.2.3.6 Market share dynamics
- 3.2.3.7 Consumer response patterns
- 3.2.4 Key companies impacted
- 3.2.5 Strategic industry responses
- 3.2.5.1 Supply chain reconfiguration
- 3.2.5.2 Pricing and product strategies
- 3.2.5.3 Policy engagement
- 3.2.6 Outlook and future considerations
- 3.2.1 Impact on trade
- 3.3 Supplier landscape
- 3.4 Profit margin analysis
- 3.5 Key news & initiatives
- 3.6 Regulatory landscape
- 3.7 Impact forces
- 3.7.1 Growth drivers
- 3.7.1.1 Rising incidence of foodborne illnesses
- 3.7.1.2 Stringent government regulations
- 3.7.1.3 Globalization of food supply chains
- 3.7.2 Industry pitfalls & challenges
- 3.7.2.1 High implementation costs
- 3.7.2.2 Lack of standardization across regions
- 3.7.1 Growth drivers
- 3.8 Growth potential analysis
- 3.9 Trade analysis
- 3.10 Porter's analysis
- 3.11 PESTEL analysis
Chapter 4 Competitive Landscape, 2024
- 4.1 Introduction
- 4.2 Company market share analysis
- 4.3 Competitive positioning matrix
- 4.4 Strategic outlook matrix
Chapter 5 Market Estimates & Forecast, By Equipment Type, 2021 - 2034, (USD Billion) (Thousand Units)
- 5.1 Key trends
- 5.2 Temperature sensors and controllers
- 5.3 Humidity monitoring systems
- 5.4 Pressure monitoring devices
- 5.5 Flow meters and controllers
- 5.6 Gas analyzers
- 5.7 Others (pH meters, water activity monitors, metal detectors, etc.)
Chapter 6 Market Estimates & Forecast, By Technology, 2021 - 2034, (USD Billion) (Thousand Units)
- 6.1 Key trends
- 6.2 Biosensors
- 6.3 IoT & Wireless sensors
- 6.4 AI & Machine vision
- 6.5 Blockchain Integration
- 6.6 Others
Chapter 7 Market Estimates & Forecast, By Component, 2021 - 2034, (USD Billion) (Thousand Units)
- 7.1 Key trends
- 7.2 Hardware
- 7.3 Software
Chapter 8 Market Estimates & Forecast, By Application, 2021 - 2034, (USD Billion) (Thousand Units)
- 8.1 Key trends
- 8.2 Meat & Poultry processing plants
- 8.3 Dairy & Cheese manufacturing lines
- 8.4 Seafood processing equipment
- 8.5 Beverage bottling facilities
- 8.6 Ready-to-Eat & Packaged food assembly lines
- 8.7 Others
Chapter 9 Market Estimates & Forecast, By Distribution Channel, 2021 - 2034, (USD Billion) (Thousand Units)
- 9.1 Key trends
- 9.2 Direct
- 9.3 Indirect
Chapter 10 Market Estimates & Forecast, By Region, 2021 -2034 (USD Billion) (Thousand Units)
- 10.1 Key trends
- 10.2 North America
- 10.2.1 U.S.
- 10.2.2 Canada
- 10.3 Europe
- 10.3.1 UK
- 10.3.2 Germany
- 10.3.3 France
- 10.3.4 Italy
- 10.3.5 Spain
- 10.4 Asia Pacific
- 10.4.1 China
- 10.4.2 Japan
- 10.4.3 India
- 10.4.4 South Korea
- 10.4.5 Australia
- 10.5 Latin America
- 10.5.1 Brazil
- 10.5.2 Mexico
- 10.6 MEA
- 10.6.1 South Africa
- 10.6.2 Saudi Arabia
- 10.6.3 UAE
Chapter 11 Company Profiles (Business Overview, Financial Data, Product Landscape, Strategic Outlook, SWOT Analysis)
- 11.1 3M
- 11.2 ABB Ltd.
- 11.3 Agilent Technologies, Inc.
- 11.4 Bio-Rad Laboratories, Inc.
- 11.5 Danaher Corporation
- 11.6 Emerson Electric Co
- 11.7 Endress+Hauser Group
- 11.8 General Electric (GE)
- 11.9 Honeywell International Inc.
- 11.10 Mettler-Toledo International Inc.
- 11.11 Rockwell Automation, Inc.
- 11.12 Shimadzu Corporation
- 11.13 Siemens AG
- 11.14 Thermo Fisher Scientific Inc.
- 11.15 Yokogawa Electric Corporation

