|
|
市場調査レポート
商品コード
1516152
アスレジャーの世界市場 2024-2028Global athleisure market 2024-2028 |
||||||

|
|||||||
カスタマイズ可能
|
|||||||


| アスレジャーの世界市場 2024-2028 |
|
出版日: 2024年06月11日
発行: TechNavio
ページ情報: 英文 165 Pages
納期: 即納可能
|

全表示
- 概要
- 図表
- 目次
アスレジャー市場は2023-2028年に1,763億米ドル、予測期間中のCAGRは6.79%で成長すると予測されています。
当レポートでは、アスレジャー市場の全体的な分析、市場規模・予測、動向、成長促進要因、課題、約25のベンダーを網羅したベンダー分析などを掲載しています。
現在の市場シナリオ、最新動向と促進要因、市場環境全体に関する最新分析を提供しています。市場は、オンラインショッピングの隆盛、企業によるフィットネスイニシアチブの採用増加、アスレジャームーブメントの台頭と進化によって牽引されています。
| 市場範囲 | |
|---|---|
| 基準年 | 2024 |
| 終了年 | 2028 |
| 予測期間 | 2024-2028 |
| 成長モメンタム | 加速 |
| 前年比2024年 | 6.24% |
| CAGR | 6.79% |
| 増分額 | 1,763億米ドル |
本調査では、今後数年間のアスレジャー市場成長を牽引する主な要因の一つとして、デニムアスレジャー人気の高まりを挙げています。また、アスレジャーウェアにおけるポリエステル繊維の使用増加や、有名人とアスレジャーメーカーとのコラボレーションの増加も、市場の大きな需要につながると思われます。
目次
第1章 エグゼクティブサマリー
- 市場概要
第2章 市場情勢
- 市場エコシステム
- 市場の特徴
- バリューチェーン分析
第3章 市場規模の評価
- 市場の定義
- 市場セグメント分析
- 市場規模 2023
- 市場の見通し 2023-2028
第4章 市場規模実績
- 世界アスレジャー市場 2018-2022
- 製品別セグメント分析 2018-2022
- 流通チャネル別セグメント分析 2018-2022
- 地域別セグメント分析 2018-2022
- 国別セグメント分析 2018-2022
第5章 ファイブフォース分析
- ファイブフォースの要約
- 買い手の交渉力
- 供給企業の交渉力
- 新規参入業者の脅威
- 代替品の脅威
- 競争の脅威
- 市況
第6章 市場セグメンテーション:製品別
- 市場セグメンテーション
- 比較:製品別
- 大量生産のアスレジャー:市場規模と予測 2023-2028
- 高級感のあるアスレジャー:市場規模と予測 2023-2028
- 市場機会:製品別
第7章 市場セグメンテーション:流通チャネル別
- 市場セグメンテーション
- 比較:流通チャネル別
- オンライン:市場規模と予測 2023-2028
- オフライン:市場規模と予測 2023-2028
- 市場機会:流通チャネル別
第8章 顧客情勢
- 顧客情勢の概要
第9章 地域別情勢
- 地域別セグメンテーション
- 地域別比較
- 北米:市場規模と予測 2023-2028
- 欧州:市場規模と予測 2023-2028
- アジア太平洋:市場規模と予測 2023-2028
- 南米:市場規模と予測 2023-2028
- 中東・アフリカ:市場規模と予測 2023-2028
- 米国:市場規模と予測 2023-2028
- 英国:市場規模と予測 2023-2028
- 日本:市場規模と予測 2023-2028
- ドイツ:市場規模と予測 2023-2028
- 中国:市場規模と予測 2023-2028
- 市場機会:地域情勢別
第10章 促進要因・課題・機会・抑制要因
- 市場促進要因
- 市場の課題
- 促進要因と課題の影響
- 市場の機会・抑制要因
第11章 競合情勢
- 概要
- 競合情勢
- 混乱の状況
- 業界のリスク
第12章 競合分析
- 企業プロファイル
- 企業の市場ポジショニング
- Adidas AG
- ALALA
- ALO LLC
- American Eagle Outfitters Inc
- Carbon38 Inc.
- Columbia Sportswear Co.
- EYSOM LLC
- H and M Hennes and Mauritz GBC AB
- lululemon athletica Inc.
- Michi Design Inc.
- New Balance Athletics Inc.
- Nike Inc.
- Outdoor Voices Inc.
- P.E Nation International
- PUMA SE
第13章 付録
Exhibits:
- Exhibits1: Executive Summary - Chart on Market Overview
- Exhibits2: Executive Summary - Data Table on Market Overview
- Exhibits3: Executive Summary - Chart on Global Market Characteristics
- Exhibits4: Executive Summary - Chart on Market By Geographical Landscape
- Exhibits5: Executive Summary - Chart on Market Segmentation by Product
- Exhibits6: Executive Summary - Chart on Market Segmentation by Distribution Channel
- Exhibits7: Executive Summary - Chart on Incremental Growth
- Exhibits8: Executive Summary - Data Table on Incremental Growth
- Exhibits9: Executive Summary - Chart on Company Market Positioning
- Exhibits10: Parent Market
- Exhibits11: Data Table on - Parent Market
- Exhibits12: Market characteristics analysis
- Exhibits13: Value Chain Analysis
- Exhibits14: Offerings of companies included in the market definition
- Exhibits15: Market segments
- Exhibits16: Chart on Global - Market size and forecast 2023-2028 ($ billion)
- Exhibits17: Data Table on Global - Market size and forecast 2023-2028 ($ billion)
- Exhibits18: Chart on Global Market: Year-over-year growth 2023-2028 (%)
- Exhibits19: Data Table on Global Market: Year-over-year growth 2023-2028 (%)
- Exhibits20: Historic Market Size - Data Table on Global Athleisure Market 2018 - 2022 ($ billion)
- Exhibits21: Historic Market Size - Product Segment 2018 - 2022 ($ billion)
- Exhibits22: Historic Market Size - Distribution Channel Segment 2018 - 2022 ($ billion)
- Exhibits23: Historic Market Size - Geography Segment 2018 - 2022 ($ billion)
- Exhibits24: Historic Market Size - Country Segment 2018 - 2022 ($ billion)
- Exhibits25: Five forces analysis - Comparison between 2023 and 2028
- Exhibits26: Bargaining power of buyers - Impact of key factors 2023 and 2028
- Exhibits27: Bargaining power of suppliers - Impact of key factors in 2023 and 2028
- Exhibits28: Threat of new entrants - Impact of key factors in 2023 and 2028
- Exhibits29: Threat of substitutes - Impact of key factors in 2023 and 2028
- Exhibits30: Threat of rivalry - Impact of key factors in 2023 and 2028
- Exhibits31: Chart on Market condition - Five forces 2023 and 2028
- Exhibits32: Chart on Product - Market share 2023-2028 (%)
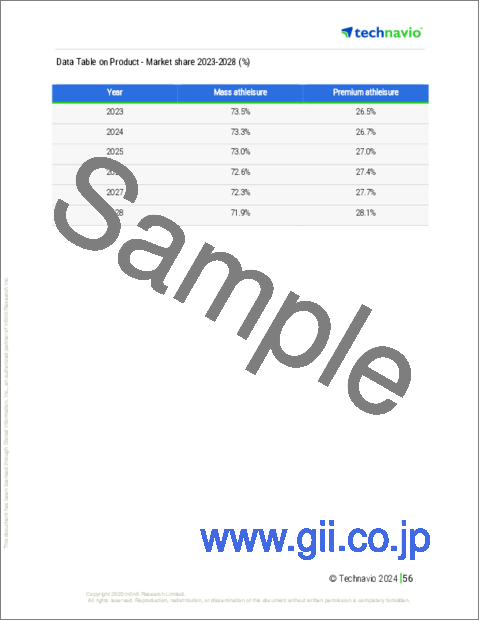
- Exhibits33: Data Table on Product - Market share 2023-2028 (%)
- Exhibits34: Chart on Comparison by Product
- Exhibits35: Data Table on Comparison by Product
- Exhibits36: Chart on Mass athleisure - Market size and forecast 2023-2028 ($ billion)
- Exhibits37: Data Table on Mass athleisure - Market size and forecast 2023-2028 ($ billion)
- Exhibits38: Chart on Mass athleisure - Year-over-year growth 2023-2028 (%)
- Exhibits39: Data Table on Mass athleisure - Year-over-year growth 2023-2028 (%)
- Exhibits40: Chart on Premium athleisure - Market size and forecast 2023-2028 ($ billion)
- Exhibits41: Data Table on Premium athleisure - Market size and forecast 2023-2028 ($ billion)
- Exhibits42: Chart on Premium athleisure - Year-over-year growth 2023-2028 (%)
- Exhibits43: Data Table on Premium athleisure - Year-over-year growth 2023-2028 (%)
- Exhibits44: Market opportunity by Product ($ billion)
- Exhibits45: Data Table on Market opportunity by Product ($ billion)
- Exhibits46: Chart on Distribution Channel - Market share 2023-2028 (%)
- Exhibits47: Data Table on Distribution Channel - Market share 2023-2028 (%)
- Exhibits48: Chart on Comparison by Distribution Channel
- Exhibits49: Data Table on Comparison by Distribution Channel
- Exhibits50: Chart on Online - Market size and forecast 2023-2028 ($ billion)
- Exhibits51: Data Table on Online - Market size and forecast 2023-2028 ($ billion)
- Exhibits52: Chart on Online - Year-over-year growth 2023-2028 (%)
- Exhibits53: Data Table on Online - Year-over-year growth 2023-2028 (%)
- Exhibits54: Chart on Offline - Market size and forecast 2023-2028 ($ billion)
- Exhibits55: Data Table on Offline - Market size and forecast 2023-2028 ($ billion)
- Exhibits56: Chart on Offline - Year-over-year growth 2023-2028 (%)
- Exhibits57: Data Table on Offline - Year-over-year growth 2023-2028 (%)
- Exhibits58: Market opportunity by Distribution Channel ($ billion)
- Exhibits59: Data Table on Market opportunity by Distribution Channel ($ billion)
- Exhibits60: Analysis of price sensitivity, lifecycle, customer purchase basket, adoption rates, and purchase criteria
- Exhibits61: Chart on Market share By Geographical Landscape 2023-2028 (%)
- Exhibits62: Data Table on Market share By Geographical Landscape 2023-2028 (%)
- Exhibits63: Chart on Geographic comparison
- Exhibits64: Data Table on Geographic comparison
- Exhibits65: Chart on North America - Market size and forecast 2023-2028 ($ billion)
- Exhibits66: Data Table on North America - Market size and forecast 2023-2028 ($ billion)
- Exhibits67: Chart on North America - Year-over-year growth 2023-2028 (%)
- Exhibits68: Data Table on North America - Year-over-year growth 2023-2028 (%)
- Exhibits69: Chart on Europe - Market size and forecast 2023-2028 ($ billion)
- Exhibits70: Data Table on Europe - Market size and forecast 2023-2028 ($ billion)
- Exhibits71: Chart on Europe - Year-over-year growth 2023-2028 (%)
- Exhibits72: Data Table on Europe - Year-over-year growth 2023-2028 (%)
- Exhibits73: Chart on APAC - Market size and forecast 2023-2028 ($ billion)
- Exhibits74: Data Table on APAC - Market size and forecast 2023-2028 ($ billion)
- Exhibits75: Chart on APAC - Year-over-year growth 2023-2028 (%)
- Exhibits76: Data Table on APAC - Year-over-year growth 2023-2028 (%)
- Exhibits77: Chart on South America - Market size and forecast 2023-2028 ($ billion)
- Exhibits78: Data Table on South America - Market size and forecast 2023-2028 ($ billion)
- Exhibits79: Chart on South America - Year-over-year growth 2023-2028 (%)
- Exhibits80: Data Table on South America - Year-over-year growth 2023-2028 (%)
- Exhibits81: Chart on Middle East and Africa - Market size and forecast 2023-2028 ($ billion)
- Exhibits82: Data Table on Middle East and Africa - Market size and forecast 2023-2028 ($ billion)
- Exhibits83: Chart on Middle East and Africa - Year-over-year growth 2023-2028 (%)
- Exhibits84: Data Table on Middle East and Africa - Year-over-year growth 2023-2028 (%)
- Exhibits85: Chart on US - Market size and forecast 2023-2028 ($ billion)
- Exhibits86: Data Table on US - Market size and forecast 2023-2028 ($ billion)
- Exhibits87: Chart on US - Year-over-year growth 2023-2028 (%)
- Exhibits88: Data Table on US - Year-over-year growth 2023-2028 (%)
- Exhibits89: Chart on UK - Market size and forecast 2023-2028 ($ billion)
- Exhibits90: Data Table on UK - Market size and forecast 2023-2028 ($ billion)
- Exhibits91: Chart on UK - Year-over-year growth 2023-2028 (%)
- Exhibits92: Data Table on UK - Year-over-year growth 2023-2028 (%)
- Exhibits93: Chart on Japan - Market size and forecast 2023-2028 ($ billion)
- Exhibits94: Data Table on Japan - Market size and forecast 2023-2028 ($ billion)
- Exhibits95: Chart on Japan - Year-over-year growth 2023-2028 (%)
- Exhibits96: Data Table on Japan - Year-over-year growth 2023-2028 (%)
- Exhibits97: Chart on Germany - Market size and forecast 2023-2028 ($ billion)
- Exhibits98: Data Table on Germany - Market size and forecast 2023-2028 ($ billion)
- Exhibits99: Chart on Germany - Year-over-year growth 2023-2028 (%)
- Exhibits100: Data Table on Germany - Year-over-year growth 2023-2028 (%)
- Exhibits101: Chart on China - Market size and forecast 2023-2028 ($ billion)
- Exhibits102: Data Table on China - Market size and forecast 2023-2028 ($ billion)
- Exhibits103: Chart on China - Year-over-year growth 2023-2028 (%)
- Exhibits104: Data Table on China - Year-over-year growth 2023-2028 (%)
- Exhibits105: Market opportunity By Geographical Landscape ($ billion)
- Exhibits106: Data Tables on Market opportunity By Geographical Landscape ($ billion)
- Exhibits107: Impact of drivers and challenges in 2023 and 2028
- Exhibits108: Overview on criticality of inputs and factors of differentiation
- Exhibits109: Overview on factors of disruption
- Exhibits110: Impact of key risks on business
- Exhibits111: Companies covered
- Exhibits112: Matrix on companies position and classification
- Exhibits113: Adidas AG - Overview
- Exhibits114: Adidas AG - Business segments
- Exhibits115: Adidas AG - Key news
- Exhibits116: Adidas AG - Key offerings
- Exhibits117: Adidas AG - Segment focus
- Exhibits118: ALALA - Overview
- Exhibits119: ALALA - Product / Service
- Exhibits120: ALALA - Key offerings
- Exhibits121: ALO LLC - Overview
- Exhibits122: ALO LLC - Product / Service
- Exhibits123: ALO LLC - Key offerings
- Exhibits124: American Eagle Outfitters Inc - Overview
- Exhibits125: American Eagle Outfitters Inc - Business segments
- Exhibits126: American Eagle Outfitters Inc - Key offerings
- Exhibits127: American Eagle Outfitters Inc - Segment focus
- Exhibits128: Carbon38 Inc. - Overview
- Exhibits129: Carbon38 Inc. - Product / Service
- Exhibits130: Carbon38 Inc. - Key offerings
- Exhibits131: Columbia Sportswear Co. - Overview
- Exhibits132: Columbia Sportswear Co. - Business segments
- Exhibits133: Columbia Sportswear Co. - Key news
- Exhibits134: Columbia Sportswear Co. - Key offerings
- Exhibits135: Columbia Sportswear Co. - Segment focus
- Exhibits136: EYSOM LLC - Overview
- Exhibits137: EYSOM LLC - Product / Service
- Exhibits138: EYSOM LLC - Key offerings
- Exhibits139: H and M Hennes and Mauritz GBC AB - Overview
- Exhibits140: H and M Hennes and Mauritz GBC AB - Business segments
- Exhibits141: H and M Hennes and Mauritz GBC AB - Key news
- Exhibits142: H and M Hennes and Mauritz GBC AB - Key offerings
- Exhibits143: H and M Hennes and Mauritz GBC AB - Segment focus
- Exhibits144: lululemon athletica Inc. - Overview
- Exhibits145: lululemon athletica Inc. - Business segments
- Exhibits146: lululemon athletica Inc. - Key offerings
- Exhibits147: lululemon athletica Inc. - Segment focus
- Exhibits148: Michi Design Inc. - Overview
- Exhibits149: Michi Design Inc. - Product / Service
- Exhibits150: Michi Design Inc. - Key offerings
- Exhibits151: New Balance Athletics Inc. - Overview
- Exhibits152: New Balance Athletics Inc. - Product / Service
- Exhibits153: New Balance Athletics Inc. - Key news
- Exhibits154: New Balance Athletics Inc. - Key offerings
- Exhibits155: Nike Inc. - Overview
- Exhibits156: Nike Inc. - Business segments
- Exhibits157: Nike Inc. - Key news
- Exhibits158: Nike Inc. - Key offerings
- Exhibits159: Nike Inc. - Segment focus
- Exhibits160: Outdoor Voices Inc. - Overview
- Exhibits161: Outdoor Voices Inc. - Product / Service
- Exhibits162: Outdoor Voices Inc. - Key offerings
- Exhibits163: P.E Nation International - Overview
- Exhibits164: P.E Nation International - Product / Service
- Exhibits165: P.E Nation International - Key offerings
- Exhibits166: PUMA SE - Overview
- Exhibits167: PUMA SE - Business segments
- Exhibits168: PUMA SE - Key news
- Exhibits169: PUMA SE - Key offerings
- Exhibits170: PUMA SE - Segment focus
- Exhibits171: Inclusions checklist
- Exhibits172: Exclusions checklist
- Exhibits173: Currency conversion rates for US$
- Exhibits174: Research methodology
- Exhibits175: Information sources
- Exhibits176: Data validation
- Exhibits177: Validation techniques employed for market sizing
- Exhibits178: Data synthesis
- Exhibits179: 360 degree market analysis
- Exhibits180: List of abbreviations
The athleisure market is forecasted to grow by USD 176.3 bn during 2023-2028, accelerating at a CAGR of 6.79% during the forecast period. The report on the athleisure market provides a holistic analysis, market size and forecast, trends, growth drivers, and challenges, as well as vendor analysis covering around 25 vendors.
The report offers an up-to-date analysis regarding the current market scenario, the latest trends and drivers, and the overall market environment. The market is driven by growing prominence of online shopping, increasing adoption of fitness initiatives by corporates, and rise and evolution of the athleisure movement.
Technavio's athleisure market is segmented as below:
| Market Scope | |
|---|---|
| Base Year | 2024 |
| End Year | 2028 |
| Series Year | 2024-2028 |
| Growth Momentum | Accelerate |
| YOY 2024 | 6.24% |
| CAGR | 6.79% |
| Incremental Value | $176.3bn |
By Product
- Mass athleisure
- Premium athleisure
By Distribution Channel
- Online
- Offline
By Geographical Landscape
- North America
- Europe
- APAC
- South America
- Middle East and Africa
This study identifies the rising popularity of denim athleisure as one of the prime reasons driving the athleisure market growth during the next few years. Also, increasing use of polyester fiber in athleisure wear and increasing collaborations between celebrities and athleisure manufacturers will lead to sizable demand in the market.
The report on the athleisure market covers the following areas:
- Athleisure market sizing
- Athleisure market forecast
- Athleisure market industry analysis
The robust vendor analysis is designed to help clients improve their market position, and in line with this, this report provides a detailed analysis of several leading athleisure market vendors that include Adidas AG, ALALA, ALO LLC, American Eagle Outfitters Inc, Carbon38 Inc., Columbia Sportswear Co., EYSOM LLC, The Gap Inc., H and M Hennes and Mauritz GBC AB, lululemon athletica Inc., Michi Design Inc., New Balance Athletics Inc., Nike Inc., Outdoor Voices Inc., P.E Nation International, PUMA SE, Rhone Apparel Inc, Sweaty Betty Ltd., Under Armour Inc., and VF Corp.. Also, the athleisure market analysis report includes information on upcoming trends and challenges that will influence market growth. This is to help companies strategize and leverage all forthcoming growth opportunities.
The study was conducted using an objective combination of primary and secondary information including inputs from key participants in the industry. The report contains a comprehensive market and vendor landscape in addition to an analysis of the key vendors.
The publisher presents a detailed picture of the market by the way of study, synthesis, and summation of data from multiple sources by an analysis of key parameters such as profit, pricing, competition, and promotions. It presents various market facets by identifying the key industry influencers. The data presented is comprehensive, reliable, and a result of extensive research - both primary and secondary. The market research reports provide a complete competitive landscape and an in-depth vendor selection methodology and analysis using qualitative and quantitative research to forecast the accurate market growth.
Table of Contents
1 Executive Summary
- 1.1 Market overview
- Executive Summary - Chart on Market Overview
- Executive Summary - Data Table on Market Overview
- Executive Summary - Chart on Global Market Characteristics
- Executive Summary - Chart on Market By Geographical Landscape
- Executive Summary - Chart on Market Segmentation by Product
- Executive Summary - Chart on Market Segmentation by Distribution Channel
- Executive Summary - Chart on Incremental Growth
- Executive Summary - Data Table on Incremental Growth
- Executive Summary - Chart on Company Market Positioning
2 Market Landscape
- 2.1 Market ecosystem
- Parent Market
- Data Table on - Parent Market
- 2.2 Market characteristics
- Market characteristics analysis
- 2.3 Value chain analysis
- Value Chain Analysis
3 Market Sizing
- 3.1 Market definition
- Offerings of companies included in the market definition
- 3.2 Market segment analysis
- Market segments
- 3.3 Market size 2023
- 3.4 Market outlook: Forecast for 2023-2028
- Chart on Global - Market size and forecast 2023-2028 ($ billion)
- Data Table on Global - Market size and forecast 2023-2028 ($ billion)
- Chart on Global Market: Year-over-year growth 2023-2028 (%)
- Data Table on Global Market: Year-over-year growth 2023-2028 (%)
4 Historic Market Size
- 4.1 Global Athleisure Market 2018 - 2022
- Historic Market Size - Data Table on Global Athleisure Market 2018 - 2022 ($ billion)
- 4.2 Product segment analysis 2018 - 2022
- Historic Market Size - Product Segment 2018 - 2022 ($ billion)
- 4.3 Distribution Channel segment analysis 2018 - 2022
- Historic Market Size - Distribution Channel Segment 2018 - 2022 ($ billion)
- 4.4 Geography segment analysis 2018 - 2022
- Historic Market Size - Geography Segment 2018 - 2022 ($ billion)
- 4.5 Country segment analysis 2018 - 2022
- Historic Market Size - Country Segment 2018 - 2022 ($ billion)
5 Five Forces Analysis
- 5.1 Five forces summary
- Five forces analysis - Comparison between 2023 and 2028
- 5.2 Bargaining power of buyers
- Bargaining power of buyers - Impact of key factors 2023 and 2028
- 5.3 Bargaining power of suppliers
- Bargaining power of suppliers - Impact of key factors in 2023 and 2028
- 5.4 Threat of new entrants
- Threat of new entrants - Impact of key factors in 2023 and 2028
- 5.5 Threat of substitutes
- Threat of substitutes - Impact of key factors in 2023 and 2028
- 5.6 Threat of rivalry
- Threat of rivalry - Impact of key factors in 2023 and 2028
- 5.7 Market condition
- Chart on Market condition - Five forces 2023 and 2028
6 Market Segmentation by Product
- 6.1 Market segments
- Chart on Product - Market share 2023-2028 (%)
- Data Table on Product - Market share 2023-2028 (%)
- 6.2 Comparison by Product
- Chart on Comparison by Product
- Data Table on Comparison by Product
- 6.3 Mass athleisure - Market size and forecast 2023-2028
- Chart on Mass athleisure - Market size and forecast 2023-2028 ($ billion)
- Data Table on Mass athleisure - Market size and forecast 2023-2028 ($ billion)
- Chart on Mass athleisure - Year-over-year growth 2023-2028 (%)
- Data Table on Mass athleisure - Year-over-year growth 2023-2028 (%)
- 6.4 Premium athleisure - Market size and forecast 2023-2028
- Chart on Premium athleisure - Market size and forecast 2023-2028 ($ billion)
- Data Table on Premium athleisure - Market size and forecast 2023-2028 ($ billion)
- Chart on Premium athleisure - Year-over-year growth 2023-2028 (%)
- Data Table on Premium athleisure - Year-over-year growth 2023-2028 (%)
- 6.5 Market opportunity by Product
- Market opportunity by Product ($ billion)
- Data Table on Market opportunity by Product ($ billion)
7 Market Segmentation by Distribution Channel
- 7.1 Market segments
- Chart on Distribution Channel - Market share 2023-2028 (%)
- Data Table on Distribution Channel - Market share 2023-2028 (%)
- 7.2 Comparison by Distribution Channel
- Chart on Comparison by Distribution Channel
- Data Table on Comparison by Distribution Channel
- 7.3 Online - Market size and forecast 2023-2028
- Chart on Online - Market size and forecast 2023-2028 ($ billion)
- Data Table on Online - Market size and forecast 2023-2028 ($ billion)
- Chart on Online - Year-over-year growth 2023-2028 (%)
- Data Table on Online - Year-over-year growth 2023-2028 (%)
- 7.4 Offline - Market size and forecast 2023-2028
- Chart on Offline - Market size and forecast 2023-2028 ($ billion)
- Data Table on Offline - Market size and forecast 2023-2028 ($ billion)
- Chart on Offline - Year-over-year growth 2023-2028 (%)
- Data Table on Offline - Year-over-year growth 2023-2028 (%)
- 7.5 Market opportunity by Distribution Channel
- Market opportunity by Distribution Channel ($ billion)
- Data Table on Market opportunity by Distribution Channel ($ billion)
8 Customer Landscape
- 8.1 Customer landscape overview
- Analysis of price sensitivity, lifecycle, customer purchase basket, adoption rates, and purchase criteria
9 Geographic Landscape
- 9.1 Geographic segmentation
- Chart on Market share By Geographical Landscape 2023-2028 (%)
- Data Table on Market share By Geographical Landscape 2023-2028 (%)
- 9.2 Geographic comparison
- Chart on Geographic comparison
- Data Table on Geographic comparison
- 9.3 North America - Market size and forecast 2023-2028
- Chart on North America - Market size and forecast 2023-2028 ($ billion)
- Data Table on North America - Market size and forecast 2023-2028 ($ billion)
- Chart on North America - Year-over-year growth 2023-2028 (%)
- Data Table on North America - Year-over-year growth 2023-2028 (%)
- 9.4 Europe - Market size and forecast 2023-2028
- Chart on Europe - Market size and forecast 2023-2028 ($ billion)
- Data Table on Europe - Market size and forecast 2023-2028 ($ billion)
- Chart on Europe - Year-over-year growth 2023-2028 (%)
- Data Table on Europe - Year-over-year growth 2023-2028 (%)
- 9.5 APAC - Market size and forecast 2023-2028
- Chart on APAC - Market size and forecast 2023-2028 ($ billion)
- Data Table on APAC - Market size and forecast 2023-2028 ($ billion)
- Chart on APAC - Year-over-year growth 2023-2028 (%)
- Data Table on APAC - Year-over-year growth 2023-2028 (%)
- 9.6 South America - Market size and forecast 2023-2028
- Chart on South America - Market size and forecast 2023-2028 ($ billion)
- Data Table on South America - Market size and forecast 2023-2028 ($ billion)
- Chart on South America - Year-over-year growth 2023-2028 (%)
- Data Table on South America - Year-over-year growth 2023-2028 (%)
- 9.7 Middle East and Africa - Market size and forecast 2023-2028
- Chart on Middle East and Africa - Market size and forecast 2023-2028 ($ billion)
- Data Table on Middle East and Africa - Market size and forecast 2023-2028 ($ billion)
- Chart on Middle East and Africa - Year-over-year growth 2023-2028 (%)
- Data Table on Middle East and Africa - Year-over-year growth 2023-2028 (%)
- 9.8 US - Market size and forecast 2023-2028
- Chart on US - Market size and forecast 2023-2028 ($ billion)
- Data Table on US - Market size and forecast 2023-2028 ($ billion)
- Chart on US - Year-over-year growth 2023-2028 (%)
- Data Table on US - Year-over-year growth 2023-2028 (%)
- 9.9 UK - Market size and forecast 2023-2028
- Chart on UK - Market size and forecast 2023-2028 ($ billion)
- Data Table on UK - Market size and forecast 2023-2028 ($ billion)
- Chart on UK - Year-over-year growth 2023-2028 (%)
- Data Table on UK - Year-over-year growth 2023-2028 (%)
- 9.10 Japan - Market size and forecast 2023-2028
- Chart on Japan - Market size and forecast 2023-2028 ($ billion)
- Data Table on Japan - Market size and forecast 2023-2028 ($ billion)
- Chart on Japan - Year-over-year growth 2023-2028 (%)
- Data Table on Japan - Year-over-year growth 2023-2028 (%)
- 9.11 Germany - Market size and forecast 2023-2028
- Chart on Germany - Market size and forecast 2023-2028 ($ billion)
- Data Table on Germany - Market size and forecast 2023-2028 ($ billion)
- Chart on Germany - Year-over-year growth 2023-2028 (%)
- Data Table on Germany - Year-over-year growth 2023-2028 (%)
- 9.12 China - Market size and forecast 2023-2028
- Chart on China - Market size and forecast 2023-2028 ($ billion)
- Data Table on China - Market size and forecast 2023-2028 ($ billion)
- Chart on China - Year-over-year growth 2023-2028 (%)
- Data Table on China - Year-over-year growth 2023-2028 (%)
- 9.13 Market opportunity By Geographical Landscape
- Market opportunity By Geographical Landscape ($ billion)
- Data Tables on Market opportunity By Geographical Landscape ($ billion)
10 Drivers, Challenges, and Opportunity/Restraints
- 10.1 Market drivers
- 10.2 Market challenges
- 10.3 Impact of drivers and challenges
- Impact of drivers and challenges in 2023 and 2028
- 10.4 Market opportunities/restraints
11 Competitive Landscape
- 11.1 Overview
- 11.2 Competitive Landscape
- Overview on criticality of inputs and factors of differentiation
- 11.3 Landscape disruption
- Overview on factors of disruption
- 11.4 Industry risks
- Impact of key risks on business
12 Competitive Analysis
- 12.1 Companies profiled
- Companies covered
- 12.2 Market positioning of companies
- Matrix on companies position and classification
- 12.3 Adidas AG
- Adidas AG - Overview
- Adidas AG - Business segments
- Adidas AG - Key news
- Adidas AG - Key offerings
- Adidas AG - Segment focus
- 12.4 ALALA
- ALALA - Overview
- ALALA - Product / Service
- ALALA - Key offerings
- 12.5 ALO LLC
- ALO LLC - Overview
- ALO LLC - Product / Service
- ALO LLC - Key offerings
- 12.6 American Eagle Outfitters Inc
- American Eagle Outfitters Inc - Overview
- American Eagle Outfitters Inc - Business segments
- American Eagle Outfitters Inc - Key offerings
- American Eagle Outfitters Inc - Segment focus
- 12.7 Carbon38 Inc.
- Carbon38 Inc. - Overview
- Carbon38 Inc. - Product / Service
- Carbon38 Inc. - Key offerings
- 12.8 Columbia Sportswear Co.
- Columbia Sportswear Co. - Overview
- Columbia Sportswear Co. - Business segments
- Columbia Sportswear Co. - Key news
- Columbia Sportswear Co. - Key offerings
- Columbia Sportswear Co. - Segment focus
- 12.9 EYSOM LLC
- EYSOM LLC - Overview
- EYSOM LLC - Product / Service
- EYSOM LLC - Key offerings
- 12.10 H and M Hennes and Mauritz GBC AB
- H and M Hennes and Mauritz GBC AB - Overview
- H and M Hennes and Mauritz GBC AB - Business segments
- H and M Hennes and Mauritz GBC AB - Key news
- H and M Hennes and Mauritz GBC AB - Key offerings
- H and M Hennes and Mauritz GBC AB - Segment focus
- 12.11 lululemon athletica Inc.
- lululemon athletica Inc. - Overview
- lululemon athletica Inc. - Business segments
- lululemon athletica Inc. - Key offerings
- lululemon athletica Inc. - Segment focus
- 12.12 Michi Design Inc.
- Michi Design Inc. - Overview
- Michi Design Inc. - Product / Service
- Michi Design Inc. - Key offerings
- 12.13 New Balance Athletics Inc.
- New Balance Athletics Inc. - Overview
- New Balance Athletics Inc. - Product / Service
- New Balance Athletics Inc. - Key news
- New Balance Athletics Inc. - Key offerings
- 12.14 Nike Inc.
- Nike Inc. - Overview
- Nike Inc. - Business segments
- Nike Inc. - Key news
- Nike Inc. - Key offerings
- Nike Inc. - Segment focus
- 12.15 Outdoor Voices Inc.
- Outdoor Voices Inc. - Overview
- Outdoor Voices Inc. - Product / Service
- Outdoor Voices Inc. - Key offerings
- 12.16 P.E Nation International
- P.E Nation International - Overview
- P.E Nation International - Product / Service
- P.E Nation International - Key offerings
- 12.17 PUMA SE
- PUMA SE - Overview
- PUMA SE - Business segments
- PUMA SE - Key news
- PUMA SE - Key offerings
- PUMA SE - Segment focus
13 Appendix
- 13.1 Scope of the report
- 13.2 Inclusions and exclusions checklist
- Inclusions checklist
- Exclusions checklist
- 13.3 Currency conversion rates for US$
- Currency conversion rates for US$
- 13.4 Research methodology
- Research methodology
- 13.5 Data procurement
- Information sources
- 13.6 Data validation
- Data validation
- 13.7 Validation techniques employed for market sizing
- Validation techniques employed for market sizing
- 13.8 Data synthesis
- Data synthesis
- 13.9 360 degree market analysis
- 360 degree market analysis
- 13.10 List of abbreviations
- List of abbreviations
