|
|
市場調査レポート
商品コード
1937119
家庭用テキスタイル小売の世界市場 2026年~2030年Global Home Textile Retail Market 2026-2030 |
||||||
|
|||||||
カスタマイズ可能
|
|||||||

| 家庭用テキスタイル小売の世界市場 2026年~2030年 |
|
出版日: 2026年02月11日
発行: TechNavio
ページ情報: 英文 303 Pages
納期: 即納可能
|

概要
世界のホームテキスタイル小売市場は、2025年から2030年の間に802億米ドルの成長が見込まれ、予測期間中のCAGRは6.7%と予測されています。
本報告書では、世界のホームテキスタイル小売市場に関する包括的な分析、市場規模と予測、動向、成長要因、課題に加え、約25社のベンダー分析を提供しております。
本レポートは、現在の市場状況、最新の動向と促進要因、市場環境全般に関する最新の分析を提供します。市場は、住宅不動産セクターの拡大と都市開発、材料科学と機能性テキスタイル技術の革新、持続可能で環境に配慮した製品への需要の高まりによって牽引されています。
本調査は、業界の主要関係者からの情報を含む、一次情報と二次情報の客観的な組み合わせを用いて実施されました。本レポートには、主要企業の分析に加え、包括的な市場規模データ、地域別分析を伴うセグメント、ベンダー情勢が含まれています。レポートには過去データと予測データが掲載されています。
| 市場範囲 | |
|---|---|
| 基準年 | 2026年 |
| 終了年 | 2030年 |
| 予測期間 | 2026-2030 |
| 成長モメンタム | 加速 |
| 前年比2026年 | 5.9% |
| CAGR | 6.7% |
| 増分額 | 802億米ドル |
本調査では、バイオ機能性素材とウェルネス中心のデザインを統合することが、今後数年間における世界のホームテキスタイル小売市場成長を牽引する主要な要因の一つであると特定しております。また、循環型経済への移行、使用済み繊維のリサイクル、そして高度にパーソナライズされたオムニチャネル小売体験の進展が、市場において大きな需要を生み出すことになると予測されます。
目次
第1章 エグゼクティブサマリー
第2章 Technavio分析
- 価格・ライフサイクル・顧客購入バスケット・採用率・購入基準の分析
- インプットの重要性と差別化の要因
- 混乱の要因
- 促進要因と課題の影響
第3章 市場情勢
- 市場エコシステム
- 市場の特徴
- バリューチェーン分析
第4章 市場規模
- 市場の定義
- 市場セグメント分析
- 市場規模 2025
- 市場の見通し 2025-2030
第5章 市場規模実績
- 家庭用テキスタイル小売の世界市場 2020-2024
- 流通チャネルセグメント分析 2020-2024
- 製品セグメント分析 2020-2024
- 素材セグメント分析 2020-2024
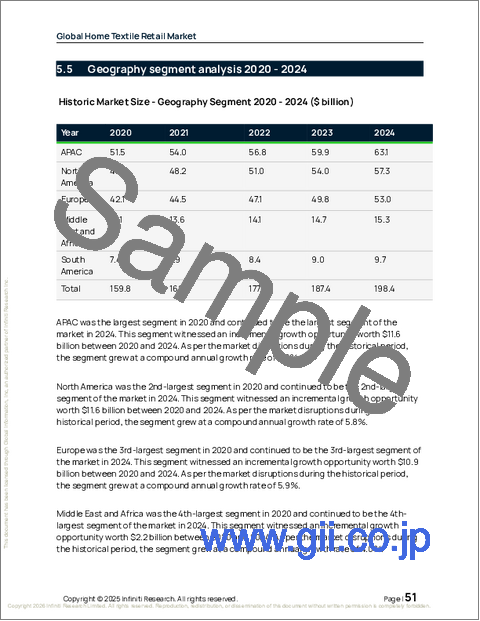
- 地域別セグメント分析 2020-2024
- 国別セグメント分析 2020-2024
第6章 定性分析
- AIの影響:家庭用テキスタイル小売の世界市場
第7章 ファイブフォース分析
- ファイブフォースの要約
- 買い手の交渉力
- 供給企業の交渉力
- 新規参入業者の脅威
- 代替品の脅威
- 競争の脅威
- 市況
第8章 市場セグメンテーション:流通チャネル別
- 比較:流通チャネル別
- オフライン
- オンライン
- 市場機会:流通チャネル別
第9章 市場セグメンテーション:製品別
- 比較:製品別
- BBO
- ベッドリネン
- カーペットおよびラグ
- 家具用布地
- その他
- 市場機会:製品別
第10章 市場セグメンテーション:素材別
- 比較:素材別
- 天然繊維
- 合成繊維
- 混紡素材
- その他
- 市場機会:素材別
第11章 顧客情勢
第12章 地域別情勢
- 地域別セグメンテーション
- 地域別比較
- アジア太平洋
- 中国
- インド
- 日本
- 韓国
- オーストラリア
- インドネシア
- 北米
- 米国
- カナダ
- メキシコ
- 欧州
- ドイツ
- 英国
- フランス
- イタリア
- スペイン
- オランダ
- 中東・アフリカ
- サウジアラビア
- アラブ首長国連邦
- 南アフリカ
- エジプト
- トルコ
- 南米
- ブラジル
- アルゼンチン
- コロンビア
- 市場機会:地域別
第13章 促進要因・課題・機会
- 市場促進要因
- 市場の課題
- 促進要因と課題の影響
- 市場機会
第14章 競合情勢
- 概要
- 競合情勢
- 混乱の状況
- 業界のリスク
第15章 競合分析
- 企業プロファイル
- 企業ランキング指標
- 企業の市場ポジショニング
- Amazon.com Inc.
- Ashley Global Retail LLC
- Beyond Inc.
- Crate and Barrel
- Hennes and Mauritz AB
- Industria de Diseno Textil SA
- Inter IKEA Holding BV
- Kohls Corp.
- Lowes Co. Inc.
- Macys Inc.
- Ralph Lauren Corp.
- Steinhoff International Holdings
- Target Corp.
- The Kroger Co.
- Trident Ltd.

