|
|
市場調査レポート
商品コード
1652782
スーパーコンピューターの世界市場(2025年~2029年)Global Supercomputer Market 2025-2029 |
||||||

|
|||||||
カスタマイズ可能
|
|||||||

| スーパーコンピューターの世界市場(2025年~2029年) |
|
出版日: 2025年01月23日
発行: TechNavio
ページ情報: 英文 239 Pages
納期: 即納可能
|

全表示
- 概要
- 目次
世界のスーパーコンピューターの市場規模は、2024年~2029年に397億8,860万米ドルに達し、予測期間中のCAGRは28.4%で成長すると予測されます。
この調査レポートは、スーパーコンピューター市場の全体分析、市場規模・予測、動向、成長促進要因、課題を掲載し、約25のベンダーを網羅したベンダー分析も掲載しています。
当レポートは、現在の市場シナリオ、最新動向と促進要因、市場環境全体に関する最新分析を提供しています。市場は、スーパーコンピューティングシステムの導入が進む商用顧客、ビッグデータ分析の利用拡大、国家安全保障上の懸念に起因する政府部門からの高い需要が牽引しています。
| 市場範囲 | |
|---|---|
| 基準年 | 2025年 |
| 終了年 | 2029年 |
| 予測期間 | 2025年~2029年 |
| 成長モメンタム | 加速 |
| 前年比2025年 | 22.2% |
| CAGR | 28.4% |
| 増分額 | 397億8,860万米ドル |
本調査では、今後数年間のスーパーコンピューター市場の成長を促進する主な要因の1つとして、クラウド利用の拡大を挙げています。また、性能に影響を与えるソフトウェアの問題や、エネルギー効率の高いスーパーコンピューティングへの注力も、市場の大きな需要につながります。
目次
第1章 エグゼクティブサマリー
- 市場概要
第2章 Technavioの分析
- 価格感度・ライフサイクル・顧客購入バスケット・採用率・購入基準の分析
- インプットの重要性と差別化の要因
- ディスラプションの要因
- 促進要因と課題の影響
第3章 市場情勢
- 市場エコシステム
- 市場の特徴
- バリューチェーン分析
第4章 市場規模
- 市場の定義
- 市場セグメント分析
- 市場規模(2024年)
- 市場の見通し(2024年~2029年)
第5章 市場規模実績
- スーパーコンピューターの世界市場(2019年~2023年)
- OSセグメント分析(2019年~2023年)
- エンドユーザーセグメント分析(2019年~2023年)
- プロセッサタイプセグメント分析(2019年~2023年)
- 地域セグメント分析(2019年~2023年)
- 国セグメント分析(2019年~2023年)
第6章 定性分析
- AIの影響:スーパーコンピューターの世界市場
第7章 ファイブフォース分析
- ファイブフォースの要約
- 買い手の交渉力
- 供給企業の交渉力
- 新規参入業者の脅威
- 代替品の脅威
- 競争の脅威
- 市況
第8章 市場セグメンテーション:OS別
- 市場セグメント
- 比較:OS別
- Linux:市場規模と予測(2024年~2029年)
- UNIX:市場規模と予測(2024年~2029年)
- 混合:市場規模と予測(2024年~2029年)
- Windows:市場規模と予測(2024年~2029年)
- 市場機会:OS別
第9章 市場セグメンテーション:エンドユーザー別
- 市場セグメント
- 比較:エンドユーザー別
- 政府機関:市場規模と予測(2024年~2029年)
- 科学研究・学術機関:市場規模と予測(2024年~2029年)
- 商業:市場規模と予測(2024年~2029年)
- 市場機会:エンドユーザー別
第10章 市場セグメンテーション:プロセッサタイプ別
- 市場セグメント
- 比較:プロセッサタイプ別
- Intel:市場規模と予測(2024年~2029年)
- IBM(Power):市場規模と予測(2024年~2029年)
- AMD:市場規模と予測(2024年~2029年)
- その他:市場規模と予測(2024年~2029年)
- 市場機会:プロセッサタイプ別
第11章 顧客情勢
- 顧客情勢の概要
第12章 地域別情勢
- 地域別セグメンテーション
- 地域別比較
- アジア太平洋:市場規模と予測(2024年~2029年)
- 北米:市場規模と予測(2024年~2029年)
- 欧州:市場規模と予測(2024年~2029年)
- 南米:市場規模と予測(2024年~2029年)
- 中東・アフリカ:市場規模と予測(2024年~2029年)
- 米国:市場規模と予測(2024年~2029年)
- 中国:市場規模と予測(2024年~2029年)
- 日本:市場規模と予測(2024年~2029年)
- インド:市場規模と予測(2024年~2029年)
- カナダ:市場規模と予測(2024年~2029年)
- フランス:市場規模と予測(2024年~2029年)
- 英国:市場規模と予測(2024年~2029年)
- ドイツ:市場規模と予測(2024年~2029年)
- ブラジル:市場規模と予測(2024年~2029年)
- スペイン:市場規模と予測(2024年~2029年)
- 市場機会:地域情勢別
第13章 促進要因・課題・機会・抑制要因
- 市場促進要因
- 市場の課題
- 促進要因と課題の影響
- 市場の機会・抑制要因
第14章 競合情勢
- 概要
- 競合情勢
- ディスラプションの状況
- 業界のリスク
第15章 競合分析
- 企業プロファイル
- 企業ランキング指数
- 企業の市場ポジショニング
- Advanced Micro Devices Inc.
- Apple Inc.
- Atos SE
- Dell Technologies Inc.
- Ford Motor Co.
- Fujitsu Ltd.
- Hewlett Packard Enterprise Co.
- Hitachi Ltd.
- Intel Corp.
- International Business Machines Corp.
- Lenovo Group Ltd.
- Microsoft Corp.
- NVIDIA Corp.
- Renesas Electronics Corp.
- ZF Friedrichshafen AG
第16章 付録
The supercomputer market is forecasted to grow by USD 39788.6 mn during 2024-2029, accelerating at a CAGR of 28.4% during the forecast period. The report on the supercomputer market provides a holistic analysis, market size and forecast, trends, growth drivers, and challenges, as well as vendor analysis covering around 25 vendors.
The report offers an up-to-date analysis regarding the current market scenario, the latest trends and drivers, and the overall market environment. The market is driven by commercial customers increasingly adopting supercomputing systems, increasing utilization of big data analytics, and high demand from government sector owing to national security concerns.
| Market Scope | |
|---|---|
| Base Year | 2025 |
| End Year | 2029 |
| Series Year | 2025-2029 |
| Growth Momentum | Accelerate |
| YOY 2025 | 22.2% |
| CAGR | 28.4% |
| Incremental Value | $39788.6 mn |
Technavio's supercomputer market is segmented as below:
By OS
- Linux
- UNIX
- Mixed
- Windows
By End-user
- Government entities
- Scientific research and academic institutions
- Commercial industries
By Processor Type
- Intel
- IBM (Power)
- AMD
- Others
By Geographical Landscape
- APAC
- North America
- Europe
- South America
- Middle East and Africa
This study identifies the growing use of cloud as one of the prime reasons driving the supercomputer market growth during the next few years. Also, software issues affecting performance and focus on energy-efficient supercomputing will lead to sizable demand in the market.
The report on the supercomputer market covers the following areas:
- Supercomputer Market sizing
- Supercomputer Market forecast
- Supercomputer Market industry analysis
The robust vendor analysis is designed to help clients improve their market position, and in line with this, this report provides a detailed analysis of several leading supercomputer market vendors that include Advanced Micro Devices Inc., Apple Inc., ASUSTeK Computer Inc., Atos SE, Cerebras, CoreWeave, Dell Technologies Inc., Ford Motor Co., Fujitsu Ltd., Hewlett Packard Enterprise Co., Hitachi Ltd., Intel Corp., International Business Machines Corp., Lenovo Group Ltd., Meta Platforms Inc., Microsoft Corp., NVIDIA Corp., Renesas Electronics Corp., Robert Bosch GmbH, and ZF Friedrichshafen AG. Also, the supercomputer market analysis report includes information on upcoming trends and challenges that will influence market growth. This is to help companies strategize and leverage all forthcoming growth opportunities.
The study was conducted using an objective combination of primary and secondary information including inputs from key participants in the industry. The report contains a comprehensive market and vendor landscape in addition to an analysis of the key vendors.
The publisher presents a detailed picture of the market by the way of study, synthesis, and summation of data from multiple sources by an analysis of key parameters such as profit, pricing, competition, and promotions. It presents various market facets by identifying the key industry influencers. The data presented is comprehensive, reliable, and a result of extensive primary and secondary research. The market research reports provide a complete competitive landscape and an in-depth vendor selection methodology and analysis using qualitative and quantitative research to forecast accurate market growth.
Table of Contents
1 Executive Summary
- 1.1 Market overview
- Executive Summary - Chart on Market Overview
- Executive Summary - Data Table on Market Overview
- Executive Summary - Chart on Global Market Characteristics
- Executive Summary - Chart on Market By Geographical Landscape
- Executive Summary - Chart on Market Segmentation by OS
- Executive Summary - Chart on Market Segmentation by End-user
- Executive Summary - Chart on Market Segmentation by Processor Type
- Executive Summary - Chart on Incremental Growth
- Executive Summary - Data Table on Incremental Growth
- Executive Summary - Chart on Company Market Positioning
2 Technavio Analysis
- 2.1 Analysis of price sensitivity, lifecycle, customer purchase basket, adoption rates, and purchase criteria
- Analysis of price sensitivity, lifecycle, customer purchase basket, adoption rates, and purchase criteria
- 2.2 Criticality of inputs and Factors of differentiation
- Overview on criticality of inputs and factors of differentiation
- 2.3 Factors of disruption
- Overview on factors of disruption
- 2.4 Impact of drivers and challenges
- Impact of drivers and challenges in 2024 and 2029
3 Market Landscape
- 3.1 Market ecosystem
- Parent Market
- Data Table on - Parent Market
- 3.2 Market characteristics
- Market characteristics analysis
- 3.3 Value chain analysis
- Value chain analysis
4 Market Sizing
- 4.1 Market definition
- Offerings of companies included in the market definition
- 4.2 Market segment analysis
- Market segments
- 4.3 Market size 2024
- 4.4 Market outlook: Forecast for 2024-2029
- Chart on Global - Market size and forecast 2024-2029 ($ million)
- Data Table on Global - Market size and forecast 2024-2029 ($ million)
- Chart on Global Market: Year-over-year growth 2024-2029 (%)
- Data Table on Global Market: Year-over-year growth 2024-2029 (%)
5 Historic Market Size
- 5.1 Global Supercomputer Market 2019 - 2023
- Historic Market Size - Data Table on Global Supercomputer Market 2019 - 2023 ($ million)
- 5.2 OS segment analysis 2019 - 2023
- Historic Market Size - OS Segment 2019 - 2023 ($ million)
- 5.3 End-user segment analysis 2019 - 2023
- Historic Market Size - End-user Segment 2019 - 2023 ($ million)
- 5.4 Processor Type segment analysis 2019 - 2023
- Historic Market Size - Processor Type Segment 2019 - 2023 ($ million)
- 5.5 Geography segment analysis 2019 - 2023
- Historic Market Size - Geography Segment 2019 - 2023 ($ million)
- 5.6 Country segment analysis 2019 - 2023
- Historic Market Size - Country Segment 2019 - 2023 ($ million)
6 Qualitative Analysis
- 6.1 Impact of AI in global supercomputer market
7 Five Forces Analysis
- 7.1 Five forces summary
- Five forces analysis - Comparison between 2024 and 2029
- 7.2 Bargaining power of buyers
- Bargaining power of buyers - Impact of key factors 2024 and 2029
- 7.3 Bargaining power of suppliers
- Bargaining power of suppliers - Impact of key factors in 2024 and 2029
- 7.4 Threat of new entrants
- Threat of new entrants - Impact of key factors in 2024 and 2029
- 7.5 Threat of substitutes
- Threat of substitutes - Impact of key factors in 2024 and 2029
- 7.6 Threat of rivalry
- Threat of rivalry - Impact of key factors in 2024 and 2029
- 7.7 Market condition
- Chart on Market condition - Five forces 2024 and 2029
8 Market Segmentation by OS
- 8.1 Market segments
- Chart on OS - Market share 2024-2029 (%)
- Data Table on OS - Market share 2024-2029 (%)
- 8.2 Comparison by OS
- Chart on Comparison by OS
- Data Table on Comparison by OS
- 8.3 Linux - Market size and forecast 2024-2029
- Chart on Linux - Market size and forecast 2024-2029 ($ million)
- Data Table on Linux - Market size and forecast 2024-2029 ($ million)
- Chart on Linux - Year-over-year growth 2024-2029 (%)
- Data Table on Linux - Year-over-year growth 2024-2029 (%)
- 8.4 UNIX - Market size and forecast 2024-2029
- Chart on UNIX - Market size and forecast 2024-2029 ($ million)
- Data Table on UNIX - Market size and forecast 2024-2029 ($ million)
- Chart on UNIX - Year-over-year growth 2024-2029 (%)
- Data Table on UNIX - Year-over-year growth 2024-2029 (%)
- 8.5 Mixed - Market size and forecast 2024-2029
- Chart on Mixed - Market size and forecast 2024-2029 ($ million)
- Data Table on Mixed - Market size and forecast 2024-2029 ($ million)
- Chart on Mixed - Year-over-year growth 2024-2029 (%)
- Data Table on Mixed - Year-over-year growth 2024-2029 (%)
- 8.6 Windows - Market size and forecast 2024-2029
- Chart on Windows - Market size and forecast 2024-2029 ($ million)
- Data Table on Windows - Market size and forecast 2024-2029 ($ million)
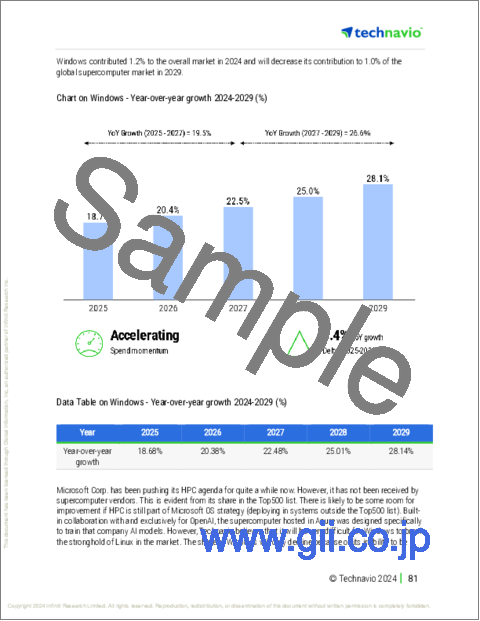
- Chart on Windows - Year-over-year growth 2024-2029 (%)
- Data Table on Windows - Year-over-year growth 2024-2029 (%)
- 8.7 Market opportunity by OS
- Market opportunity by OS ($ million)
- Data Table on Market opportunity by OS ($ million)
9 Market Segmentation by End-user
- 9.1 Market segments
- Chart on End-user - Market share 2024-2029 (%)
- Data Table on End-user - Market share 2024-2029 (%)
- 9.2 Comparison by End-user
- Chart on Comparison by End-user
- Data Table on Comparison by End-user
- 9.3 Government entities - Market size and forecast 2024-2029
- Chart on Government entities - Market size and forecast 2024-2029 ($ million)
- Data Table on Government entities - Market size and forecast 2024-2029 ($ million)
- Chart on Government entities - Year-over-year growth 2024-2029 (%)
- Data Table on Government entities - Year-over-year growth 2024-2029 (%)
- 9.4 Scientific research and academic institutions - Market size and forecast 2024-2029
- Chart on Scientific research and academic institutions - Market size and forecast 2024-2029 ($ million)
- Data Table on Scientific research and academic institutions - Market size and forecast 2024-2029 ($ million)
- Chart on Scientific research and academic institutions - Year-over-year growth 2024-2029 (%)
- Data Table on Scientific research and academic institutions - Year-over-year growth 2024-2029 (%)
- 9.5 Commercial industries - Market size and forecast 2024-2029
- Chart on Commercial industries - Market size and forecast 2024-2029 ($ million)
- Data Table on Commercial industries - Market size and forecast 2024-2029 ($ million)
- Chart on Commercial industries - Year-over-year growth 2024-2029 (%)
- Data Table on Commercial industries - Year-over-year growth 2024-2029 (%)
- 9.6 Market opportunity by End-user
- Market opportunity by End-user ($ million)
- Data Table on Market opportunity by End-user ($ million)
10 Market Segmentation by Processor Type
- 10.1 Market segments
- Chart on Processor Type - Market share 2024-2029 (%)
- Data Table on Processor Type - Market share 2024-2029 (%)
- 10.2 Comparison by Processor Type
- Chart on Comparison by Processor Type
- Data Table on Comparison by Processor Type
- 10.3 Intel - Market size and forecast 2024-2029
- Chart on Intel - Market size and forecast 2024-2029 ($ million)
- Data Table on Intel - Market size and forecast 2024-2029 ($ million)
- Chart on Intel - Year-over-year growth 2024-2029 (%)
- Data Table on Intel - Year-over-year growth 2024-2029 (%)
- 10.4 IBM (Power) - Market size and forecast 2024-2029
- Chart on IBM (Power) - Market size and forecast 2024-2029 ($ million)
- Data Table on IBM (Power) - Market size and forecast 2024-2029 ($ million)
- Chart on IBM (Power) - Year-over-year growth 2024-2029 (%)
- Data Table on IBM (Power) - Year-over-year growth 2024-2029 (%)
- 10.5 AMD - Market size and forecast 2024-2029
- Chart on AMD - Market size and forecast 2024-2029 ($ million)
- Data Table on AMD - Market size and forecast 2024-2029 ($ million)
- Chart on AMD - Year-over-year growth 2024-2029 (%)
- Data Table on AMD - Year-over-year growth 2024-2029 (%)
- 10.6 Others - Market size and forecast 2024-2029
- Chart on Others - Market size and forecast 2024-2029 ($ million)
- Data Table on Others - Market size and forecast 2024-2029 ($ million)
- Chart on Others - Year-over-year growth 2024-2029 (%)
- Data Table on Others - Year-over-year growth 2024-2029 (%)
- 10.7 Market opportunity by Processor Type
- Market opportunity by Processor Type ($ million)
- Data Table on Market opportunity by Processor Type ($ million)
11 Customer Landscape
- 11.1 Customer landscape overview
- Analysis of price sensitivity, lifecycle, customer purchase basket, adoption rates, and purchase criteria
12 Geographic Landscape
- 12.1 Geographic segmentation
- Chart on Market share By Geographical Landscape 2024-2029 (%)
- Data Table on Market share By Geographical Landscape 2024-2029 (%)
- 12.2 Geographic comparison
- Chart on Geographic comparison
- Data Table on Geographic comparison
- 12.3 APAC - Market size and forecast 2024-2029
- Chart on APAC - Market size and forecast 2024-2029 ($ million)
- Data Table on APAC - Market size and forecast 2024-2029 ($ million)
- Chart on APAC - Year-over-year growth 2024-2029 (%)
- Data Table on APAC - Year-over-year growth 2024-2029 (%)
- 12.4 North America - Market size and forecast 2024-2029
- Chart on North America - Market size and forecast 2024-2029 ($ million)
- Data Table on North America - Market size and forecast 2024-2029 ($ million)
- Chart on North America - Year-over-year growth 2024-2029 (%)
- Data Table on North America - Year-over-year growth 2024-2029 (%)
- 12.5 Europe - Market size and forecast 2024-2029
- Chart on Europe - Market size and forecast 2024-2029 ($ million)
- Data Table on Europe - Market size and forecast 2024-2029 ($ million)
- Chart on Europe - Year-over-year growth 2024-2029 (%)
- Data Table on Europe - Year-over-year growth 2024-2029 (%)
- 12.6 South America - Market size and forecast 2024-2029
- Chart on South America - Market size and forecast 2024-2029 ($ million)
- Data Table on South America - Market size and forecast 2024-2029 ($ million)
- Chart on South America - Year-over-year growth 2024-2029 (%)
- Data Table on South America - Year-over-year growth 2024-2029 (%)
- 12.7 Middle East and Africa - Market size and forecast 2024-2029
- Chart on Middle East and Africa - Market size and forecast 2024-2029 ($ million)
- Data Table on Middle East and Africa - Market size and forecast 2024-2029 ($ million)
- Chart on Middle East and Africa - Year-over-year growth 2024-2029 (%)
- Data Table on Middle East and Africa - Year-over-year growth 2024-2029 (%)
- 12.8 US - Market size and forecast 2024-2029
- Chart on US - Market size and forecast 2024-2029 ($ million)
- Data Table on US - Market size and forecast 2024-2029 ($ million)
- Chart on US - Year-over-year growth 2024-2029 (%)
- Data Table on US - Year-over-year growth 2024-2029 (%)
- 12.9 China - Market size and forecast 2024-2029
- Chart on China - Market size and forecast 2024-2029 ($ million)
- Data Table on China - Market size and forecast 2024-2029 ($ million)
- Chart on China - Year-over-year growth 2024-2029 (%)
- Data Table on China - Year-over-year growth 2024-2029 (%)
- 12.10 Japan - Market size and forecast 2024-2029
- Chart on Japan - Market size and forecast 2024-2029 ($ million)
- Data Table on Japan - Market size and forecast 2024-2029 ($ million)
- Chart on Japan - Year-over-year growth 2024-2029 (%)
- Data Table on Japan - Year-over-year growth 2024-2029 (%)
- 12.11 India - Market size and forecast 2024-2029
- Chart on India - Market size and forecast 2024-2029 ($ million)
- Data Table on India - Market size and forecast 2024-2029 ($ million)
- Chart on India - Year-over-year growth 2024-2029 (%)
- Data Table on India - Year-over-year growth 2024-2029 (%)
- 12.12 Canada - Market size and forecast 2024-2029
- Chart on Canada - Market size and forecast 2024-2029 ($ million)
- Data Table on Canada - Market size and forecast 2024-2029 ($ million)
- Chart on Canada - Year-over-year growth 2024-2029 (%)
- Data Table on Canada - Year-over-year growth 2024-2029 (%)
- 12.13 France - Market size and forecast 2024-2029
- Chart on France - Market size and forecast 2024-2029 ($ million)
- Data Table on France - Market size and forecast 2024-2029 ($ million)
- Chart on France - Year-over-year growth 2024-2029 (%)
- Data Table on France - Year-over-year growth 2024-2029 (%)
- 12.14 UK - Market size and forecast 2024-2029
- Chart on UK - Market size and forecast 2024-2029 ($ million)
- Data Table on UK - Market size and forecast 2024-2029 ($ million)
- Chart on UK - Year-over-year growth 2024-2029 (%)
- Data Table on UK - Year-over-year growth 2024-2029 (%)
- 12.15 Germany - Market size and forecast 2024-2029
- Chart on Germany - Market size and forecast 2024-2029 ($ million)
- Data Table on Germany - Market size and forecast 2024-2029 ($ million)
- Chart on Germany - Year-over-year growth 2024-2029 (%)
- Data Table on Germany - Year-over-year growth 2024-2029 (%)
- 12.16 Brazil - Market size and forecast 2024-2029
- Chart on Brazil - Market size and forecast 2024-2029 ($ million)
- Data Table on Brazil - Market size and forecast 2024-2029 ($ million)
- Chart on Brazil - Year-over-year growth 2024-2029 (%)
- Data Table on Brazil - Year-over-year growth 2024-2029 (%)
- 12.17 Spain - Market size and forecast 2024-2029
- Chart on Spain - Market size and forecast 2024-2029 ($ million)
- Data Table on Spain - Market size and forecast 2024-2029 ($ million)
- Chart on Spain - Year-over-year growth 2024-2029 (%)
- Data Table on Spain - Year-over-year growth 2024-2029 (%)
- 12.18 Market opportunity By Geographical Landscape
- Market opportunity By Geographical Landscape ($ million)
- Data Tables on Market opportunity By Geographical Landscape ($ million)
13 Drivers, Challenges, and Opportunity/Restraints
- 13.1 Market drivers
- 13.2 Market challenges
- 13.3 Impact of drivers and challenges
- Impact of drivers and challenges in 2024 and 2029
- 13.4 Market opportunities/restraints
14 Competitive Landscape
- 14.1 Overview
- 14.2 Competitive Landscape
- Overview on criticality of inputs and factors of differentiation
- 14.3 Landscape disruption
- Overview on factors of disruption
- 14.4 Industry risks
- Impact of key risks on business
15 Competitive Analysis
- 15.1 Companies profiled
- Companies covered
- 15.2 Company ranking index
- Company ranking index
- 15.3 Market positioning of companies
- Matrix on companies position and classification
- 15.4 Advanced Micro Devices Inc.
- Advanced Micro Devices Inc. - Overview
- Advanced Micro Devices Inc. - Business segments
- Advanced Micro Devices Inc. - Key news
- Advanced Micro Devices Inc. - Key offerings
- Advanced Micro Devices Inc. - Segment focus
- SWOT
- 15.5 Apple Inc.
- Apple Inc. - Overview
- Apple Inc. - Business segments
- Apple Inc. - Key news
- Apple Inc. - Key offerings
- Apple Inc. - Segment focus
- SWOT
- 15.6 Atos SE
- Atos SE - Overview
- Atos SE - Business segments
- Atos SE - Key news
- Atos SE - Key offerings
- Atos SE - Segment focus
- SWOT
- 15.7 Dell Technologies Inc.
- Dell Technologies Inc. - Overview
- Dell Technologies Inc. - Business segments
- Dell Technologies Inc. - Key news
- Dell Technologies Inc. - Key offerings
- Dell Technologies Inc. - Segment focus
- SWOT
- 15.8 Ford Motor Co.
- Ford Motor Co. - Overview
- Ford Motor Co. - Business segments
- Ford Motor Co. - Key offerings
- Ford Motor Co. - Segment focus
- SWOT
- 15.9 Fujitsu Ltd.
- Fujitsu Ltd. - Overview
- Fujitsu Ltd. - Business segments
- Fujitsu Ltd. - Key news
- Fujitsu Ltd. - Key offerings
- Fujitsu Ltd. - Segment focus
- SWOT
- 15.10 Hewlett Packard Enterprise Co.
- Hewlett Packard Enterprise Co. - Overview
- Hewlett Packard Enterprise Co. - Business segments
- Hewlett Packard Enterprise Co. - Key news
- Hewlett Packard Enterprise Co. - Key offerings
- Hewlett Packard Enterprise Co. - Segment focus
- SWOT
- 15.11 Hitachi Ltd.
- Hitachi Ltd. - Overview
- Hitachi Ltd. - Business segments
- Hitachi Ltd. - Key news
- Hitachi Ltd. - Key offerings
- Hitachi Ltd. - Segment focus
- SWOT
- 15.12 Intel Corp.
- Intel Corp. - Overview
- Intel Corp. - Business segments
- Intel Corp. - Key news
- Intel Corp. - Key offerings
- Intel Corp. - Segment focus
- SWOT
- 15.13 International Business Machines Corp.
- International Business Machines Corp. - Overview
- International Business Machines Corp. - Business segments
- International Business Machines Corp. - Key news
- International Business Machines Corp. - Key offerings
- International Business Machines Corp. - Segment focus
- SWOT
- 15.14 Lenovo Group Ltd.
- Lenovo Group Ltd. - Overview
- Lenovo Group Ltd. - Business segments
- Lenovo Group Ltd. - Key news
- Lenovo Group Ltd. - Key offerings
- Lenovo Group Ltd. - Segment focus
- SWOT
- 15.15 Microsoft Corp.
- Microsoft Corp. - Overview
- Microsoft Corp. - Business segments
- Microsoft Corp. - Key news
- Microsoft Corp. - Key offerings
- Microsoft Corp. - Segment focus
- SWOT
- 15.16 NVIDIA Corp.
- NVIDIA Corp. - Overview
- NVIDIA Corp. - Business segments
- NVIDIA Corp. - Key news
- NVIDIA Corp. - Key offerings
- NVIDIA Corp. - Segment focus
- SWOT
- 15.17 Renesas Electronics Corp.
- Renesas Electronics Corp. - Overview
- Renesas Electronics Corp. - Business segments
- Renesas Electronics Corp. - Key news
- Renesas Electronics Corp. - Key offerings
- Renesas Electronics Corp. - Segment focus
- SWOT
- 15.18 ZF Friedrichshafen AG
- ZF Friedrichshafen AG - Overview
- ZF Friedrichshafen AG - Business segments
- ZF Friedrichshafen AG - Key news
- ZF Friedrichshafen AG - Key offerings
- ZF Friedrichshafen AG - Segment focus
- SWOT
16 Appendix
- 16.1 Scope of the report
- 16.2 Inclusions and exclusions checklist
- Inclusions checklist
- Exclusions checklist
- 16.3 Currency conversion rates for US$
- Currency conversion rates for US$
- 16.4 Research methodology
- Research methodology
- 16.5 Data procurement
- Information sources
- 16.6 Data validation
- Data validation
- 16.7 Validation techniques employed for market sizing
- Validation techniques employed for market sizing
- 16.8 Data synthesis
- Data synthesis
- 16.9 360 degree market analysis
- 360 degree market analysis
- 16.10 List of abbreviations
- List of abbreviations

