|
|
市場調査レポート
商品コード
1937246
勃起不全(ED)治療薬の世界市場 2026年~2030年Global Erectile Dysfunction (ED) Drugs Market 2026-2030 |
||||||
|
|||||||
カスタマイズ可能
|
|||||||

| 勃起不全(ED)治療薬の世界市場 2026年~2030年 |
|
出版日: 2026年02月11日
発行: TechNavio
ページ情報: 英文 296 Pages
納期: 即納可能
|

概要
世界の勃起不全(ED)治療薬市場は、2025年から2030年にかけて17億5,650万米ドルの成長が見込まれており、予測期間中のCAGRは7.1%と予測されています。
本報告書は、世界の勃起不全(ED)治療薬市場に関する包括的な分析、市場規模と予測、動向、成長要因、課題、ならびに約25社のベンダー分析を提供します。
本レポートは、現在の市場状況、最新の動向と促進要因、市場環境全般に関する最新の分析を提供します。市場は、勃起不全治療薬への需要増加、勃起不全治療薬に対する認知度向上、勃起不全を引き起こす疾患の高い有病率によって牽引されています。
本調査は、業界の主要関係者からの情報を含む、一次情報と二次情報の客観的な組み合わせを用いて実施されました。本レポートには、主要企業の分析に加え、包括的な市場規模データ、地域別分析を伴うセグメント、ベンダー情勢が含まれています。レポートには過去データと予測データが掲載されています。
| 市場範囲 | |
|---|---|
| 基準年 | 2026年 |
| 終了年 | 2030年 |
| 予測期間 | 2026-2030 |
| 成長モメンタム | 加速 |
| 前年比2026年 | 6.5% |
| CAGR | 7.1% |
| 増分額 | 17億5,650万米ドル |
本調査では、開発後期段階にある新規薬剤製剤の存在が、今後数年間における世界の勃起不全(ED)治療薬市場成長を牽引する主要な要因の一つであると特定しております。また、新規治療法開発に向けた研究開発の拡大や、市販薬の乱用増加が、市場における相当な需要につながると見込まれます。
目次
第1章 エグゼクティブサマリー
第2章 Technavio分析
- 価格・ライフサイクル・顧客購入バスケット・採用率・購入基準の分析
- インプットの重要性と差別化の要因
- 混乱の要因
- 促進要因と課題の影響
第3章 市場情勢
- 市場エコシステム
- 市場の特徴
- バリューチェーン分析
第4章 市場規模
- 市場の定義
- 市場セグメント分析
- 市場規模 2025
- 市場の見通し 2025-2030
第5章 市場規模実績
- 勃起不全(ED)治療薬の世界市場 2020-2024
- 流通チャネルセグメント分析 2020-2024
- 製品セグメント分析 2020-2024
- タイプセグメント分析 2020-2024
- 地域別セグメント分析 2020-2024
- 国別セグメント分析 2020-2024
第6章 定性分析
- 人工知能がED治療薬市場に与える影響勃起不全(ED)治療薬の世界市場
第7章 ファイブフォース分析
- ファイブフォースの要約
- 買い手の交渉力
- 供給企業の交渉力
- 新規参入業者の脅威
- 代替品の脅威
- 競争の脅威
- 市況
第8章 市場セグメンテーション:流通チャネル別
- 比較:流通チャネル別
- 病院薬局
- 小売薬局
- オンライン薬局
- 市場機会:流通チャネル別
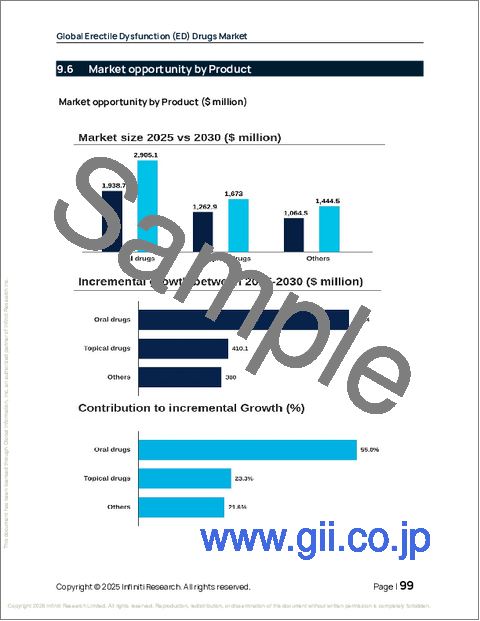
第9章 市場セグメンテーション:製品別
- 比較:製品別
- 経口薬
- 外用薬
- その他
- 市場機会:製品別
第10章 市場セグメンテーション:タイプ別
- 比較:タイプ別
- シルデナフィル
- タダラフィル
- バルデナフィル
- アバナフィル
- その他
- 市場機会:タイプ別
第11章 顧客情勢
第12章 地域別情勢
- 地域別セグメンテーション
- 地域別比較
- 北米
- 米国
- カナダ
- メキシコ
- 欧州
- 英国
- ドイツ
- フランス
- イタリア
- スペイン
- オランダ
- ロシア
- アジア
- 中国
- 日本
- インド
- 韓国
- インドネシア
- タイ
- シンガポール
- 世界のその他の地域
- オーストラリア
- ブラジル
- アラブ首長国連邦
- 南アフリカ
- サウジアラビア
- トルコ
- 市場機会:地域別
第13章 促進要因・課題・機会
- 市場促進要因
- 市場の課題
- 促進要因と課題の影響
- 市場機会
第14章 競合情勢
- 概要
- 競合情勢
- 混乱の状況
- 業界のリスク
第15章 競合分析
- 企業プロファイル
- 企業ランキング指標
- 企業の市場ポジショニング
- A. Menarini Industrie Farma
- Aseric Pharma
- Aurobindo Pharma Ltd.
- Bayer AG
- Cipla Inc.
- Dong A Socio Holdings Co. Ltd.
- Dr. Reddys Laboratories Ltd.
- Eli Lilly and Co.
- Lupin Ltd.
- Nippon Shinyaku Co. Ltd.
- Pfizer Inc.
- Sandoz Group AG
- Sanofi SA
- SK Chemicals Co. Ltd.
- Sun Pharmaceutical Industries
