|
|
市場調査レポート
商品コード
1792218
世界の生成AIサイバーセキュリティ市場、2025年~2029年Global Generative AI Cybersecurity Market 2025-2029 |
||||||

|
|||||||
カスタマイズ可能
|
|||||||


| 世界の生成AIサイバーセキュリティ市場、2025年~2029年 |
|
出版日: 2025年08月08日
発行: TechNavio
ページ情報: 英文 261 Pages
納期: 即納可能
|

全表示
- 概要
- 図表
- 目次
生成AIサイバーセキュリティ市場は2024年~2029年に116億770万米ドル拡大し、予測期間中のCAGRは35.4%で成長すると予測されます。
当レポートでは、生成AIサイバーセキュリティ市場の全体的な分析、市場規模・予測、動向、成長促進要因、課題、約25のベンダーを網羅したベンダー分析などを掲載しています。
現在の市場シナリオ、最新動向と促進要因、市場環境全体に関する最新分析を提供しています。市場を牽引しているのは、AIを増強したサイバー脅威の急増、規制当局の監視強化とAIガバナンスの必要性、生成型AIの広範な企業統合とそれに伴う攻撃対象の拡大などです。
| 市場範囲 | |
|---|---|
| 基準年 | 2025年 |
| 終了年 | 2029年 |
| 予測期間 | 2025年~2029年 |
| 成長モメンタム | 加速 |
| 前年比 | 30.1% |
| CAGR | 35.4% |
| 増分額 | 116億770万米ドル |
本調査は、業界の主要参加者からのインプットを含め、一次情報と二次情報を客観的に組み合わせて実施しました。レポートには、主要企業の分析に加え、包括的な市場規模データ、地域分析によるセグメント、ベンダー情勢が含まれています。レポートには過去データと予測データがあります。
本調査では、AIに特化したガバナンス、リスク、コンプライアンスプラットフォームの普及が、今後数年間の生成AIサイバーセキュリティ市場の成長を促進する主要な理由の1つであると指摘しています。また、サービスとしての敵対的AIシミュレーションやレッドチーミングの出現、脅威防御強化のためのセキュリティ運用へのジェネレーティブAIの統合は、市場の大きな需要につながります。
目次
第1章 エグゼクティブサマリー
- 市場概要
第2章 Technavio分析
- 価格・ライフサイクル・顧客購入バスケット・採用率・購入基準の分析
- インプットの重要性と差別化の要因
- 混乱の要因
- 促進要因と課題の影響
第3章 市場情勢
- 市場エコシステム
- 市場の特徴
- バリューチェーン分析
第4章 市場規模
- 市場の定義
- 市場セグメント分析
- 市場規模、2024年
- 市場の見通し、2024年~2029年
第5章 ファイブフォース分析
- ファイブフォースの要約
- 買い手の交渉力
- 供給企業の交渉力
- 新規参入業者の脅威
- 代替品の脅威
- 競争の脅威
- 市況
第6章 市場セグメンテーション:コンポーネント別
- 市場セグメント
- 比較:コンポーネント別
- ソフトウェア:市場規模と予測、2024年~2029年
- サービス:市場規模と予測、2024年~2029年
- 市場機会:コンポーネント別
第7章 市場セグメンテーション:タイプ別
- 市場セグメント
- 比較:タイプ別
- ネットワークセキュリティ:市場規模と予測、2024年~2029年
- 脅威の検出と分析:市場規模と予測、2024年~2029年
- 敵対的防御:市場規模と予測、2024年~2029年
- 内部脅威検出:市場規模と予測、2024年~2029年
- その他:市場規模と予測、2024年~2029年
- 市場機会:タイプ別
第8章 市場セグメンテーション:技術別
- 市場セグメント
- 比較:技術別
- GAN:市場規模と予測、2024年~2029年
- DNN:市場規模と予測、2024年~2029年
- VAEs:市場規模と予測、2024年~2029年
- 強化学習:市場規模と予測、2024年~2029年
- その他:市場規模と予測、2024年~2029年
- 市場機会:技術別
第9章 市場セグメンテーション:エンドユーザー別
- 市場セグメント
- 比較:エンドユーザー別
- BFSI:市場規模と予測、2024年~2029年
- 小売業とeコマース:市場規模と予測、2024年~2029年
- 政府と防衛:市場規模と予測、2024年~2029年
- ヘルスケアとライフサイエンス:市場規模と予測、2024年~2029年
- その他:市場規模と予測、2024年~2029年
- 市場機会:エンドユーザー別
第10章 顧客情勢
- 顧客情勢の概要
第11章 地域情勢
- 地域別セグメンテーション
- 地域別比較
- 北米:市場規模と予測、2024年~2029年
- 欧州:市場規模と予測、2024年~2029年
- アジア太平洋:市場規模と予測、2024年~2029年
- 南米:市場規模と予測、2024年~2029年
- 中東・アフリカ:市場規模と予測、2024年~2029年
- 米国:市場規模と予測、2024年~2029年
- カナダ:市場規模と予測、2024年~2029年
- 英国:市場規模と予測、2024年~2029年
- ドイツ:市場規模と予測、2024年~2029年
- フランス:市場規模と予測、2024年~2029年
- 中国:市場規模と予測、2024年~2029年
- インド:市場規模と予測、2024年~2029年
- 日本:市場規模と予測、2024年~2029年
- オーストラリア:市場規模と予測、2024年~2029年
- ブラジル:市場規模と予測、2024年~2029年
- 市場機会:地域情勢別
第12章 促進要因・課題・機会・抑制要因
- 市場促進要因
- 市場の課題
- 促進要因と課題の影響
- 市場の機会・抑制要因
第13章 競合情勢
- 概要
- 競合情勢
- 混乱の状況
- 業界のリスク
第14章 競合分析
- 企業プロファイル
- 企業ランキング指数
- 企業の市場ポジショニング
- Accenture PLC
- Amazon Web Services Inc.
- Check Point Software Technologies Ltd.
- Cisco Systems Inc.
- Cloudflare Inc.
- CrowdStrike Inc.
- Darktrace Holdings Ltd.
- Fortinet Inc.
- Google LLC
- International Business Machines Corp.
- Microsoft Corp.
- NVIDIA Corp.
- Palo Alto Networks Inc.
- SENTINELONE Inc.
- Splunk Inc.
第15章 付録
Exhibits:
- Exhibits1: Executive Summary - Chart on Market Overview
- Exhibits2: Executive Summary - Data Table on Market Overview
- Exhibits3: Executive Summary - Chart on Global Market Characteristics
- Exhibits4: Executive Summary - Chart on Market By Geographical Landscape
- Exhibits5: Executive Summary - Chart on Market Segmentation by Component
- Exhibits6: Executive Summary - Chart on Market Segmentation by Type
- Exhibits7: Executive Summary - Chart on Market Segmentation by Technology
- Exhibits8: Executive Summary - Chart on Market Segmentation by End-user
- Exhibits9: Executive Summary - Chart on Incremental Growth
- Exhibits10: Executive Summary - Data Table on Incremental Growth
- Exhibits11: Executive Summary - Chart on Company Market Positioning
- Exhibits12: Analysis of price sensitivity, lifecycle, customer purchase basket, adoption rates, and purchase criteria
- Exhibits13: Overview on criticality of inputs and factors of differentiation
- Exhibits14: Overview on factors of disruption
- Exhibits15: Impact of drivers and challenges in 2024 and 2029
- Exhibits16: Parent Market
- Exhibits17: Data Table on - Parent Market
- Exhibits18: Market characteristics analysis
- Exhibits19: Value chain analysis
- Exhibits20: Offerings of companies included in the market definition
- Exhibits21: Market segments
- Exhibits22: Chart on Global - Market size and forecast 2024-2029 ($ million)
- Exhibits23: Data Table on Global - Market size and forecast 2024-2029 ($ million)
- Exhibits24: Chart on Global Market: Year-over-year growth 2024-2029 (%)
- Exhibits25: Data Table on Global Market: Year-over-year growth 2024-2029 (%)
- Exhibits26: Five forces analysis - Comparison between 2024 and 2029
- Exhibits27: Bargaining power of buyers - Impact of key factors 2024 and 2029
- Exhibits28: Bargaining power of suppliers - Impact of key factors in 2024 and 2029
- Exhibits29: Threat of new entrants - Impact of key factors in 2024 and 2029
- Exhibits30: Threat of substitutes - Impact of key factors in 2024 and 2029
- Exhibits31: Threat of rivalry - Impact of key factors in 2024 and 2029
- Exhibits32: Chart on Market condition - Five forces 2024 and 2029
- Exhibits33: Chart on Component - Market share 2024-2029 (%)
- Exhibits34: Data Table on Component - Market share 2024-2029 (%)
- Exhibits35: Chart on Comparison by Component
- Exhibits36: Data Table on Comparison by Component
- Exhibits37: Chart on Software - Market size and forecast 2024-2029 ($ million)
- Exhibits38: Data Table on Software - Market size and forecast 2024-2029 ($ million)
- Exhibits39: Chart on Software - Year-over-year growth 2024-2029 (%)
- Exhibits40: Data Table on Software - Year-over-year growth 2024-2029 (%)
- Exhibits41: Chart on Services - Market size and forecast 2024-2029 ($ million)
- Exhibits42: Data Table on Services - Market size and forecast 2024-2029 ($ million)
- Exhibits43: Chart on Services - Year-over-year growth 2024-2029 (%)
- Exhibits44: Data Table on Services - Year-over-year growth 2024-2029 (%)
- Exhibits45: Market opportunity by Component ($ million)
- Exhibits46: Data Table on Market opportunity by Component ($ million)
- Exhibits47: Chart on Type - Market share 2024-2029 (%)
- Exhibits48: Data Table on Type - Market share 2024-2029 (%)
- Exhibits49: Chart on Comparison by Type
- Exhibits50: Data Table on Comparison by Type
- Exhibits51: Chart on Network security - Market size and forecast 2024-2029 ($ million)
- Exhibits52: Data Table on Network security - Market size and forecast 2024-2029 ($ million)
- Exhibits53: Chart on Network security - Year-over-year growth 2024-2029 (%)
- Exhibits54: Data Table on Network security - Year-over-year growth 2024-2029 (%)
- Exhibits55: Chart on Threat detection and analysis - Market size and forecast 2024-2029 ($ million)
- Exhibits56: Data Table on Threat detection and analysis - Market size and forecast 2024-2029 ($ million)
- Exhibits57: Chart on Threat detection and analysis - Year-over-year growth 2024-2029 (%)
- Exhibits58: Data Table on Threat detection and analysis - Year-over-year growth 2024-2029 (%)
- Exhibits59: Chart on Adversarial defense - Market size and forecast 2024-2029 ($ million)
- Exhibits60: Data Table on Adversarial defense - Market size and forecast 2024-2029 ($ million)
- Exhibits61: Chart on Adversarial defense - Year-over-year growth 2024-2029 (%)
- Exhibits62: Data Table on Adversarial defense - Year-over-year growth 2024-2029 (%)
- Exhibits63: Chart on Insider threat detection - Market size and forecast 2024-2029 ($ million)
- Exhibits64: Data Table on Insider threat detection - Market size and forecast 2024-2029 ($ million)
- Exhibits65: Chart on Insider threat detection - Year-over-year growth 2024-2029 (%)
- Exhibits66: Data Table on Insider threat detection - Year-over-year growth 2024-2029 (%)
- Exhibits67: Chart on Others - Market size and forecast 2024-2029 ($ million)
- Exhibits68: Data Table on Others - Market size and forecast 2024-2029 ($ million)
- Exhibits69: Chart on Others - Year-over-year growth 2024-2029 (%)
- Exhibits70: Data Table on Others - Year-over-year growth 2024-2029 (%)
- Exhibits71: Market opportunity by Type ($ million)
- Exhibits72: Data Table on Market opportunity by Type ($ million)
- Exhibits73: Chart on Technology - Market share 2024-2029 (%)
- Exhibits74: Data Table on Technology - Market share 2024-2029 (%)
- Exhibits75: Chart on Comparison by Technology
- Exhibits76: Data Table on Comparison by Technology
- Exhibits77: Chart on GANs - Market size and forecast 2024-2029 ($ million)
- Exhibits78: Data Table on GANs - Market size and forecast 2024-2029 ($ million)
- Exhibits79: Chart on GANs - Year-over-year growth 2024-2029 (%)
- Exhibits80: Data Table on GANs - Year-over-year growth 2024-2029 (%)
- Exhibits81: Chart on DNNs - Market size and forecast 2024-2029 ($ million)
- Exhibits82: Data Table on DNNs - Market size and forecast 2024-2029 ($ million)
- Exhibits83: Chart on DNNs - Year-over-year growth 2024-2029 (%)
- Exhibits84: Data Table on DNNs - Year-over-year growth 2024-2029 (%)
- Exhibits85: Chart on VAEs - Market size and forecast 2024-2029 ($ million)
- Exhibits86: Data Table on VAEs - Market size and forecast 2024-2029 ($ million)
- Exhibits87: Chart on VAEs - Year-over-year growth 2024-2029 (%)
- Exhibits88: Data Table on VAEs - Year-over-year growth 2024-2029 (%)
- Exhibits89: Chart on Reinforcement learning - Market size and forecast 2024-2029 ($ million)
- Exhibits90: Data Table on Reinforcement learning - Market size and forecast 2024-2029 ($ million)
- Exhibits91: Chart on Reinforcement learning - Year-over-year growth 2024-2029 (%)
- Exhibits92: Data Table on Reinforcement learning - Year-over-year growth 2024-2029 (%)
- Exhibits93: Chart on Others - Market size and forecast 2024-2029 ($ million)
- Exhibits94: Data Table on Others - Market size and forecast 2024-2029 ($ million)
- Exhibits95: Chart on Others - Year-over-year growth 2024-2029 (%)
- Exhibits96: Data Table on Others - Year-over-year growth 2024-2029 (%)
- Exhibits97: Market opportunity by Technology ($ million)
- Exhibits98: Data Table on Market opportunity by Technology ($ million)
- Exhibits99: Chart on End-user - Market share 2024-2029 (%)
- Exhibits100: Data Table on End-user - Market share 2024-2029 (%)
- Exhibits101: Chart on Comparison by End-user
- Exhibits102: Data Table on Comparison by End-user
- Exhibits103: Chart on BFSI - Market size and forecast 2024-2029 ($ million)
- Exhibits104: Data Table on BFSI - Market size and forecast 2024-2029 ($ million)
- Exhibits105: Chart on BFSI - Year-over-year growth 2024-2029 (%)
- Exhibits106: Data Table on BFSI - Year-over-year growth 2024-2029 (%)
- Exhibits107: Chart on Retail and e-commerce - Market size and forecast 2024-2029 ($ million)
- Exhibits108: Data Table on Retail and e-commerce - Market size and forecast 2024-2029 ($ million)
- Exhibits109: Chart on Retail and e-commerce - Year-over-year growth 2024-2029 (%)
- Exhibits110: Data Table on Retail and e-commerce - Year-over-year growth 2024-2029 (%)
- Exhibits111: Chart on Government and defense - Market size and forecast 2024-2029 ($ million)
- Exhibits112: Data Table on Government and defense - Market size and forecast 2024-2029 ($ million)
- Exhibits113: Chart on Government and defense - Year-over-year growth 2024-2029 (%)
- Exhibits114: Data Table on Government and defense - Year-over-year growth 2024-2029 (%)
- Exhibits115: Chart on Healthcare and life sciences - Market size and forecast 2024-2029 ($ million)
- Exhibits116: Data Table on Healthcare and life sciences - Market size and forecast 2024-2029 ($ million)
- Exhibits117: Chart on Healthcare and life sciences - Year-over-year growth 2024-2029 (%)
- Exhibits118: Data Table on Healthcare and life sciences - Year-over-year growth 2024-2029 (%)
- Exhibits119: Chart on Others - Market size and forecast 2024-2029 ($ million)
- Exhibits120: Data Table on Others - Market size and forecast 2024-2029 ($ million)
- Exhibits121: Chart on Others - Year-over-year growth 2024-2029 (%)
- Exhibits122: Data Table on Others - Year-over-year growth 2024-2029 (%)
- Exhibits123: Market opportunity by End-user ($ million)
- Exhibits124: Data Table on Market opportunity by End-user ($ million)
- Exhibits125: Analysis of price sensitivity, lifecycle, customer purchase basket, adoption rates, and purchase criteria
- Exhibits126: Chart on Market share By Geographical Landscape 2024-2029 (%)
- Exhibits127: Data Table on Market share By Geographical Landscape 2024-2029 (%)
- Exhibits128: Chart on Geographic comparison
- Exhibits129: Data Table on Geographic comparison
- Exhibits130: Chart on North America - Market size and forecast 2024-2029 ($ million)
- Exhibits131: Data Table on North America - Market size and forecast 2024-2029 ($ million)
- Exhibits132: Chart on North America - Year-over-year growth 2024-2029 (%)
- Exhibits133: Data Table on North America - Year-over-year growth 2024-2029 (%)
- Exhibits134: Chart on Europe - Market size and forecast 2024-2029 ($ million)
- Exhibits135: Data Table on Europe - Market size and forecast 2024-2029 ($ million)
- Exhibits136: Chart on Europe - Year-over-year growth 2024-2029 (%)
- Exhibits137: Data Table on Europe - Year-over-year growth 2024-2029 (%)
- Exhibits138: Chart on APAC - Market size and forecast 2024-2029 ($ million)
- Exhibits139: Data Table on APAC - Market size and forecast 2024-2029 ($ million)
- Exhibits140: Chart on APAC - Year-over-year growth 2024-2029 (%)
- Exhibits141: Data Table on APAC - Year-over-year growth 2024-2029 (%)
- Exhibits142: Chart on South America - Market size and forecast 2024-2029 ($ million)
- Exhibits143: Data Table on South America - Market size and forecast 2024-2029 ($ million)
- Exhibits144: Chart on South America - Year-over-year growth 2024-2029 (%)
- Exhibits145: Data Table on South America - Year-over-year growth 2024-2029 (%)
- Exhibits146: Chart on Middle East and Africa - Market size and forecast 2024-2029 ($ million)
- Exhibits147: Data Table on Middle East and Africa - Market size and forecast 2024-2029 ($ million)
- Exhibits148: Chart on Middle East and Africa - Year-over-year growth 2024-2029 (%)
- Exhibits149: Data Table on Middle East and Africa - Year-over-year growth 2024-2029 (%)
- Exhibits150: Chart on US - Market size and forecast 2024-2029 ($ million)
- Exhibits151: Data Table on US - Market size and forecast 2024-2029 ($ million)
- Exhibits152: Chart on US - Year-over-year growth 2024-2029 (%)
- Exhibits153: Data Table on US - Year-over-year growth 2024-2029 (%)
- Exhibits154: Chart on Canada - Market size and forecast 2024-2029 ($ million)
- Exhibits155: Data Table on Canada - Market size and forecast 2024-2029 ($ million)
- Exhibits156: Chart on Canada - Year-over-year growth 2024-2029 (%)
- Exhibits157: Data Table on Canada - Year-over-year growth 2024-2029 (%)
- Exhibits158: Chart on UK - Market size and forecast 2024-2029 ($ million)
- Exhibits159: Data Table on UK - Market size and forecast 2024-2029 ($ million)
- Exhibits160: Chart on UK - Year-over-year growth 2024-2029 (%)
- Exhibits161: Data Table on UK - Year-over-year growth 2024-2029 (%)
- Exhibits162: Chart on Germany - Market size and forecast 2024-2029 ($ million)
- Exhibits163: Data Table on Germany - Market size and forecast 2024-2029 ($ million)
- Exhibits164: Chart on Germany - Year-over-year growth 2024-2029 (%)
- Exhibits165: Data Table on Germany - Year-over-year growth 2024-2029 (%)
- Exhibits166: Chart on France - Market size and forecast 2024-2029 ($ million)
- Exhibits167: Data Table on France - Market size and forecast 2024-2029 ($ million)
- Exhibits168: Chart on France - Year-over-year growth 2024-2029 (%)
- Exhibits169: Data Table on France - Year-over-year growth 2024-2029 (%)
- Exhibits170: Chart on China - Market size and forecast 2024-2029 ($ million)
- Exhibits171: Data Table on China - Market size and forecast 2024-2029 ($ million)
- Exhibits172: Chart on China - Year-over-year growth 2024-2029 (%)
- Exhibits173: Data Table on China - Year-over-year growth 2024-2029 (%)
- Exhibits174: Chart on India - Market size and forecast 2024-2029 ($ million)
- Exhibits175: Data Table on India - Market size and forecast 2024-2029 ($ million)
- Exhibits176: Chart on India - Year-over-year growth 2024-2029 (%)
- Exhibits177: Data Table on India - Year-over-year growth 2024-2029 (%)
- Exhibits178: Chart on Japan - Market size and forecast 2024-2029 ($ million)
- Exhibits179: Data Table on Japan - Market size and forecast 2024-2029 ($ million)
- Exhibits180: Chart on Japan - Year-over-year growth 2024-2029 (%)
- Exhibits181: Data Table on Japan - Year-over-year growth 2024-2029 (%)
- Exhibits182: Chart on Australia - Market size and forecast 2024-2029 ($ million)
- Exhibits183: Data Table on Australia - Market size and forecast 2024-2029 ($ million)
- Exhibits184: Chart on Australia - Year-over-year growth 2024-2029 (%)
- Exhibits185: Data Table on Australia - Year-over-year growth 2024-2029 (%)
- Exhibits186: Chart on Brazil - Market size and forecast 2024-2029 ($ million)
- Exhibits187: Data Table on Brazil - Market size and forecast 2024-2029 ($ million)
- Exhibits188: Chart on Brazil - Year-over-year growth 2024-2029 (%)
- Exhibits189: Data Table on Brazil - Year-over-year growth 2024-2029 (%)
- Exhibits190: Market opportunity By Geographical Landscape ($ million)
- Exhibits191: Data Tables on Market opportunity By Geographical Landscape ($ million)
- Exhibits192: Impact of drivers and challenges in 2024 and 2029
- Exhibits193: Overview on criticality of inputs and factors of differentiation
- Exhibits194: Overview on factors of disruption
- Exhibits195: Impact of key risks on business
- Exhibits196: Companies covered
- Exhibits197: Company ranking index
- Exhibits198: Matrix on companies position and classification
- Exhibits199: Accenture PLC - Overview
- Exhibits200: Accenture PLC - Business segments
- Exhibits201: Accenture PLC - Key news
- Exhibits202: Accenture PLC - Key offerings
- Exhibits203: Accenture PLC - Segment focus
- Exhibits204: SWOT
- Exhibits205: Amazon Web Services Inc. - Overview
- Exhibits206: Amazon Web Services Inc. - Product / Service
- Exhibits207: Amazon Web Services Inc. - Key news
- Exhibits208: Amazon Web Services Inc. - Key offerings
- Exhibits209: SWOT
- Exhibits210: Check Point Software Technologies Ltd. - Overview
- Exhibits211: Check Point Software Technologies Ltd. - Product / Service
- Exhibits212: Check Point Software Technologies Ltd. - Key news
- Exhibits213: Check Point Software Technologies Ltd. - Key offerings
- Exhibits214: SWOT
- Exhibits215: Cisco Systems Inc. - Overview
- Exhibits216: Cisco Systems Inc. - Business segments
- Exhibits217: Cisco Systems Inc. - Key news
- Exhibits218: Cisco Systems Inc. - Key offerings
- Exhibits219: Cisco Systems Inc. - Segment focus
- Exhibits220: SWOT
- Exhibits221: Cloudflare Inc. - Overview
- Exhibits222: Cloudflare Inc. - Product / Service
- Exhibits223: Cloudflare Inc. - Key news
- Exhibits224: Cloudflare Inc. - Key offerings
- Exhibits225: SWOT
- Exhibits226: CrowdStrike Inc. - Overview
- Exhibits227: CrowdStrike Inc. - Product / Service
- Exhibits228: CrowdStrike Inc. - Key offerings
- Exhibits229: SWOT
- Exhibits230: Darktrace Holdings Ltd. - Overview
- Exhibits231: Darktrace Holdings Ltd. - Product / Service
- Exhibits232: Darktrace Holdings Ltd. - Key offerings
- Exhibits233: SWOT
- Exhibits234: Fortinet Inc. - Overview
- Exhibits235: Fortinet Inc. - Product / Service
- Exhibits236: Fortinet Inc. - Key news
- Exhibits237: Fortinet Inc. - Key offerings
- Exhibits238: SWOT
- Exhibits239: Google LLC - Overview
- Exhibits240: Google LLC - Product / Service
- Exhibits241: Google LLC - Key offerings
- Exhibits242: SWOT
- Exhibits243: International Business Machines Corp. - Overview
- Exhibits244: International Business Machines Corp. - Business segments
- Exhibits245: International Business Machines Corp. - Key news
- Exhibits246: International Business Machines Corp. - Key offerings
- Exhibits247: International Business Machines Corp. - Segment focus
- Exhibits248: SWOT
- Exhibits249: Microsoft Corp. - Overview
- Exhibits250: Microsoft Corp. - Business segments
- Exhibits251: Microsoft Corp. - Key news
- Exhibits252: Microsoft Corp. - Key offerings
- Exhibits253: Microsoft Corp. - Segment focus
- Exhibits254: SWOT
- Exhibits255: NVIDIA Corp. - Overview
- Exhibits256: NVIDIA Corp. - Business segments
- Exhibits257: NVIDIA Corp. - Key news
- Exhibits258: NVIDIA Corp. - Key offerings
- Exhibits259: NVIDIA Corp. - Segment focus
- Exhibits260: SWOT
- Exhibits261: Palo Alto Networks Inc. - Overview
- Exhibits262: Palo Alto Networks Inc. - Product / Service
- Exhibits263: Palo Alto Networks Inc. - Key news
- Exhibits264: Palo Alto Networks Inc. - Key offerings
- Exhibits265: SWOT
- Exhibits266: SENTINELONE Inc. - Overview
- Exhibits267: SENTINELONE Inc. - Product / Service
- Exhibits268: SENTINELONE Inc. - Key offerings
- Exhibits269: SWOT
- Exhibits270: Splunk Inc. - Overview
- Exhibits271: Splunk Inc. - Product / Service
- Exhibits272: Splunk Inc. - Key offerings
- Exhibits273: SWOT
- Exhibits274: Inclusions checklist
- Exhibits275: Exclusions checklist
- Exhibits276: Currency conversion rates for US$
- Exhibits277: Research methodology
- Exhibits278: Information sources
- Exhibits279: Data validation
- Exhibits280: Validation techniques employed for market sizing
- Exhibits281: Data synthesis
- Exhibits282: 360 degree market analysis
- Exhibits283: List of abbreviations
The generative AI cybersecurity market is forecasted to grow by USD 11,607.7 mn during 2024-2029, accelerating at a CAGR of 35.4% during the forecast period. The report on the generative AI cybersecurity market provides a holistic analysis, market size and forecast, trends, growth drivers, and challenges, as well as vendor analysis covering around 25 vendors.
The report offers an up-to-date analysis regarding the current market scenario, the latest trends and drivers, and the overall market environment. The market is driven by proliferation of AI-augmented cyber threats, intensifying regulatory scrutiny and imperative for AI governance, and widespread enterprise integration of generative AI and consequent expansion of attack surface.
| Market Scope | |
|---|---|
| Base Year | 2025 |
| End Year | 2029 |
| Series Year | 2025-2029 |
| Growth Momentum | Accelerate |
| YOY 2025 | 30.1% |
| CAGR | 35.4% |
| Incremental Value | $11,607.7 mn |
The study was conducted using an objective combination of primary and secondary information including inputs from key participants in the industry. The report contains a comprehensive market size data, segment with regional analysis and vendor landscape in addition to an analysis of the key companies. Reports have historic and forecast data.
Technavio's generative AI cybersecurity market is segmented as below:
By Component
- Software
- Services
By Type
- Network security
- Threat detection and analysis
- Adversarial defense
- Insider threat detection
- Others
By Technology
- GANs
- DNNs
- VAEs
- Reinforcement learning
- Others
By End-user
- BFSI
- Retail and e-commerce
- Government and defense
- Healthcare and life sciences
- Others
By Geographical Landscape
- North America
- Europe
- APAC
- South America
- Middle East and Africa
This study identifies the proliferation of AI-specific governance, risk, and compliance platforms as one of the prime reasons driving the generative AI cybersecurity market growth during the next few years. Also, emergence of adversarial AI simulation and red teaming as a service and integration of generative AI into security operations for enhanced threat defense will lead to sizable demand in the market.
The report on the generative AI cybersecurity market covers the following areas:
- generative AI Cybersecurity Market sizing
- generative AI Cybersecurity Market forecast
- generative AI Cybersecurity Market industry analysis
The robust vendor analysis is designed to help clients improve their market position, and in line with this, this report provides a detailed analysis of several leading generative AI cybersecurity market vendors that include Accenture PLC, Amazon Web Services Inc., Check Point Software Technologies Ltd., Cisco Systems Inc., Cloudflare Inc., CrowdStrike Inc., Cyera Ltd., Darktrace Holdings Ltd., Fortinet Inc., Google LLC, INKY Technology Corp., International Business Machines Corp., Microsoft Corp., Netskope Inc., NVIDIA Corp., Palo Alto Networks Inc., SENTINELONE Inc., Splunk Inc., and Vectra AI Inc.. Also, the generative AI cybersecurity market analysis report includes information on upcoming trends and challenges that will influence market growth. This is to help companies strategize and leverage all forthcoming growth opportunities.
The publisher presents a detailed picture of the market by the way of study, synthesis, and summation of data from multiple sources by an analysis of key parameters such as profit, pricing, competition, and promotions. It presents various market facets by identifying the key industry influencers. The data presented is comprehensive, reliable, and a result of extensive primary and secondary research. The market research reports provide a complete competitive landscape and an in-depth vendor selection methodology and analysis using qualitative and quantitative research to forecast accurate market growth.
Table of Contents
1 Executive Summary
- 1.1 Market overview
- Executive Summary - Chart on Market Overview
- Executive Summary - Data Table on Market Overview
- Executive Summary - Chart on Global Market Characteristics
- Executive Summary - Chart on Market By Geographical Landscape
- Executive Summary - Chart on Market Segmentation by Component
- Executive Summary - Chart on Market Segmentation by Type
- Executive Summary - Chart on Market Segmentation by Technology
- Executive Summary - Chart on Market Segmentation by End-user
- Executive Summary - Chart on Incremental Growth
- Executive Summary - Data Table on Incremental Growth
- Executive Summary - Chart on Company Market Positioning
2 Technavio Analysis
- 2.1 Analysis of price sensitivity, lifecycle, customer purchase basket, adoption rates, and purchase criteria
- Analysis of price sensitivity, lifecycle, customer purchase basket, adoption rates, and purchase criteria
- 2.2 Criticality of inputs and Factors of differentiation
- Overview on criticality of inputs and factors of differentiation
- 2.3 Factors of disruption
- Overview on factors of disruption
- 2.4 Impact of drivers and challenges
- Impact of drivers and challenges in 2024 and 2029
3 Market Landscape
- 3.1 Market ecosystem
- Parent Market
- Data Table on - Parent Market
- 3.2 Market characteristics
- Market characteristics analysis
- 3.3 Value chain analysis
- Value chain analysis
4 Market Sizing
- 4.1 Market definition
- Offerings of companies included in the market definition
- 4.2 Market segment analysis
- Market segments
- 4.3 Market size 2024
- 4.4 Market outlook: Forecast for 2024-2029
- Chart on Global - Market size and forecast 2024-2029 ($ million)
- Data Table on Global - Market size and forecast 2024-2029 ($ million)
- Chart on Global Market: Year-over-year growth 2024-2029 (%)
- Data Table on Global Market: Year-over-year growth 2024-2029 (%)
5 Five Forces Analysis
- 5.1 Five forces summary
- Five forces analysis - Comparison between 2024 and 2029
- 5.2 Bargaining power of buyers
- Bargaining power of buyers - Impact of key factors 2024 and 2029
- 5.3 Bargaining power of suppliers
- Bargaining power of suppliers - Impact of key factors in 2024 and 2029
- 5.4 Threat of new entrants
- Threat of new entrants - Impact of key factors in 2024 and 2029
- 5.5 Threat of substitutes
- Threat of substitutes - Impact of key factors in 2024 and 2029
- 5.6 Threat of rivalry
- Threat of rivalry - Impact of key factors in 2024 and 2029
- 5.7 Market condition
- Chart on Market condition - Five forces 2024 and 2029
6 Market Segmentation by Component
- 6.1 Market segments
- Chart on Component - Market share 2024-2029 (%)
- Data Table on Component - Market share 2024-2029 (%)
- 6.2 Comparison by Component
- Chart on Comparison by Component
- Data Table on Comparison by Component
- 6.3 Software - Market size and forecast 2024-2029
- Chart on Software - Market size and forecast 2024-2029 ($ million)
- Data Table on Software - Market size and forecast 2024-2029 ($ million)
- Chart on Software - Year-over-year growth 2024-2029 (%)
- Data Table on Software - Year-over-year growth 2024-2029 (%)
- 6.4 Services - Market size and forecast 2024-2029
- Chart on Services - Market size and forecast 2024-2029 ($ million)
- Data Table on Services - Market size and forecast 2024-2029 ($ million)
- Chart on Services - Year-over-year growth 2024-2029 (%)
- Data Table on Services - Year-over-year growth 2024-2029 (%)
- 6.5 Market opportunity by Component
- Market opportunity by Component ($ million)
- Data Table on Market opportunity by Component ($ million)
7 Market Segmentation by Type
- 7.1 Market segments
- Chart on Type - Market share 2024-2029 (%)
- Data Table on Type - Market share 2024-2029 (%)
- 7.2 Comparison by Type
- Chart on Comparison by Type
- Data Table on Comparison by Type
- 7.3 Network security - Market size and forecast 2024-2029
- Chart on Network security - Market size and forecast 2024-2029 ($ million)
- Data Table on Network security - Market size and forecast 2024-2029 ($ million)
- Chart on Network security - Year-over-year growth 2024-2029 (%)
- Data Table on Network security - Year-over-year growth 2024-2029 (%)
- 7.4 Threat detection and analysis - Market size and forecast 2024-2029
- Chart on Threat detection and analysis - Market size and forecast 2024-2029 ($ million)
- Data Table on Threat detection and analysis - Market size and forecast 2024-2029 ($ million)
- Chart on Threat detection and analysis - Year-over-year growth 2024-2029 (%)
- Data Table on Threat detection and analysis - Year-over-year growth 2024-2029 (%)
- 7.5 Adversarial defense - Market size and forecast 2024-2029
- Chart on Adversarial defense - Market size and forecast 2024-2029 ($ million)
- Data Table on Adversarial defense - Market size and forecast 2024-2029 ($ million)
- Chart on Adversarial defense - Year-over-year growth 2024-2029 (%)
- Data Table on Adversarial defense - Year-over-year growth 2024-2029 (%)
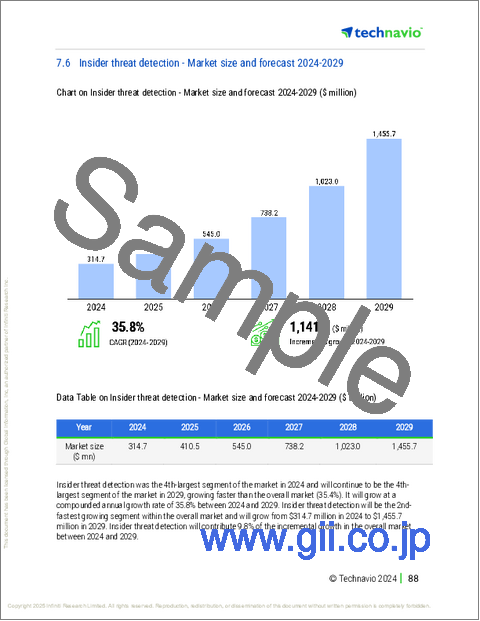
- 7.6 Insider threat detection - Market size and forecast 2024-2029
- Chart on Insider threat detection - Market size and forecast 2024-2029 ($ million)
- Data Table on Insider threat detection - Market size and forecast 2024-2029 ($ million)
- Chart on Insider threat detection - Year-over-year growth 2024-2029 (%)
- Data Table on Insider threat detection - Year-over-year growth 2024-2029 (%)
- 7.7 Others - Market size and forecast 2024-2029
- Chart on Others - Market size and forecast 2024-2029 ($ million)
- Data Table on Others - Market size and forecast 2024-2029 ($ million)
- Chart on Others - Year-over-year growth 2024-2029 (%)
- Data Table on Others - Year-over-year growth 2024-2029 (%)
- 7.8 Market opportunity by Type
- Market opportunity by Type ($ million)
- Data Table on Market opportunity by Type ($ million)
8 Market Segmentation by Technology
- 8.1 Market segments
- Chart on Technology - Market share 2024-2029 (%)
- Data Table on Technology - Market share 2024-2029 (%)
- 8.2 Comparison by Technology
- Chart on Comparison by Technology
- Data Table on Comparison by Technology
- 8.3 GANs - Market size and forecast 2024-2029
- Chart on GANs - Market size and forecast 2024-2029 ($ million)
- Data Table on GANs - Market size and forecast 2024-2029 ($ million)
- Chart on GANs - Year-over-year growth 2024-2029 (%)
- Data Table on GANs - Year-over-year growth 2024-2029 (%)
- 8.4 DNNs - Market size and forecast 2024-2029
- Chart on DNNs - Market size and forecast 2024-2029 ($ million)
- Data Table on DNNs - Market size and forecast 2024-2029 ($ million)
- Chart on DNNs - Year-over-year growth 2024-2029 (%)
- Data Table on DNNs - Year-over-year growth 2024-2029 (%)
- 8.5 VAEs - Market size and forecast 2024-2029
- Chart on VAEs - Market size and forecast 2024-2029 ($ million)
- Data Table on VAEs - Market size and forecast 2024-2029 ($ million)
- Chart on VAEs - Year-over-year growth 2024-2029 (%)
- Data Table on VAEs - Year-over-year growth 2024-2029 (%)
- 8.6 Reinforcement learning - Market size and forecast 2024-2029
- Chart on Reinforcement learning - Market size and forecast 2024-2029 ($ million)
- Data Table on Reinforcement learning - Market size and forecast 2024-2029 ($ million)
- Chart on Reinforcement learning - Year-over-year growth 2024-2029 (%)
- Data Table on Reinforcement learning - Year-over-year growth 2024-2029 (%)
- 8.7 Others - Market size and forecast 2024-2029
- Chart on Others - Market size and forecast 2024-2029 ($ million)
- Data Table on Others - Market size and forecast 2024-2029 ($ million)
- Chart on Others - Year-over-year growth 2024-2029 (%)
- Data Table on Others - Year-over-year growth 2024-2029 (%)
- 8.8 Market opportunity by Technology
- Market opportunity by Technology ($ million)
- Data Table on Market opportunity by Technology ($ million)
9 Market Segmentation by End-user
- 9.1 Market segments
- Chart on End-user - Market share 2024-2029 (%)
- Data Table on End-user - Market share 2024-2029 (%)
- 9.2 Comparison by End-user
- Chart on Comparison by End-user
- Data Table on Comparison by End-user
- 9.3 BFSI - Market size and forecast 2024-2029
- Chart on BFSI - Market size and forecast 2024-2029 ($ million)
- Data Table on BFSI - Market size and forecast 2024-2029 ($ million)
- Chart on BFSI - Year-over-year growth 2024-2029 (%)
- Data Table on BFSI - Year-over-year growth 2024-2029 (%)
- 9.4 Retail and e-commerce - Market size and forecast 2024-2029
- Chart on Retail and e-commerce - Market size and forecast 2024-2029 ($ million)
- Data Table on Retail and e-commerce - Market size and forecast 2024-2029 ($ million)
- Chart on Retail and e-commerce - Year-over-year growth 2024-2029 (%)
- Data Table on Retail and e-commerce - Year-over-year growth 2024-2029 (%)
- 9.5 Government and defense - Market size and forecast 2024-2029
- Chart on Government and defense - Market size and forecast 2024-2029 ($ million)
- Data Table on Government and defense - Market size and forecast 2024-2029 ($ million)
- Chart on Government and defense - Year-over-year growth 2024-2029 (%)
- Data Table on Government and defense - Year-over-year growth 2024-2029 (%)
- 9.6 Healthcare and life sciences - Market size and forecast 2024-2029
- Chart on Healthcare and life sciences - Market size and forecast 2024-2029 ($ million)
- Data Table on Healthcare and life sciences - Market size and forecast 2024-2029 ($ million)
- Chart on Healthcare and life sciences - Year-over-year growth 2024-2029 (%)
- Data Table on Healthcare and life sciences - Year-over-year growth 2024-2029 (%)
- 9.7 Others - Market size and forecast 2024-2029
- Chart on Others - Market size and forecast 2024-2029 ($ million)
- Data Table on Others - Market size and forecast 2024-2029 ($ million)
- Chart on Others - Year-over-year growth 2024-2029 (%)
- Data Table on Others - Year-over-year growth 2024-2029 (%)
- 9.8 Market opportunity by End-user
- Market opportunity by End-user ($ million)
- Data Table on Market opportunity by End-user ($ million)
10 Customer Landscape
- 10.1 Customer landscape overview
- Analysis of price sensitivity, lifecycle, customer purchase basket, adoption rates, and purchase criteria
11 Geographic Landscape
- 11.1 Geographic segmentation
- Chart on Market share By Geographical Landscape 2024-2029 (%)
- Data Table on Market share By Geographical Landscape 2024-2029 (%)
- 11.2 Geographic comparison
- Chart on Geographic comparison
- Data Table on Geographic comparison
- 11.3 North America - Market size and forecast 2024-2029
- Chart on North America - Market size and forecast 2024-2029 ($ million)
- Data Table on North America - Market size and forecast 2024-2029 ($ million)
- Chart on North America - Year-over-year growth 2024-2029 (%)
- Data Table on North America - Year-over-year growth 2024-2029 (%)
- 11.4 Europe - Market size and forecast 2024-2029
- Chart on Europe - Market size and forecast 2024-2029 ($ million)
- Data Table on Europe - Market size and forecast 2024-2029 ($ million)
- Chart on Europe - Year-over-year growth 2024-2029 (%)
- Data Table on Europe - Year-over-year growth 2024-2029 (%)
- 11.5 APAC - Market size and forecast 2024-2029
- Chart on APAC - Market size and forecast 2024-2029 ($ million)
- Data Table on APAC - Market size and forecast 2024-2029 ($ million)
- Chart on APAC - Year-over-year growth 2024-2029 (%)
- Data Table on APAC - Year-over-year growth 2024-2029 (%)
- 11.6 South America - Market size and forecast 2024-2029
- Chart on South America - Market size and forecast 2024-2029 ($ million)
- Data Table on South America - Market size and forecast 2024-2029 ($ million)
- Chart on South America - Year-over-year growth 2024-2029 (%)
- Data Table on South America - Year-over-year growth 2024-2029 (%)
- 11.7 Middle East and Africa - Market size and forecast 2024-2029
- Chart on Middle East and Africa - Market size and forecast 2024-2029 ($ million)
- Data Table on Middle East and Africa - Market size and forecast 2024-2029 ($ million)
- Chart on Middle East and Africa - Year-over-year growth 2024-2029 (%)
- Data Table on Middle East and Africa - Year-over-year growth 2024-2029 (%)
- 11.8 US - Market size and forecast 2024-2029
- Chart on US - Market size and forecast 2024-2029 ($ million)
- Data Table on US - Market size and forecast 2024-2029 ($ million)
- Chart on US - Year-over-year growth 2024-2029 (%)
- Data Table on US - Year-over-year growth 2024-2029 (%)
- 11.9 Canada - Market size and forecast 2024-2029
- Chart on Canada - Market size and forecast 2024-2029 ($ million)
- Data Table on Canada - Market size and forecast 2024-2029 ($ million)
- Chart on Canada - Year-over-year growth 2024-2029 (%)
- Data Table on Canada - Year-over-year growth 2024-2029 (%)
- 11.10 UK - Market size and forecast 2024-2029
- Chart on UK - Market size and forecast 2024-2029 ($ million)
- Data Table on UK - Market size and forecast 2024-2029 ($ million)
- Chart on UK - Year-over-year growth 2024-2029 (%)
- Data Table on UK - Year-over-year growth 2024-2029 (%)
- 11.11 Germany - Market size and forecast 2024-2029
- Chart on Germany - Market size and forecast 2024-2029 ($ million)
- Data Table on Germany - Market size and forecast 2024-2029 ($ million)
- Chart on Germany - Year-over-year growth 2024-2029 (%)
- Data Table on Germany - Year-over-year growth 2024-2029 (%)
- 11.12 France - Market size and forecast 2024-2029
- Chart on France - Market size and forecast 2024-2029 ($ million)
- Data Table on France - Market size and forecast 2024-2029 ($ million)
- Chart on France - Year-over-year growth 2024-2029 (%)
- Data Table on France - Year-over-year growth 2024-2029 (%)
- 11.13 China - Market size and forecast 2024-2029
- Chart on China - Market size and forecast 2024-2029 ($ million)
- Data Table on China - Market size and forecast 2024-2029 ($ million)
- Chart on China - Year-over-year growth 2024-2029 (%)
- Data Table on China - Year-over-year growth 2024-2029 (%)
- 11.14 India - Market size and forecast 2024-2029
- Chart on India - Market size and forecast 2024-2029 ($ million)
- Data Table on India - Market size and forecast 2024-2029 ($ million)
- Chart on India - Year-over-year growth 2024-2029 (%)
- Data Table on India - Year-over-year growth 2024-2029 (%)
- 11.15 Japan - Market size and forecast 2024-2029
- Chart on Japan - Market size and forecast 2024-2029 ($ million)
- Data Table on Japan - Market size and forecast 2024-2029 ($ million)
- Chart on Japan - Year-over-year growth 2024-2029 (%)
- Data Table on Japan - Year-over-year growth 2024-2029 (%)
- 11.16 Australia - Market size and forecast 2024-2029
- Chart on Australia - Market size and forecast 2024-2029 ($ million)
- Data Table on Australia - Market size and forecast 2024-2029 ($ million)
- Chart on Australia - Year-over-year growth 2024-2029 (%)
- Data Table on Australia - Year-over-year growth 2024-2029 (%)
- 11.17 Brazil - Market size and forecast 2024-2029
- Chart on Brazil - Market size and forecast 2024-2029 ($ million)
- Data Table on Brazil - Market size and forecast 2024-2029 ($ million)
- Chart on Brazil - Year-over-year growth 2024-2029 (%)
- Data Table on Brazil - Year-over-year growth 2024-2029 (%)
- 11.18 Market opportunity By Geographical Landscape
- Market opportunity By Geographical Landscape ($ million)
- Data Tables on Market opportunity By Geographical Landscape ($ million)
12 Drivers, Challenges, and Opportunity/Restraints
- 12.1 Market drivers
- 12.2 Market challenges
- 12.3 Impact of drivers and challenges
- Impact of drivers and challenges in 2024 and 2029
- 12.4 Market opportunities/restraints
13 Competitive Landscape
- 13.1 Overview
- 13.2 Competitive Landscape
- Overview on criticality of inputs and factors of differentiation
- 13.3 Landscape disruption
- Overview on factors of disruption
- 13.4 Industry risks
- Impact of key risks on business
14 Competitive Analysis
- 14.1 Companies profiled
- Companies covered
- 14.2 Company ranking index
- Company ranking index
- 14.3 Market positioning of companies
- Matrix on companies position and classification
- 14.4 Accenture PLC
- Accenture PLC - Overview
- Accenture PLC - Business segments
- Accenture PLC - Key news
- Accenture PLC - Key offerings
- Accenture PLC - Segment focus
- SWOT
- 14.5 Amazon Web Services Inc.
- Amazon Web Services Inc. - Overview
- Amazon Web Services Inc. - Product / Service
- Amazon Web Services Inc. - Key news
- Amazon Web Services Inc. - Key offerings
- SWOT
- 14.6 Check Point Software Technologies Ltd.
- Check Point Software Technologies Ltd. - Overview
- Check Point Software Technologies Ltd. - Product / Service
- Check Point Software Technologies Ltd. - Key news
- Check Point Software Technologies Ltd. - Key offerings
- SWOT
- 14.7 Cisco Systems Inc.
- Cisco Systems Inc. - Overview
- Cisco Systems Inc. - Business segments
- Cisco Systems Inc. - Key news
- Cisco Systems Inc. - Key offerings
- Cisco Systems Inc. - Segment focus
- SWOT
- 14.8 Cloudflare Inc.
- Cloudflare Inc. - Overview
- Cloudflare Inc. - Product / Service
- Cloudflare Inc. - Key news
- Cloudflare Inc. - Key offerings
- SWOT
- 14.9 CrowdStrike Inc.
- CrowdStrike Inc. - Overview
- CrowdStrike Inc. - Product / Service
- CrowdStrike Inc. - Key offerings
- SWOT
- 14.10 Darktrace Holdings Ltd.
- Darktrace Holdings Ltd. - Overview
- Darktrace Holdings Ltd. - Product / Service
- Darktrace Holdings Ltd. - Key offerings
- SWOT
- 14.11 Fortinet Inc.
- Fortinet Inc. - Overview
- Fortinet Inc. - Product / Service
- Fortinet Inc. - Key news
- Fortinet Inc. - Key offerings
- SWOT
- 14.12 Google LLC
- Google LLC - Overview
- Google LLC - Product / Service
- Google LLC - Key offerings
- SWOT
- 14.13 International Business Machines Corp.
- International Business Machines Corp. - Overview
- International Business Machines Corp. - Business segments
- International Business Machines Corp. - Key news
- International Business Machines Corp. - Key offerings
- International Business Machines Corp. - Segment focus
- SWOT
- 14.14 Microsoft Corp.
- Microsoft Corp. - Overview
- Microsoft Corp. - Business segments
- Microsoft Corp. - Key news
- Microsoft Corp. - Key offerings
- Microsoft Corp. - Segment focus
- SWOT
- 14.15 NVIDIA Corp.
- NVIDIA Corp. - Overview
- NVIDIA Corp. - Business segments
- NVIDIA Corp. - Key news
- NVIDIA Corp. - Key offerings
- NVIDIA Corp. - Segment focus
- SWOT
- 14.16 Palo Alto Networks Inc.
- Palo Alto Networks Inc. - Overview
- Palo Alto Networks Inc. - Product / Service
- Palo Alto Networks Inc. - Key news
- Palo Alto Networks Inc. - Key offerings
- SWOT
- 14.17 SENTINELONE Inc.
- SENTINELONE Inc. - Overview
- SENTINELONE Inc. - Product / Service
- SENTINELONE Inc. - Key offerings
- SWOT
- 14.18 Splunk Inc.
- Splunk Inc. - Overview
- Splunk Inc. - Product / Service
- Splunk Inc. - Key offerings
- SWOT
15 Appendix
- 15.1 Scope of the report
- 15.2 Inclusions and exclusions checklist
- Inclusions checklist
- Exclusions checklist
- 15.3 Currency conversion rates for US$
- Currency conversion rates for US$
- 15.4 Research methodology
- Research methodology
- 15.5 Data procurement
- Information sources
- 15.6 Data validation
- Data validation
- 15.7 Validation techniques employed for market sizing
- Validation techniques employed for market sizing
- 15.8 Data synthesis
- Data synthesis
- 15.9 360 degree market analysis
- 360 degree market analysis
- 15.10 List of abbreviations
- List of abbreviations
