|
|
市場調査レポート
商品コード
1777192
石油・ガス向け生成AIの世界市場、2025年~2029年Global Generative AI in Oil and Gas Market 2025-2029 |
||||||

|
|||||||
カスタマイズ可能
|
|||||||


| 石油・ガス向け生成AIの世界市場、2025年~2029年 |
|
出版日: 2025年07月19日
発行: TechNavio
ページ情報: 英文 238 Pages
納期: 即納可能
|

全表示
- 概要
- 図表
- 目次
石油・ガス向け生成AI市場は2024-2029年に14億9,130万米ドル、予測期間中のCAGRで33.6%の成長が予測されています。
当レポートでは、石油・ガス向け生成AI市場の全体的な分析、市場規模・予測、動向、成長促進要因、課題、約25のベンダーを網羅したベンダー分析などを掲載しています。
現在の市場シナリオ、最新動向と促進要因、市場環境全体に関する最新分析を提供しています。同市場は、業務効率化とコスト削減への絶え間ない要請、AI技術と拡張可能なデジタルインフラの加速的な成熟、持続可能性の強化とエネルギー転換への高まる圧力によって牽引されています。
| 市場範囲 | |
|---|---|
| 基準年 | 2025 |
| 終了年 | 2029 |
| 予測期間 | 2025-2029 |
| 成長モメンタム | 加速 |
| 前年比 | 31.5% |
| CAGR | 33.6% |
| 増分額 | 14億9,130万米ドル |
本調査は、業界の主要参加者からのインプットを含め、一次情報と二次情報を客観的に組み合わせて実施しました。本レポートには、主要企業の分析に加え、包括的な市場規模データ、地域分析によるセグメント、ベンダー情勢が含まれています。レポートには過去データと予測データがあります。
本調査では、今後数年間の石油・ガス向け生成AI市場の成長を促進する主な要因の1つとして、独自およびドメイン固有の生成モデルの開発を挙げています。また、産業メタバースに向けたデジタルツインとの統合、AIコパイロットと人間拡張の台頭は、市場の大きな需要につながります。
目次
第1章 エグゼクティブサマリー
- 市場概要
第2章 Technavio分析
- 価格・ライフサイクル・顧客購入バスケット・採用率・購入基準の分析
- インプットの重要性と差別化の要因
- 混乱の要因
- 促進要因と課題の影響
第3章 市場情勢
- 市場エコシステム
- 市場の特徴
- バリューチェーン分析
第4章 市場規模
- 市場の定義
- 市場セグメント分析
- 市場規模 2024
- 市場の見通し 2024-2029
第5章 ファイブフォース分析
- ファイブフォースの要約
- 買い手の交渉力
- 供給企業の交渉力
- 新規参入業者の脅威
- 代替品の脅威
- 競争の脅威
- 市況
第6章 市場セグメンテーション:コンポーネント別
- 市場セグメント
- 比較:コンポーネント別
- ソリューション:市場規模と予測 2024-2029
- サービス:市場規模と予測 2024-2029
- 市場機会:コンポーネント別
第7章 市場セグメンテーション:アプリケーション別
- 市場セグメント
- 比較:アプリケーション別
- 探査・生産:市場規模と予測 2024-2029
- 貯留層管理:市場規模と予測 2024-2029
- リスク管理:市場規模と予測 2024-2029
- サプライチェーン最適化:市場規模と予測 2024-2029
- その他:市場規模と予測 2024-2029
- 市場機会:アプリケーション別
第8章 市場セグメンテーション:エンドユーザー別
- 市場セグメント
- 比較:エンドユーザー別
- データ分析・インサイト:市場規模と予測 2024-2029
- 自動化・効率化:市場規模と予測 2024-2029
- リスク管理・安全性:市場規模と予測 2024-2029
- イノベーション・持続可能性:市場規模と予測 2024-2029
- 市場機会:エンドユーザー別
第9章 顧客情勢
- 顧客情勢の概要
第10章 地域別情勢
- 地域別セグメンテーション
- 地域別比較
- 北米:市場規模と予測 2024-2029
- 欧州:市場規模と予測 2024-2029
- アジア太平洋:市場規模と予測 2024-2029
- 中東・アフリカ:市場規模と予測 2024-2029
- 南米:市場規模と予測 2024-2029
- 米国:市場規模と予測 2024-2029
- 中国:市場規模と予測 2024-2029
- カナダ:市場規模と予測 2024-2029
- 英国:市場規模と予測 2024-2029
- ドイツ:市場規模と予測 2024-2029
- インド:市場規模と予測 2024-2029
- フランス:市場規模と予測 2024-2029
- オーストラリア:市場規模と予測 2024-2029
- ブラジル:市場規模と予測 2024-2029
- サウジアラビア:市場規模と予測 2024-2029
- 市場機会:地域情勢別
第11章 促進要因・課題・機会・抑制要因
- 市場促進要因
- 市場の課題
- 促進要因と課題の影響
- 市場の機会・抑制要因
第12章 競合情勢
- 概要
- 競合情勢
- 混乱の状況
- 業界のリスク
第13章 競合分析
- 企業プロファイル
- 企業ランキング指数
- 企業の市場ポジショニング
- AIQ
- Amazon Web Services Inc.
- Baker Hughes Co.
- C3.ai Inc.
- Exxon Mobil Corp.
- Google LLC
- Halliburton Co.
- International Business Machines Corp.
- Microsoft Corp.
- Oracle Corp.
- Petroleo Brasileiro SA
- Repsol SA
- Schlumberger Ltd.
- Shell plc
- TotalEnergies SE
第14章 付録
Exhibits:
- Exhibits1: Executive Summary - Chart on Market Overview
- Exhibits2: Executive Summary - Data Table on Market Overview
- Exhibits3: Executive Summary - Chart on Global Market Characteristics
- Exhibits4: Executive Summary - Chart on Market By Geographical Landscape
- Exhibits5: Executive Summary - Chart on Market Segmentation by Component
- Exhibits6: Executive Summary - Chart on Market Segmentation by Application
- Exhibits7: Executive Summary - Chart on Market Segmentation by End-user
- Exhibits8: Executive Summary - Chart on Incremental Growth
- Exhibits9: Executive Summary - Data Table on Incremental Growth
- Exhibits10: Executive Summary - Chart on Company Market Positioning
- Exhibits11: Analysis of price sensitivity, lifecycle, customer purchase basket, adoption rates, and purchase criteria
- Exhibits12: Overview on criticality of inputs and factors of differentiation
- Exhibits13: Overview on factors of disruption
- Exhibits14: Impact of drivers and challenges in 2024 and 2029
- Exhibits15: Parent Market
- Exhibits16: Data Table on - Parent Market
- Exhibits17: Market characteristics analysis
- Exhibits18: Value chain analysis
- Exhibits19: Offerings of companies included in the market definition
- Exhibits20: Market segments
- Exhibits21: Chart on Global - Market size and forecast 2024-2029 ($ million)
- Exhibits22: Data Table on Global - Market size and forecast 2024-2029 ($ million)
- Exhibits23: Chart on Global Market: Year-over-year growth 2024-2029 (%)
- Exhibits24: Data Table on Global Market: Year-over-year growth 2024-2029 (%)
- Exhibits25: Five forces analysis - Comparison between 2024 and 2029
- Exhibits26: Bargaining power of buyers - Impact of key factors 2024 and 2029
- Exhibits27: Bargaining power of suppliers - Impact of key factors in 2024 and 2029
- Exhibits28: Threat of new entrants - Impact of key factors in 2024 and 2029
- Exhibits29: Threat of substitutes - Impact of key factors in 2024 and 2029
- Exhibits30: Threat of rivalry - Impact of key factors in 2024 and 2029
- Exhibits31: Chart on Market condition - Five forces 2024 and 2029
- Exhibits32: Chart on Component - Market share 2024-2029 (%)
- Exhibits33: Data Table on Component - Market share 2024-2029 (%)
- Exhibits34: Chart on Comparison by Component
- Exhibits35: Data Table on Comparison by Component
- Exhibits36: Chart on Solutions - Market size and forecast 2024-2029 ($ million)
- Exhibits37: Data Table on Solutions - Market size and forecast 2024-2029 ($ million)
- Exhibits38: Chart on Solutions - Year-over-year growth 2024-2029 (%)
- Exhibits39: Data Table on Solutions - Year-over-year growth 2024-2029 (%)
- Exhibits40: Chart on Services - Market size and forecast 2024-2029 ($ million)
- Exhibits41: Data Table on Services - Market size and forecast 2024-2029 ($ million)
- Exhibits42: Chart on Services - Year-over-year growth 2024-2029 (%)
- Exhibits43: Data Table on Services - Year-over-year growth 2024-2029 (%)
- Exhibits44: Market opportunity by Component ($ million)
- Exhibits45: Data Table on Market opportunity by Component ($ million)
- Exhibits46: Chart on Application - Market share 2024-2029 (%)
- Exhibits47: Data Table on Application - Market share 2024-2029 (%)
- Exhibits48: Chart on Comparison by Application
- Exhibits49: Data Table on Comparison by Application
- Exhibits50: Chart on Exploration and production - Market size and forecast 2024-2029 ($ million)
- Exhibits51: Data Table on Exploration and production - Market size and forecast 2024-2029 ($ million)
- Exhibits52: Chart on Exploration and production - Year-over-year growth 2024-2029 (%)
- Exhibits53: Data Table on Exploration and production - Year-over-year growth 2024-2029 (%)
- Exhibits54: Chart on Reservoir management - Market size and forecast 2024-2029 ($ million)
- Exhibits55: Data Table on Reservoir management - Market size and forecast 2024-2029 ($ million)
- Exhibits56: Chart on Reservoir management - Year-over-year growth 2024-2029 (%)
- Exhibits57: Data Table on Reservoir management - Year-over-year growth 2024-2029 (%)
- Exhibits58: Chart on Risk management - Market size and forecast 2024-2029 ($ million)
- Exhibits59: Data Table on Risk management - Market size and forecast 2024-2029 ($ million)
- Exhibits60: Chart on Risk management - Year-over-year growth 2024-2029 (%)
- Exhibits61: Data Table on Risk management - Year-over-year growth 2024-2029 (%)
- Exhibits62: Chart on Supply chain optimization - Market size and forecast 2024-2029 ($ million)
- Exhibits63: Data Table on Supply chain optimization - Market size and forecast 2024-2029 ($ million)
- Exhibits64: Chart on Supply chain optimization - Year-over-year growth 2024-2029 (%)
- Exhibits65: Data Table on Supply chain optimization - Year-over-year growth 2024-2029 (%)
- Exhibits66: Chart on Others - Market size and forecast 2024-2029 ($ million)
- Exhibits67: Data Table on Others - Market size and forecast 2024-2029 ($ million)
- Exhibits68: Chart on Others - Year-over-year growth 2024-2029 (%)
- Exhibits69: Data Table on Others - Year-over-year growth 2024-2029 (%)
- Exhibits70: Market opportunity by Application ($ million)
- Exhibits71: Data Table on Market opportunity by Application ($ million)
- Exhibits72: Chart on End-user - Market share 2024-2029 (%)
- Exhibits73: Data Table on End-user - Market share 2024-2029 (%)
- Exhibits74: Chart on Comparison by End-user
- Exhibits75: Data Table on Comparison by End-user
- Exhibits76: Chart on Data analysis and insights - Market size and forecast 2024-2029 ($ million)
- Exhibits77: Data Table on Data analysis and insights - Market size and forecast 2024-2029 ($ million)
- Exhibits78: Chart on Data analysis and insights - Year-over-year growth 2024-2029 (%)
- Exhibits79: Data Table on Data analysis and insights - Year-over-year growth 2024-2029 (%)
- Exhibits80: Chart on Automation and efficiency - Market size and forecast 2024-2029 ($ million)
- Exhibits81: Data Table on Automation and efficiency - Market size and forecast 2024-2029 ($ million)
- Exhibits82: Chart on Automation and efficiency - Year-over-year growth 2024-2029 (%)
- Exhibits83: Data Table on Automation and efficiency - Year-over-year growth 2024-2029 (%)
- Exhibits84: Chart on Risk management and safety - Market size and forecast 2024-2029 ($ million)
- Exhibits85: Data Table on Risk management and safety - Market size and forecast 2024-2029 ($ million)
- Exhibits86: Chart on Risk management and safety - Year-over-year growth 2024-2029 (%)
- Exhibits87: Data Table on Risk management and safety - Year-over-year growth 2024-2029 (%)
- Exhibits88: Chart on Innovation and sustainability - Market size and forecast 2024-2029 ($ million)
- Exhibits89: Data Table on Innovation and sustainability - Market size and forecast 2024-2029 ($ million)
- Exhibits90: Chart on Innovation and sustainability - Year-over-year growth 2024-2029 (%)
- Exhibits91: Data Table on Innovation and sustainability - Year-over-year growth 2024-2029 (%)
- Exhibits92: Market opportunity by End-user ($ million)
- Exhibits93: Data Table on Market opportunity by End-user ($ million)
- Exhibits94: Analysis of price sensitivity, lifecycle, customer purchase basket, adoption rates, and purchase criteria
- Exhibits95: Chart on Market share By Geographical Landscape 2024-2029 (%)
- Exhibits96: Data Table on Market share By Geographical Landscape 2024-2029 (%)
- Exhibits97: Chart on Geographic comparison
- Exhibits98: Data Table on Geographic comparison
- Exhibits99: Chart on North America - Market size and forecast 2024-2029 ($ million)
- Exhibits100: Data Table on North America - Market size and forecast 2024-2029 ($ million)
- Exhibits101: Chart on North America - Year-over-year growth 2024-2029 (%)
- Exhibits102: Data Table on North America - Year-over-year growth 2024-2029 (%)
- Exhibits103: Chart on Europe - Market size and forecast 2024-2029 ($ million)
- Exhibits104: Data Table on Europe - Market size and forecast 2024-2029 ($ million)
- Exhibits105: Chart on Europe - Year-over-year growth 2024-2029 (%)
- Exhibits106: Data Table on Europe - Year-over-year growth 2024-2029 (%)
- Exhibits107: Chart on APAC - Market size and forecast 2024-2029 ($ million)
- Exhibits108: Data Table on APAC - Market size and forecast 2024-2029 ($ million)
- Exhibits109: Chart on APAC - Year-over-year growth 2024-2029 (%)
- Exhibits110: Data Table on APAC - Year-over-year growth 2024-2029 (%)
- Exhibits111: Chart on Middle East and Africa - Market size and forecast 2024-2029 ($ million)
- Exhibits112: Data Table on Middle East and Africa - Market size and forecast 2024-2029 ($ million)
- Exhibits113: Chart on Middle East and Africa - Year-over-year growth 2024-2029 (%)
- Exhibits114: Data Table on Middle East and Africa - Year-over-year growth 2024-2029 (%)
- Exhibits115: Chart on South America - Market size and forecast 2024-2029 ($ million)
- Exhibits116: Data Table on South America - Market size and forecast 2024-2029 ($ million)
- Exhibits117: Chart on South America - Year-over-year growth 2024-2029 (%)
- Exhibits118: Data Table on South America - Year-over-year growth 2024-2029 (%)
- Exhibits119: Chart on US - Market size and forecast 2024-2029 ($ million)
- Exhibits120: Data Table on US - Market size and forecast 2024-2029 ($ million)
- Exhibits121: Chart on US - Year-over-year growth 2024-2029 (%)
- Exhibits122: Data Table on US - Year-over-year growth 2024-2029 (%)
- Exhibits123: Chart on China - Market size and forecast 2024-2029 ($ million)
- Exhibits124: Data Table on China - Market size and forecast 2024-2029 ($ million)
- Exhibits125: Chart on China - Year-over-year growth 2024-2029 (%)
- Exhibits126: Data Table on China - Year-over-year growth 2024-2029 (%)
- Exhibits127: Chart on Canada - Market size and forecast 2024-2029 ($ million)
- Exhibits128: Data Table on Canada - Market size and forecast 2024-2029 ($ million)
- Exhibits129: Chart on Canada - Year-over-year growth 2024-2029 (%)
- Exhibits130: Data Table on Canada - Year-over-year growth 2024-2029 (%)
- Exhibits131: Chart on UK - Market size and forecast 2024-2029 ($ million)
- Exhibits132: Data Table on UK - Market size and forecast 2024-2029 ($ million)
- Exhibits133: Chart on UK - Year-over-year growth 2024-2029 (%)
- Exhibits134: Data Table on UK - Year-over-year growth 2024-2029 (%)
- Exhibits135: Chart on Germany - Market size and forecast 2024-2029 ($ million)
- Exhibits136: Data Table on Germany - Market size and forecast 2024-2029 ($ million)
- Exhibits137: Chart on Germany - Year-over-year growth 2024-2029 (%)
- Exhibits138: Data Table on Germany - Year-over-year growth 2024-2029 (%)
- Exhibits139: Chart on India - Market size and forecast 2024-2029 ($ million)
- Exhibits140: Data Table on India - Market size and forecast 2024-2029 ($ million)
- Exhibits141: Chart on India - Year-over-year growth 2024-2029 (%)
- Exhibits142: Data Table on India - Year-over-year growth 2024-2029 (%)
- Exhibits143: Chart on France - Market size and forecast 2024-2029 ($ million)
- Exhibits144: Data Table on France - Market size and forecast 2024-2029 ($ million)
- Exhibits145: Chart on France - Year-over-year growth 2024-2029 (%)
- Exhibits146: Data Table on France - Year-over-year growth 2024-2029 (%)
- Exhibits147: Chart on Australia - Market size and forecast 2024-2029 ($ million)
- Exhibits148: Data Table on Australia - Market size and forecast 2024-2029 ($ million)
- Exhibits149: Chart on Australia - Year-over-year growth 2024-2029 (%)
- Exhibits150: Data Table on Australia - Year-over-year growth 2024-2029 (%)
- Exhibits151: Chart on Brazil - Market size and forecast 2024-2029 ($ million)
- Exhibits152: Data Table on Brazil - Market size and forecast 2024-2029 ($ million)
- Exhibits153: Chart on Brazil - Year-over-year growth 2024-2029 (%)
- Exhibits154: Data Table on Brazil - Year-over-year growth 2024-2029 (%)
- Exhibits155: Chart on Saudi Arabia - Market size and forecast 2024-2029 ($ million)
- Exhibits156: Data Table on Saudi Arabia - Market size and forecast 2024-2029 ($ million)
- Exhibits157: Chart on Saudi Arabia - Year-over-year growth 2024-2029 (%)
- Exhibits158: Data Table on Saudi Arabia - Year-over-year growth 2024-2029 (%)
- Exhibits159: Market opportunity By Geographical Landscape ($ million)
- Exhibits160: Data Tables on Market opportunity By Geographical Landscape ($ million)
- Exhibits161: Impact of drivers and challenges in 2024 and 2029
- Exhibits162: Overview on criticality of inputs and factors of differentiation
- Exhibits163: Overview on factors of disruption
- Exhibits164: Impact of key risks on business
- Exhibits165: Companies covered
- Exhibits166: Company ranking index
- Exhibits167: Matrix on companies position and classification
- Exhibits168: AIQ - Overview
- Exhibits169: AIQ - Product / Service
- Exhibits170: AIQ - Key offerings
- Exhibits171: SWOT
- Exhibits172: Amazon Web Services Inc. - Overview
- Exhibits173: Amazon Web Services Inc. - Product / Service
- Exhibits174: Amazon Web Services Inc. - Key news
- Exhibits175: Amazon Web Services Inc. - Key offerings
- Exhibits176: SWOT
- Exhibits177: Baker Hughes Co. - Overview
- Exhibits178: Baker Hughes Co. - Business segments
- Exhibits179: Baker Hughes Co. - Key news
- Exhibits180: Baker Hughes Co. - Key offerings
- Exhibits181: Baker Hughes Co. - Segment focus
- Exhibits182: SWOT
- Exhibits183: C3.ai Inc. - Overview
- Exhibits184: C3.ai Inc. - Product / Service
- Exhibits185: C3.ai Inc. - Key news
- Exhibits186: C3.ai Inc. - Key offerings
- Exhibits187: SWOT
- Exhibits188: Exxon Mobil Corp. - Overview
- Exhibits189: Exxon Mobil Corp. - Business segments
- Exhibits190: Exxon Mobil Corp. - Key news
- Exhibits191: Exxon Mobil Corp. - Key offerings
- Exhibits192: Exxon Mobil Corp. - Segment focus
- Exhibits193: SWOT
- Exhibits194: Google LLC - Overview
- Exhibits195: Google LLC - Product / Service
- Exhibits196: Google LLC - Key offerings
- Exhibits197: SWOT
- Exhibits198: Halliburton Co. - Overview
- Exhibits199: Halliburton Co. - Business segments
- Exhibits200: Halliburton Co. - Key news
- Exhibits201: Halliburton Co. - Key offerings
- Exhibits202: Halliburton Co. - Segment focus
- Exhibits203: SWOT
- Exhibits204: International Business Machines Corp. - Overview
- Exhibits205: International Business Machines Corp. - Business segments
- Exhibits206: International Business Machines Corp. - Key news
- Exhibits207: International Business Machines Corp. - Key offerings
- Exhibits208: International Business Machines Corp. - Segment focus
- Exhibits209: SWOT
- Exhibits210: Microsoft Corp. - Overview
- Exhibits211: Microsoft Corp. - Business segments
- Exhibits212: Microsoft Corp. - Key news
- Exhibits213: Microsoft Corp. - Key offerings
- Exhibits214: Microsoft Corp. - Segment focus
- Exhibits215: SWOT
- Exhibits216: Oracle Corp. - Overview
- Exhibits217: Oracle Corp. - Business segments
- Exhibits218: Oracle Corp. - Key news
- Exhibits219: Oracle Corp. - Key offerings
- Exhibits220: Oracle Corp. - Segment focus
- Exhibits221: SWOT
- Exhibits222: Petroleo Brasileiro SA - Overview
- Exhibits223: Petroleo Brasileiro SA - Business segments
- Exhibits224: Petroleo Brasileiro SA - Key offerings
- Exhibits225: Petroleo Brasileiro SA - Segment focus
- Exhibits226: SWOT
- Exhibits227: Repsol SA - Overview
- Exhibits228: Repsol SA - Business segments
- Exhibits229: Repsol SA - Key news
- Exhibits230: Repsol SA - Key offerings
- Exhibits231: Repsol SA - Segment focus
- Exhibits232: SWOT
- Exhibits233: Schlumberger Ltd. - Overview
- Exhibits234: Schlumberger Ltd. - Business segments
- Exhibits235: Schlumberger Ltd. - Key news
- Exhibits236: Schlumberger Ltd. - Key offerings
- Exhibits237: Schlumberger Ltd. - Segment focus
- Exhibits238: SWOT
- Exhibits239: Shell plc - Overview
- Exhibits240: Shell plc - Business segments
- Exhibits241: Shell plc - Key news
- Exhibits242: Shell plc - Key offerings
- Exhibits243: Shell plc - Segment focus
- Exhibits244: SWOT
- Exhibits245: TotalEnergies SE - Overview
- Exhibits246: TotalEnergies SE - Business segments
- Exhibits247: TotalEnergies SE - Key news
- Exhibits248: TotalEnergies SE - Key offerings
- Exhibits249: TotalEnergies SE - Segment focus
- Exhibits250: SWOT
- Exhibits251: Inclusions checklist
- Exhibits252: Exclusions checklist
- Exhibits253: Currency conversion rates for US$
- Exhibits254: Research methodology
- Exhibits255: Information sources
- Exhibits256: Data validation
- Exhibits257: Validation techniques employed for market sizing
- Exhibits258: Data synthesis
- Exhibits259: 360 degree market analysis
- Exhibits260: List of abbreviations
The generative ai in oil and gas market is forecasted to grow by USD 1,491.3 mn during 2024-2029, accelerating at a CAGR of 33.6% during the forecast period. The report on the generative ai in oil and gas market provides a holistic analysis, market size and forecast, trends, growth drivers, and challenges, as well as vendor analysis covering around 25 vendors.
The report offers an up-to-date analysis regarding the current market scenario, the latest trends and drivers, and the overall market environment. The market is driven by unrelenting imperative for operational efficiency and cost reduction, accelerated maturation of ai technology and scalable digital infrastructure, and mounting pressures for enhanced sustainability and energy transition.
| Market Scope | |
|---|---|
| Base Year | 2025 |
| End Year | 2029 |
| Series Year | 2025-2029 |
| Growth Momentum | Accelerate |
| YOY 2025 | 31.5% |
| CAGR | 33.6% |
| Incremental Value | $1,491.3 mn |
The study was conducted using an objective combination of primary and secondary information including inputs from key participants in the industry. The report contains a comprehensive market size data, segment with regional analysis and vendor landscape in addition to an analysis of the key companies. Reports have historic and forecast data.
Technavio's generative ai in oil and gas market is segmented as below:
By Component
- Solutions
- Services
By Application
- Exploration and production
- Reservoir management
- Risk management
- Supply chain optimization
- Others
By End-user
- Data analysis and insights
- Automation and efficiency
- Risk management and safety
- Innovation and sustainability
By Geographical Landscape
- North America
- Europe
- APAC
- Middle East and Africa
- South America
This study identifies the development of proprietary and domain-specific generative models as one of the prime reasons driving the generative ai in oil and gas market growth during the next few years. Also, integration with digital twins toward an industrial metaverse and rise of ai copilots and human-in-the-loop augmentation will lead to sizable demand in the market.
The report on the generative ai in oil and gas market covers the following areas:
- Generative AI In Oil And Gas Market sizing
- Generative AI In Oil And Gas Market forecast
- Generative AI In Oil And Gas Market industry analysis
The robust vendor analysis is designed to help clients improve their market position, and in line with this, this report provides a detailed analysis of several leading generative ai in oil and gas market vendors that include AIQ, Amazon Web Services Inc., Aspen Technology Inc., Baker Hughes Co., C3.ai Inc., DataRobot Inc., Equinor ASA, Exxon Mobil Corp., Google LLC, Halliburton Co., Infosys Ltd., International Business Machines Corp., Microsoft Corp., Oracle Corp., Petroleo Brasileiro SA, Repsol SA, Schlumberger Ltd., Shell plc, Tata Consultancy Services Ltd., and TotalEnergies SE. Also, the generative ai in oil and gas market analysis report includes information on upcoming trends and challenges that will influence market growth. This is to help companies strategize and leverage all forthcoming growth opportunities.
The publisher presents a detailed picture of the market by the way of study, synthesis, and summation of data from multiple sources by an analysis of key parameters such as profit, pricing, competition, and promotions. It presents various market facets by identifying the key industry influencers. The data presented is comprehensive, reliable, and a result of extensive primary and secondary research. The market research reports provide a complete competitive landscape and an in-depth vendor selection methodology and analysis using qualitative and quantitative research to forecast accurate market growth.
Table of Contents
1 Executive Summary
- 1.1 Market overview
- Executive Summary - Chart on Market Overview
- Executive Summary - Data Table on Market Overview
- Executive Summary - Chart on Global Market Characteristics
- Executive Summary - Chart on Market By Geographical Landscape
- Executive Summary - Chart on Market Segmentation by Component
- Executive Summary - Chart on Market Segmentation by Application
- Executive Summary - Chart on Market Segmentation by End-user
- Executive Summary - Chart on Incremental Growth
- Executive Summary - Data Table on Incremental Growth
- Executive Summary - Chart on Company Market Positioning
2 Technavio Analysis
- 2.1 Analysis of price sensitivity, lifecycle, customer purchase basket, adoption rates, and purchase criteria
- Analysis of price sensitivity, lifecycle, customer purchase basket, adoption rates, and purchase criteria
- 2.2 Criticality of inputs and Factors of differentiation
- Overview on criticality of inputs and factors of differentiation
- 2.3 Factors of disruption
- Overview on factors of disruption
- 2.4 Impact of drivers and challenges
- Impact of drivers and challenges in 2024 and 2029
3 Market Landscape
- 3.1 Market ecosystem
- Parent Market
- Data Table on - Parent Market
- 3.2 Market characteristics
- Market characteristics analysis
- 3.3 Value chain analysis
- Value chain analysis
4 Market Sizing
- 4.1 Market definition
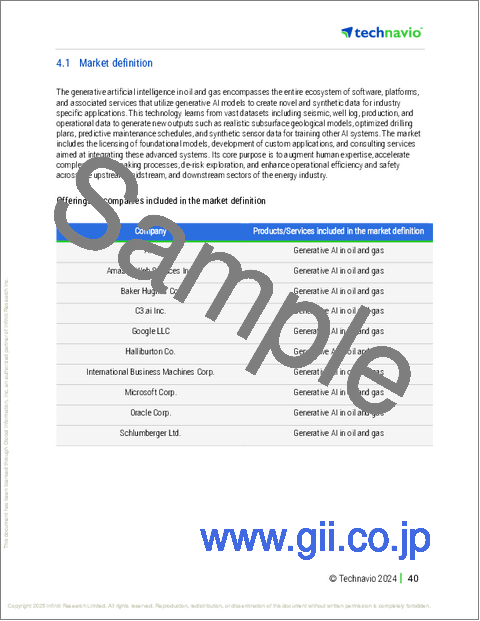
- Offerings of companies included in the market definition
- 4.2 Market segment analysis
- Market segments
- 4.3 Market size 2024
- 4.4 Market outlook: Forecast for 2024-2029
- Chart on Global - Market size and forecast 2024-2029 ($ million)
- Data Table on Global - Market size and forecast 2024-2029 ($ million)
- Chart on Global Market: Year-over-year growth 2024-2029 (%)
- Data Table on Global Market: Year-over-year growth 2024-2029 (%)
5 Five Forces Analysis
- 5.1 Five forces summary
- Five forces analysis - Comparison between 2024 and 2029
- 5.2 Bargaining power of buyers
- Bargaining power of buyers - Impact of key factors 2024 and 2029
- 5.3 Bargaining power of suppliers
- Bargaining power of suppliers - Impact of key factors in 2024 and 2029
- 5.4 Threat of new entrants
- Threat of new entrants - Impact of key factors in 2024 and 2029
- 5.5 Threat of substitutes
- Threat of substitutes - Impact of key factors in 2024 and 2029
- 5.6 Threat of rivalry
- Threat of rivalry - Impact of key factors in 2024 and 2029
- 5.7 Market condition
- Chart on Market condition - Five forces 2024 and 2029
6 Market Segmentation by Component
- 6.1 Market segments
- Chart on Component - Market share 2024-2029 (%)
- Data Table on Component - Market share 2024-2029 (%)
- 6.2 Comparison by Component
- Chart on Comparison by Component
- Data Table on Comparison by Component
- 6.3 Solutions - Market size and forecast 2024-2029
- Chart on Solutions - Market size and forecast 2024-2029 ($ million)
- Data Table on Solutions - Market size and forecast 2024-2029 ($ million)
- Chart on Solutions - Year-over-year growth 2024-2029 (%)
- Data Table on Solutions - Year-over-year growth 2024-2029 (%)
- 6.4 Services - Market size and forecast 2024-2029
- Chart on Services - Market size and forecast 2024-2029 ($ million)
- Data Table on Services - Market size and forecast 2024-2029 ($ million)
- Chart on Services - Year-over-year growth 2024-2029 (%)
- Data Table on Services - Year-over-year growth 2024-2029 (%)
- 6.5 Market opportunity by Component
- Market opportunity by Component ($ million)
- Data Table on Market opportunity by Component ($ million)
7 Market Segmentation by Application
- 7.1 Market segments
- Chart on Application - Market share 2024-2029 (%)
- Data Table on Application - Market share 2024-2029 (%)
- 7.2 Comparison by Application
- Chart on Comparison by Application
- Data Table on Comparison by Application
- 7.3 Exploration and production - Market size and forecast 2024-2029
- Chart on Exploration and production - Market size and forecast 2024-2029 ($ million)
- Data Table on Exploration and production - Market size and forecast 2024-2029 ($ million)
- Chart on Exploration and production - Year-over-year growth 2024-2029 (%)
- Data Table on Exploration and production - Year-over-year growth 2024-2029 (%)
- 7.4 Reservoir management - Market size and forecast 2024-2029
- Chart on Reservoir management - Market size and forecast 2024-2029 ($ million)
- Data Table on Reservoir management - Market size and forecast 2024-2029 ($ million)
- Chart on Reservoir management - Year-over-year growth 2024-2029 (%)
- Data Table on Reservoir management - Year-over-year growth 2024-2029 (%)
- 7.5 Risk management - Market size and forecast 2024-2029
- Chart on Risk management - Market size and forecast 2024-2029 ($ million)
- Data Table on Risk management - Market size and forecast 2024-2029 ($ million)
- Chart on Risk management - Year-over-year growth 2024-2029 (%)
- Data Table on Risk management - Year-over-year growth 2024-2029 (%)
- 7.6 Supply chain optimization - Market size and forecast 2024-2029
- Chart on Supply chain optimization - Market size and forecast 2024-2029 ($ million)
- Data Table on Supply chain optimization - Market size and forecast 2024-2029 ($ million)
- Chart on Supply chain optimization - Year-over-year growth 2024-2029 (%)
- Data Table on Supply chain optimization - Year-over-year growth 2024-2029 (%)
- 7.7 Others - Market size and forecast 2024-2029
- Chart on Others - Market size and forecast 2024-2029 ($ million)
- Data Table on Others - Market size and forecast 2024-2029 ($ million)
- Chart on Others - Year-over-year growth 2024-2029 (%)
- Data Table on Others - Year-over-year growth 2024-2029 (%)
- 7.8 Market opportunity by Application
- Market opportunity by Application ($ million)
- Data Table on Market opportunity by Application ($ million)
8 Market Segmentation by End-user
- 8.1 Market segments
- Chart on End-user - Market share 2024-2029 (%)
- Data Table on End-user - Market share 2024-2029 (%)
- 8.2 Comparison by End-user
- Chart on Comparison by End-user
- Data Table on Comparison by End-user
- 8.3 Data analysis and insights - Market size and forecast 2024-2029
- Chart on Data analysis and insights - Market size and forecast 2024-2029 ($ million)
- Data Table on Data analysis and insights - Market size and forecast 2024-2029 ($ million)
- Chart on Data analysis and insights - Year-over-year growth 2024-2029 (%)
- Data Table on Data analysis and insights - Year-over-year growth 2024-2029 (%)
- 8.4 Automation and efficiency - Market size and forecast 2024-2029
- Chart on Automation and efficiency - Market size and forecast 2024-2029 ($ million)
- Data Table on Automation and efficiency - Market size and forecast 2024-2029 ($ million)
- Chart on Automation and efficiency - Year-over-year growth 2024-2029 (%)
- Data Table on Automation and efficiency - Year-over-year growth 2024-2029 (%)
- 8.5 Risk management and safety - Market size and forecast 2024-2029
- Chart on Risk management and safety - Market size and forecast 2024-2029 ($ million)
- Data Table on Risk management and safety - Market size and forecast 2024-2029 ($ million)
- Chart on Risk management and safety - Year-over-year growth 2024-2029 (%)
- Data Table on Risk management and safety - Year-over-year growth 2024-2029 (%)
- 8.6 Innovation and sustainability - Market size and forecast 2024-2029
- Chart on Innovation and sustainability - Market size and forecast 2024-2029 ($ million)
- Data Table on Innovation and sustainability - Market size and forecast 2024-2029 ($ million)
- Chart on Innovation and sustainability - Year-over-year growth 2024-2029 (%)
- Data Table on Innovation and sustainability - Year-over-year growth 2024-2029 (%)
- 8.7 Market opportunity by End-user
- Market opportunity by End-user ($ million)
- Data Table on Market opportunity by End-user ($ million)
9 Customer Landscape
- 9.1 Customer landscape overview
- Analysis of price sensitivity, lifecycle, customer purchase basket, adoption rates, and purchase criteria
10 Geographic Landscape
- 10.1 Geographic segmentation
- Chart on Market share By Geographical Landscape 2024-2029 (%)
- Data Table on Market share By Geographical Landscape 2024-2029 (%)
- 10.2 Geographic comparison
- Chart on Geographic comparison
- Data Table on Geographic comparison
- 10.3 North America - Market size and forecast 2024-2029
- Chart on North America - Market size and forecast 2024-2029 ($ million)
- Data Table on North America - Market size and forecast 2024-2029 ($ million)
- Chart on North America - Year-over-year growth 2024-2029 (%)
- Data Table on North America - Year-over-year growth 2024-2029 (%)
- 10.4 Europe - Market size and forecast 2024-2029
- Chart on Europe - Market size and forecast 2024-2029 ($ million)
- Data Table on Europe - Market size and forecast 2024-2029 ($ million)
- Chart on Europe - Year-over-year growth 2024-2029 (%)
- Data Table on Europe - Year-over-year growth 2024-2029 (%)
- 10.5 APAC - Market size and forecast 2024-2029
- Chart on APAC - Market size and forecast 2024-2029 ($ million)
- Data Table on APAC - Market size and forecast 2024-2029 ($ million)
- Chart on APAC - Year-over-year growth 2024-2029 (%)
- Data Table on APAC - Year-over-year growth 2024-2029 (%)
- 10.6 Middle East and Africa - Market size and forecast 2024-2029
- Chart on Middle East and Africa - Market size and forecast 2024-2029 ($ million)
- Data Table on Middle East and Africa - Market size and forecast 2024-2029 ($ million)
- Chart on Middle East and Africa - Year-over-year growth 2024-2029 (%)
- Data Table on Middle East and Africa - Year-over-year growth 2024-2029 (%)
- 10.7 South America - Market size and forecast 2024-2029
- Chart on South America - Market size and forecast 2024-2029 ($ million)
- Data Table on South America - Market size and forecast 2024-2029 ($ million)
- Chart on South America - Year-over-year growth 2024-2029 (%)
- Data Table on South America - Year-over-year growth 2024-2029 (%)
- 10.8 US - Market size and forecast 2024-2029
- Chart on US - Market size and forecast 2024-2029 ($ million)
- Data Table on US - Market size and forecast 2024-2029 ($ million)
- Chart on US - Year-over-year growth 2024-2029 (%)
- Data Table on US - Year-over-year growth 2024-2029 (%)
- 10.9 China - Market size and forecast 2024-2029
- Chart on China - Market size and forecast 2024-2029 ($ million)
- Data Table on China - Market size and forecast 2024-2029 ($ million)
- Chart on China - Year-over-year growth 2024-2029 (%)
- Data Table on China - Year-over-year growth 2024-2029 (%)
- 10.10 Canada - Market size and forecast 2024-2029
- Chart on Canada - Market size and forecast 2024-2029 ($ million)
- Data Table on Canada - Market size and forecast 2024-2029 ($ million)
- Chart on Canada - Year-over-year growth 2024-2029 (%)
- Data Table on Canada - Year-over-year growth 2024-2029 (%)
- 10.11 UK - Market size and forecast 2024-2029
- Chart on UK - Market size and forecast 2024-2029 ($ million)
- Data Table on UK - Market size and forecast 2024-2029 ($ million)
- Chart on UK - Year-over-year growth 2024-2029 (%)
- Data Table on UK - Year-over-year growth 2024-2029 (%)
- 10.12 Germany - Market size and forecast 2024-2029
- Chart on Germany - Market size and forecast 2024-2029 ($ million)
- Data Table on Germany - Market size and forecast 2024-2029 ($ million)
- Chart on Germany - Year-over-year growth 2024-2029 (%)
- Data Table on Germany - Year-over-year growth 2024-2029 (%)
- 10.13 India - Market size and forecast 2024-2029
- Chart on India - Market size and forecast 2024-2029 ($ million)
- Data Table on India - Market size and forecast 2024-2029 ($ million)
- Chart on India - Year-over-year growth 2024-2029 (%)
- Data Table on India - Year-over-year growth 2024-2029 (%)
- 10.14 France - Market size and forecast 2024-2029
- Chart on France - Market size and forecast 2024-2029 ($ million)
- Data Table on France - Market size and forecast 2024-2029 ($ million)
- Chart on France - Year-over-year growth 2024-2029 (%)
- Data Table on France - Year-over-year growth 2024-2029 (%)
- 10.15 Australia - Market size and forecast 2024-2029
- Chart on Australia - Market size and forecast 2024-2029 ($ million)
- Data Table on Australia - Market size and forecast 2024-2029 ($ million)
- Chart on Australia - Year-over-year growth 2024-2029 (%)
- Data Table on Australia - Year-over-year growth 2024-2029 (%)
- 10.16 Brazil - Market size and forecast 2024-2029
- Chart on Brazil - Market size and forecast 2024-2029 ($ million)
- Data Table on Brazil - Market size and forecast 2024-2029 ($ million)
- Chart on Brazil - Year-over-year growth 2024-2029 (%)
- Data Table on Brazil - Year-over-year growth 2024-2029 (%)
- 10.17 Saudi Arabia - Market size and forecast 2024-2029
- Chart on Saudi Arabia - Market size and forecast 2024-2029 ($ million)
- Data Table on Saudi Arabia - Market size and forecast 2024-2029 ($ million)
- Chart on Saudi Arabia - Year-over-year growth 2024-2029 (%)
- Data Table on Saudi Arabia - Year-over-year growth 2024-2029 (%)
- 10.18 Market opportunity By Geographical Landscape
- Market opportunity By Geographical Landscape ($ million)
- Data Tables on Market opportunity By Geographical Landscape ($ million)
11 Drivers, Challenges, and Opportunity/Restraints
- 11.1 Market drivers
- 11.2 Market challenges
- 11.3 Impact of drivers and challenges
- Impact of drivers and challenges in 2024 and 2029
- 11.4 Market opportunities/restraints
12 Competitive Landscape
- 12.1 Overview
- 12.2 Competitive Landscape
- Overview on criticality of inputs and factors of differentiation
- 12.3 Landscape disruption
- Overview on factors of disruption
- 12.4 Industry risks
- Impact of key risks on business
13 Competitive Analysis
- 13.1 Companies profiled
- Companies covered
- 13.2 Company ranking index
- Company ranking index
- 13.3 Market positioning of companies
- Matrix on companies position and classification
- 13.4 AIQ
- AIQ - Overview
- AIQ - Product / Service
- AIQ - Key offerings
- SWOT
- 13.5 Amazon Web Services Inc.
- Amazon Web Services Inc. - Overview
- Amazon Web Services Inc. - Product / Service
- Amazon Web Services Inc. - Key news
- Amazon Web Services Inc. - Key offerings
- SWOT
- 13.6 Baker Hughes Co.
- Baker Hughes Co. - Overview
- Baker Hughes Co. - Business segments
- Baker Hughes Co. - Key news
- Baker Hughes Co. - Key offerings
- Baker Hughes Co. - Segment focus
- SWOT
- 13.7 C3.ai Inc.
- C3.ai Inc. - Overview
- C3.ai Inc. - Product / Service
- C3.ai Inc. - Key news
- C3.ai Inc. - Key offerings
- SWOT
- 13.8 Exxon Mobil Corp.
- Exxon Mobil Corp. - Overview
- Exxon Mobil Corp. - Business segments
- Exxon Mobil Corp. - Key news
- Exxon Mobil Corp. - Key offerings
- Exxon Mobil Corp. - Segment focus
- SWOT
- 13.9 Google LLC
- Google LLC - Overview
- Google LLC - Product / Service
- Google LLC - Key offerings
- SWOT
- 13.10 Halliburton Co.
- Halliburton Co. - Overview
- Halliburton Co. - Business segments
- Halliburton Co. - Key news
- Halliburton Co. - Key offerings
- Halliburton Co. - Segment focus
- SWOT
- 13.11 International Business Machines Corp.
- International Business Machines Corp. - Overview
- International Business Machines Corp. - Business segments
- International Business Machines Corp. - Key news
- International Business Machines Corp. - Key offerings
- International Business Machines Corp. - Segment focus
- SWOT
- 13.12 Microsoft Corp.
- Microsoft Corp. - Overview
- Microsoft Corp. - Business segments
- Microsoft Corp. - Key news
- Microsoft Corp. - Key offerings
- Microsoft Corp. - Segment focus
- SWOT
- 13.13 Oracle Corp.
- Oracle Corp. - Overview
- Oracle Corp. - Business segments
- Oracle Corp. - Key news
- Oracle Corp. - Key offerings
- Oracle Corp. - Segment focus
- SWOT
- 13.14 Petroleo Brasileiro SA
- Petroleo Brasileiro SA - Overview
- Petroleo Brasileiro SA - Business segments
- Petroleo Brasileiro SA - Key offerings
- Petroleo Brasileiro SA - Segment focus
- SWOT
- 13.15 Repsol SA
- Repsol SA - Overview
- Repsol SA - Business segments
- Repsol SA - Key news
- Repsol SA - Key offerings
- Repsol SA - Segment focus
- SWOT
- 13.16 Schlumberger Ltd.
- Schlumberger Ltd. - Overview
- Schlumberger Ltd. - Business segments
- Schlumberger Ltd. - Key news
- Schlumberger Ltd. - Key offerings
- Schlumberger Ltd. - Segment focus
- SWOT
- 13.17 Shell plc
- Shell plc - Overview
- Shell plc - Business segments
- Shell plc - Key news
- Shell plc - Key offerings
- Shell plc - Segment focus
- SWOT
- 13.18 TotalEnergies SE
- TotalEnergies SE - Overview
- TotalEnergies SE - Business segments
- TotalEnergies SE - Key news
- TotalEnergies SE - Key offerings
- TotalEnergies SE - Segment focus
- SWOT
14 Appendix
- 14.1 Scope of the report
- 14.2 Inclusions and exclusions checklist
- Inclusions checklist
- Exclusions checklist
- 14.3 Currency conversion rates for US$
- Currency conversion rates for US$
- 14.4 Research methodology
- Research methodology
- 14.5 Data procurement
- Information sources
- 14.6 Data validation
- Data validation
- 14.7 Validation techniques employed for market sizing
- Validation techniques employed for market sizing
- 14.8 Data synthesis
- Data synthesis
- 14.9 360 degree market analysis
- 360 degree market analysis
- 14.10 List of abbreviations
- List of abbreviations

