|
|
市場調査レポート
商品コード
1748575
パワースポーツ用バッテリーの世界市場、2025~2029年Global Powersports Batteries Market 2025-2029 |
||||||

|
|||||||
カスタマイズ可能
|
|||||||


| パワースポーツ用バッテリーの世界市場、2025~2029年 |
|
出版日: 2025年06月07日
発行: TechNavio
ページ情報: 英文 217 Pages
納期: 即納可能
|

全表示
- 概要
- 図表
- 目次
パワースポーツ用バッテリー市場は2024~2029年に23億3,840万米ドル、予測期間中のCAGRは4.6%で成長すると予測されます。
当レポートでは、パワースポーツ用バッテリー市場の全体的な分析、市場規模・予測、動向、成長促進要因、課題、約25のベンダーを網羅したベンダー分析などを掲載しています。
現在の市場シナリオ、最新動向と促進要因、市場環境全体に関する最新分析を提供しています。市場を牽引しているのは、電動二輪車セグメントに参入する大手二輪車OEM、レクリエーションや冒険的なスポーツ活動のためのATV需要の増加、バッテリー技術の進歩などがあります。
| 市場範囲 | |
|---|---|
| 基準年 | 2025年 |
| 終了年 | 2029年 |
| 予測期間 | 2025~2029年 |
| 成長モメンタム | 加速 |
| 前年比 | 4.3% |
| CAGR | 4.6% |
| 増分額 | 23億3,840万米ドル |
本調査は、産業の主要参加者からのインプットを含め、一次情報と二次情報を客観的に組み合わせて実施しました。レポートには、主要企業の分析に加え、包括的な市場規模データ、地域別分析によるセグメント、ベンダー情勢が含まれています。レポートには過去データと予測データがあります。
本調査では、今後数年間におけるパワースポーツ用バッテリー市場の成長を促進する主要因の一つとして、全電動二輪車レースの新たな動向を挙げています。また、電気自動車やハイブリッドパワースポーツカーの台頭やモータースポーツ人気の高まりは、市場の大きな需要につながると考えられます。
目次
第1章 エグゼクティブサマリー
- 市場概要
第2章 Technavio分析
- 価格・ライフサイクル・顧客購入バスケット・採用率・購入基準の分析
- インプットの重要性と差別化の要因
- 混乱の要因
- 促進要因と課題の影響
第3章 市場情勢
- 市場エコシステム
- 市場の特徴
- バリューチェーン分析
第4章 市場規模
- 市場の定義
- 市場セグメント分析
- 市場規模 2024年
- 市場の展望 2024~2029年
第5章 市場規模実績
- パワースポーツ用バッテリーの世界市場 2019~2023年
- 車種別セグメント分析 2019~2023年
- チャネル別セグメント分析 2019~2023年
- バッテリータイプ別セグメント分析 2019~2023年
- 地域別セグメント分析 2019~2023年
- 国別セグメント分析 2019~2023年
第6章 定性分析
- AIの影響:パワースポーツ用バッテリーの世界市場
第7章 ファイブフォース分析
- ファイブフォースの要約
- 買い手の交渉力
- 供給企業の交渉力
- 新規参入業者の脅威
- 代替品の脅威
- 競争の脅威
- 市況
第8章 市場セグメンテーション:車種別
- 市場セグメント
- 比較:車種別
- 二輪車:市場規模と予測 2024~2029年
- ATVとUTV:市場規模と予測 2024~2029年
- モペットとスクーター:市場規模と予測 2024~2029年
- その他:市場規模と予測 2024~2029年
- 市場機会:車種別
第9章 市場セグメンテーション:チャネル別
- 市場セグメント
- 比較:チャネル別
- アフターマーケット:市場規模と予測 2024~2029年
- OEM:市場規模と予測 2024~2029年
- 市場機会:チャネル別
第10章 市場セグメンテーション:バッテリータイプ別
- 市場セグメント
- 比較:バッテリータイプ別
- ニッケル水素(NiMH):市場規模と予測 2024~2029年
- リン酸鉄リチウム(LiFePO4):市場規模と予測 2024~2029年
- 市場機会:バッテリータイプ別
第11章 顧客情勢
- 顧客情勢概要
第12章 地域別情勢
- 地域別セグメンテーション
- 比較:地域別
- アジア太平洋:市場規模と予測 2024~2029年
- 北米:市場規模と予測 2024~2029年
- 欧州:市場規模と予測 2024~2029年
- 南米:市場規模と予測 2024~2029年
- 中東・アフリカ:市場規模と予測 2024~2029年
- 米国:市場規模と予測 2024~2029年
- 中国:市場規模と予測 2024~2029年
- インド:市場規模と予測 2024~2029年
- 日本:市場規模と予測 2024~2029年
- 韓国:市場規模と予測 2024~2029年
- ドイツ:市場規模と予測 2024~2029年
- オーストラリア:市場規模と予測 2024~2029年
- 英国:市場規模と予測 2024~2029年
- カナダ:市場規模と予測 2024~2029年
- フランス:市場規模と予測 2024~2029年
- 地域情勢による市場機会
第13章 促進要因・課題・機会・抑制要因
- 市場促進要因
- 市場課題
- 促進要因と課題の影響
- 市場機会・抑制要因
第14章 競合情勢
- 概要
- 競合情勢
- 混乱の状況
- 産業のリスク
第15章 競合分析
- 企業プロファイル
- 企業ランキング指数
- 企業の市場ポジショニング
- CLARIOS LLC
- Discover Battery
- EnerSys
- Exide Industries Ltd.
- GS Yuasa International Ltd.
- Interstate Batteries Inc.
- Johnson Controls International Plc
- PAM Vilicar doo
- Power Sonic Corp.
- Poweroad Xiamen Renewable Energy Technology Co. Ltd.
- Robert Bosch GmbH
- Scorpion Battery Inc.
- Super B Lithium Power B.V.
- The NOCO Co.
- Trojan Battery Co. LLC
第16章 付録
Exhibits:
- Exhibits1: Executive Summary - Chart on Market Overview
- Exhibits2: Executive Summary - Data Table on Market Overview
- Exhibits3: Executive Summary - Chart on Global Market Characteristics
- Exhibits4: Executive Summary - Chart on Market By Geographical Landscape
- Exhibits5: Executive Summary - Chart on Market Segmentation by Vehicle Type
- Exhibits6: Executive Summary - Chart on Market Segmentation by Channel
- Exhibits7: Executive Summary - Chart on Market Segmentation by Battery Type
- Exhibits8: Executive Summary - Chart on Incremental Growth
- Exhibits9: Executive Summary - Data Table on Incremental Growth
- Exhibits10: Executive Summary - Chart on Company Market Positioning
- Exhibits11: Analysis of price sensitivity, lifecycle, customer purchase basket, adoption rates, and purchase criteria
- Exhibits12: Overview on criticality of inputs and factors of differentiation
- Exhibits13: Overview on factors of disruption
- Exhibits14: Impact of drivers and challenges in 2024 and 2029
- Exhibits15: Parent Market
- Exhibits16: Data Table on - Parent Market
- Exhibits17: Market characteristics analysis
- Exhibits18: Value chain analysis
- Exhibits19: Offerings of companies included in the market definition
- Exhibits20: Market segments
- Exhibits21: Chart on Global - Market size and forecast 2024-2029 ($ million)
- Exhibits22: Data Table on Global - Market size and forecast 2024-2029 ($ million)
- Exhibits23: Chart on Global Market: Year-over-year growth 2024-2029 (%)
- Exhibits24: Data Table on Global Market: Year-over-year growth 2024-2029 (%)
- Exhibits25: Historic Market Size - Data Table on Global Powersports Batteries Market 2019 - 2023 ($ million)
- Exhibits26: Historic Market Size - Vehicle Type Segment 2019 - 2023 ($ million)
- Exhibits27: Historic Market Size - Channel Segment 2019 - 2023 ($ million)
- Exhibits28: Historic Market Size - Battery Type Segment 2019 - 2023 ($ million)
- Exhibits29: Historic Market Size - Geography Segment 2019 - 2023 ($ million)
- Exhibits30: Historic Market Size - Country Segment 2019 - 2023 ($ million)
- Exhibits31: Five forces analysis - Comparison between 2024 and 2029
- Exhibits32: Bargaining power of buyers - Impact of key factors 2024 and 2029
- Exhibits33: Bargaining power of suppliers - Impact of key factors in 2024 and 2029
- Exhibits34: Threat of new entrants - Impact of key factors in 2024 and 2029
- Exhibits35: Threat of substitutes - Impact of key factors in 2024 and 2029
- Exhibits36: Threat of rivalry - Impact of key factors in 2024 and 2029
- Exhibits37: Chart on Market condition - Five forces 2024 and 2029
- Exhibits38: Chart on Vehicle Type - Market share 2024-2029 (%)
- Exhibits39: Data Table on Vehicle Type - Market share 2024-2029 (%)
- Exhibits40: Chart on Comparison by Vehicle Type
- Exhibits41: Data Table on Comparison by Vehicle Type
- Exhibits42: Chart on Motorcycles - Market size and forecast 2024-2029 ($ million)
- Exhibits43: Data Table on Motorcycles - Market size and forecast 2024-2029 ($ million)
- Exhibits44: Chart on Motorcycles - Year-over-year growth 2024-2029 (%)
- Exhibits45: Data Table on Motorcycles - Year-over-year growth 2024-2029 (%)
- Exhibits46: Chart on ATVs and UTVs - Market size and forecast 2024-2029 ($ million)
- Exhibits47: Data Table on ATVs and UTVs - Market size and forecast 2024-2029 ($ million)
- Exhibits48: Chart on ATVs and UTVs - Year-over-year growth 2024-2029 (%)
- Exhibits49: Data Table on ATVs and UTVs - Year-over-year growth 2024-2029 (%)
- Exhibits50: Chart on Mopeds and scooters - Market size and forecast 2024-2029 ($ million)
- Exhibits51: Data Table on Mopeds and scooters - Market size and forecast 2024-2029 ($ million)
- Exhibits52: Chart on Mopeds and scooters - Year-over-year growth 2024-2029 (%)
- Exhibits53: Data Table on Mopeds and scooters - Year-over-year growth 2024-2029 (%)
- Exhibits54: Chart on Others - Market size and forecast 2024-2029 ($ million)
- Exhibits55: Data Table on Others - Market size and forecast 2024-2029 ($ million)
- Exhibits56: Chart on Others - Year-over-year growth 2024-2029 (%)
- Exhibits57: Data Table on Others - Year-over-year growth 2024-2029 (%)
- Exhibits58: Market opportunity by Vehicle Type ($ million)
- Exhibits59: Data Table on Market opportunity by Vehicle Type ($ million)
- Exhibits60: Chart on Channel - Market share 2024-2029 (%)
- Exhibits61: Data Table on Channel - Market share 2024-2029 (%)
- Exhibits62: Chart on Comparison by Channel
- Exhibits63: Data Table on Comparison by Channel
- Exhibits64: Chart on Aftermarket - Market size and forecast 2024-2029 ($ million)
- Exhibits65: Data Table on Aftermarket - Market size and forecast 2024-2029 ($ million)
- Exhibits66: Chart on Aftermarket - Year-over-year growth 2024-2029 (%)
- Exhibits67: Data Table on Aftermarket - Year-over-year growth 2024-2029 (%)
- Exhibits68: Chart on OEM - Market size and forecast 2024-2029 ($ million)
- Exhibits69: Data Table on OEM - Market size and forecast 2024-2029 ($ million)
- Exhibits70: Chart on OEM - Year-over-year growth 2024-2029 (%)
- Exhibits71: Data Table on OEM - Year-over-year growth 2024-2029 (%)
- Exhibits72: Market opportunity by Channel ($ million)
- Exhibits73: Data Table on Market opportunity by Channel ($ million)
- Exhibits74: Chart on Battery Type - Market share 2024-2029 (%)
- Exhibits75: Data Table on Battery Type - Market share 2024-2029 (%)
- Exhibits76: Chart on Comparison by Battery Type
- Exhibits77: Data Table on Comparison by Battery Type
- Exhibits78: Chart on Nickel-metal hydride (NiMH) - Market size and forecast 2024-2029 ($ million)
- Exhibits79: Data Table on Nickel-metal hydride (NiMH) - Market size and forecast 2024-2029 ($ million)
- Exhibits80: Chart on Nickel-metal hydride (NiMH) - Year-over-year growth 2024-2029 (%)
- Exhibits81: Data Table on Nickel-metal hydride (NiMH) - Year-over-year growth 2024-2029 (%)
- Exhibits82: Chart on Lithium-iron phosphate (LiFePO4) - Market size and forecast 2024-2029 ($ million)
- Exhibits83: Data Table on Lithium-iron phosphate (LiFePO4) - Market size and forecast 2024-2029 ($ million)
- Exhibits84: Chart on Lithium-iron phosphate (LiFePO4) - Year-over-year growth 2024-2029 (%)
- Exhibits85: Data Table on Lithium-iron phosphate (LiFePO4) - Year-over-year growth 2024-2029 (%)
- Exhibits86: Market opportunity by Battery Type ($ million)
- Exhibits87: Data Table on Market opportunity by Battery Type ($ million)
- Exhibits88: Analysis of price sensitivity, lifecycle, customer purchase basket, adoption rates, and purchase criteria
- Exhibits89: Chart on Market share By Geographical Landscape 2024-2029 (%)
- Exhibits90: Data Table on Market share By Geographical Landscape 2024-2029 (%)
- Exhibits91: Chart on Geographic comparison
- Exhibits92: Data Table on Geographic comparison
- Exhibits93: Chart on APAC - Market size and forecast 2024-2029 ($ million)
- Exhibits94: Data Table on APAC - Market size and forecast 2024-2029 ($ million)
- Exhibits95: Chart on APAC - Year-over-year growth 2024-2029 (%)
- Exhibits96: Data Table on APAC - Year-over-year growth 2024-2029 (%)
- Exhibits97: Chart on North America - Market size and forecast 2024-2029 ($ million)
- Exhibits98: Data Table on North America - Market size and forecast 2024-2029 ($ million)
- Exhibits99: Chart on North America - Year-over-year growth 2024-2029 (%)
- Exhibits100: Data Table on North America - Year-over-year growth 2024-2029 (%)
- Exhibits101: Chart on Europe - Market size and forecast 2024-2029 ($ million)
- Exhibits102: Data Table on Europe - Market size and forecast 2024-2029 ($ million)
- Exhibits103: Chart on Europe - Year-over-year growth 2024-2029 (%)
- Exhibits104: Data Table on Europe - Year-over-year growth 2024-2029 (%)
- Exhibits105: Chart on South America - Market size and forecast 2024-2029 ($ million)
- Exhibits106: Data Table on South America - Market size and forecast 2024-2029 ($ million)
- Exhibits107: Chart on South America - Year-over-year growth 2024-2029 (%)
- Exhibits108: Data Table on South America - Year-over-year growth 2024-2029 (%)
- Exhibits109: Chart on Middle East and Africa - Market size and forecast 2024-2029 ($ million)
- Exhibits110: Data Table on Middle East and Africa - Market size and forecast 2024-2029 ($ million)
- Exhibits111: Chart on Middle East and Africa - Year-over-year growth 2024-2029 (%)
- Exhibits112: Data Table on Middle East and Africa - Year-over-year growth 2024-2029 (%)
- Exhibits113: Chart on US - Market size and forecast 2024-2029 ($ million)
- Exhibits114: Data Table on US - Market size and forecast 2024-2029 ($ million)
- Exhibits115: Chart on US - Year-over-year growth 2024-2029 (%)
- Exhibits116: Data Table on US - Year-over-year growth 2024-2029 (%)
- Exhibits117: Chart on China - Market size and forecast 2024-2029 ($ million)
- Exhibits118: Data Table on China - Market size and forecast 2024-2029 ($ million)
- Exhibits119: Chart on China - Year-over-year growth 2024-2029 (%)
- Exhibits120: Data Table on China - Year-over-year growth 2024-2029 (%)
- Exhibits121: Chart on India - Market size and forecast 2024-2029 ($ million)
- Exhibits122: Data Table on India - Market size and forecast 2024-2029 ($ million)
- Exhibits123: Chart on India - Year-over-year growth 2024-2029 (%)
- Exhibits124: Data Table on India - Year-over-year growth 2024-2029 (%)
- Exhibits125: Chart on Japan - Market size and forecast 2024-2029 ($ million)
- Exhibits126: Data Table on Japan - Market size and forecast 2024-2029 ($ million)
- Exhibits127: Chart on Japan - Year-over-year growth 2024-2029 (%)
- Exhibits128: Data Table on Japan - Year-over-year growth 2024-2029 (%)
- Exhibits129: Chart on South Korea - Market size and forecast 2024-2029 ($ million)
- Exhibits130: Data Table on South Korea - Market size and forecast 2024-2029 ($ million)
- Exhibits131: Chart on South Korea - Year-over-year growth 2024-2029 (%)
- Exhibits132: Data Table on South Korea - Year-over-year growth 2024-2029 (%)
- Exhibits133: Chart on Germany - Market size and forecast 2024-2029 ($ million)
- Exhibits134: Data Table on Germany - Market size and forecast 2024-2029 ($ million)
- Exhibits135: Chart on Germany - Year-over-year growth 2024-2029 (%)
- Exhibits136: Data Table on Germany - Year-over-year growth 2024-2029 (%)
- Exhibits137: Chart on Australia - Market size and forecast 2024-2029 ($ million)
- Exhibits138: Data Table on Australia - Market size and forecast 2024-2029 ($ million)
- Exhibits139: Chart on Australia - Year-over-year growth 2024-2029 (%)
- Exhibits140: Data Table on Australia - Year-over-year growth 2024-2029 (%)
- Exhibits141: Chart on UK - Market size and forecast 2024-2029 ($ million)
- Exhibits142: Data Table on UK - Market size and forecast 2024-2029 ($ million)
- Exhibits143: Chart on UK - Year-over-year growth 2024-2029 (%)
- Exhibits144: Data Table on UK - Year-over-year growth 2024-2029 (%)
- Exhibits145: Chart on Canada - Market size and forecast 2024-2029 ($ million)
- Exhibits146: Data Table on Canada - Market size and forecast 2024-2029 ($ million)
- Exhibits147: Chart on Canada - Year-over-year growth 2024-2029 (%)
- Exhibits148: Data Table on Canada - Year-over-year growth 2024-2029 (%)
- Exhibits149: Chart on France - Market size and forecast 2024-2029 ($ million)
- Exhibits150: Data Table on France - Market size and forecast 2024-2029 ($ million)
- Exhibits151: Chart on France - Year-over-year growth 2024-2029 (%)
- Exhibits152: Data Table on France - Year-over-year growth 2024-2029 (%)
- Exhibits153: Market opportunity By Geographical Landscape ($ million)
- Exhibits154: Data Tables on Market opportunity By Geographical Landscape ($ million)
- Exhibits155: Impact of drivers and challenges in 2024 and 2029
- Exhibits156: Overview on criticality of inputs and factors of differentiation
- Exhibits157: Overview on factors of disruption
- Exhibits158: Impact of key risks on business
- Exhibits159: Companies covered
- Exhibits160: Company ranking index
- Exhibits161: Matrix on companies position and classification
- Exhibits162: CLARIOS LLC - Overview
- Exhibits163: CLARIOS LLC - Product / Service
- Exhibits164: CLARIOS LLC - Key news
- Exhibits165: CLARIOS LLC - Key offerings
- Exhibits166: SWOT
- Exhibits167: Discover Battery - Overview
- Exhibits168: Discover Battery - Product / Service
- Exhibits169: Discover Battery - Key offerings
- Exhibits170: SWOT
- Exhibits171: EnerSys - Overview
- Exhibits172: EnerSys - Business segments
- Exhibits173: EnerSys - Key news
- Exhibits174: EnerSys - Key offerings
- Exhibits175: EnerSys - Segment focus
- Exhibits176: SWOT
- Exhibits177: Exide Industries Ltd. - Overview
- Exhibits178: Exide Industries Ltd. - Product / Service
- Exhibits179: Exide Industries Ltd. - Key news
- Exhibits180: Exide Industries Ltd. - Key offerings
- Exhibits181: SWOT
- Exhibits182: GS Yuasa International Ltd. - Overview
- Exhibits183: GS Yuasa International Ltd. - Business segments
- Exhibits184: GS Yuasa International Ltd. - Key news
- Exhibits185: GS Yuasa International Ltd. - Key offerings
- Exhibits186: GS Yuasa International Ltd. - Segment focus
- Exhibits187: SWOT
- Exhibits188: Interstate Batteries Inc. - Overview
- Exhibits189: Interstate Batteries Inc. - Product / Service
- Exhibits190: Interstate Batteries Inc. - Key offerings
- Exhibits191: SWOT
- Exhibits192: Johnson Controls International Plc - Overview
- Exhibits193: Johnson Controls International Plc - Business segments
- Exhibits194: Johnson Controls International Plc - Key news
- Exhibits195: Johnson Controls International Plc - Key offerings
- Exhibits196: Johnson Controls International Plc - Segment focus
- Exhibits197: SWOT
- Exhibits198: PAM Vilicar doo - Overview
- Exhibits199: PAM Vilicar doo - Product / Service
- Exhibits200: PAM Vilicar doo - Key offerings
- Exhibits201: SWOT
- Exhibits202: Power Sonic Corp. - Overview
- Exhibits203: Power Sonic Corp. - Product / Service
- Exhibits204: Power Sonic Corp. - Key offerings
- Exhibits205: SWOT
- Exhibits206: Poweroad Xiamen Renewable Energy Technology Co. Ltd. - Overview
- Exhibits207: Poweroad Xiamen Renewable Energy Technology Co. Ltd. - Product / Service
- Exhibits208: Poweroad Xiamen Renewable Energy Technology Co. Ltd. - Key offerings
- Exhibits209: SWOT
- Exhibits210: Robert Bosch GmbH - Overview
- Exhibits211: Robert Bosch GmbH - Product / Service
- Exhibits212: Robert Bosch GmbH - Key news
- Exhibits213: Robert Bosch GmbH - Key offerings
- Exhibits214: SWOT
- Exhibits215: Scorpion Battery Inc. - Overview
- Exhibits216: Scorpion Battery Inc. - Product / Service
- Exhibits217: Scorpion Battery Inc. - Key offerings
- Exhibits218: SWOT
- Exhibits219: Super B Lithium Power B.V. - Overview
- Exhibits220: Super B Lithium Power B.V. - Product / Service
- Exhibits221: Super B Lithium Power B.V. - Key offerings
- Exhibits222: SWOT
- Exhibits223: The NOCO Co. - Overview
- Exhibits224: The NOCO Co. - Product / Service
- Exhibits225: The NOCO Co. - Key offerings
- Exhibits226: SWOT
- Exhibits227: Trojan Battery Co. LLC - Overview
- Exhibits228: Trojan Battery Co. LLC - Product / Service
- Exhibits229: Trojan Battery Co. LLC - Key offerings
- Exhibits230: SWOT
- Exhibits231: Inclusions checklist
- Exhibits232: Exclusions checklist
- Exhibits233: Currency conversion rates for US$
- Exhibits234: Research methodology
- Exhibits235: Information sources
- Exhibits236: Data validation
- Exhibits237: Validation techniques employed for market sizing
- Exhibits238: Data synthesis
- Exhibits239: 360 degree market analysis
- Exhibits240: List of abbreviations
The powersports batteries market is forecasted to grow by USD 2,338.4 mn during 2024-2029, accelerating at a CAGR of 4.6% during the forecast period. The report on the powersports batteries market provides a holistic analysis, market size and forecast, trends, growth drivers, and challenges, as well as vendor analysis covering around 25 vendors.
The report offers an up-to-date analysis regarding the current market scenario, the latest trends and drivers, and the overall market environment. The market is driven by major motorcycle oems venturing into electric motorcycle sector, increasing demand for atvs for recreational and adventurous sports activities, and advancements in battery technology.
| Market Scope | |
|---|---|
| Base Year | 2025 |
| End Year | 2029 |
| Series Year | 2025-2029 |
| Growth Momentum | Accelerate |
| YOY 2025 | 4.3% |
| CAGR | 4.6% |
| Incremental Value | $2,338.4 mn |
The study was conducted using an objective combination of primary and secondary information including inputs from key participants in the industry. The report contains a comprehensive market size data, segment with regional analysis and vendor landscape in addition to an analysis of the key companies. Reports have historic and forecast data.
Technavio's powersports batteries market is segmented as below:
By Vehicle Type
- Motorcycles
- ATVs and UTVs
- Mopeds and scooters
- Others
By Channel
- Aftermarket
- OEM
By Battery Type
- Nickel-metal hydride (NiMH)
- Lithium-iron phosphate (LiFePO4)
By Geographical Landscape
- APAC
- North America
- Europe
- South America
- Middle East and Africa
This study identifies the emerging trend of all-electric motorcycle racing as one of the prime reasons driving the powersports batteries market growth during the next few years. Also, rise of electric and hybrid powersports vehicles and growing popularity of motorsports will lead to sizable demand in the market.
The report on the powersports batteries market covers the following areas:
- Powersports Batteries Market sizing
- Powersports Batteries Market forecast
- Powersports Batteries Market industry analysis
The robust vendor analysis is designed to help clients improve their market position, and in line with this, this report provides a detailed analysis of several leading powersports batteries market vendors that include BS Battery, CLARIOS LLC, Discover Battery, East Penn Manufacturing Co. Inc., EnerSys, Exide Industries Ltd., Fullriver Battery, GS Yuasa International Ltd., Interstate Batteries Inc., Johnson Controls International Plc, PAM Vilicar doo, Power Sonic Corp., Poweroad Xiamen Renewable Energy Technology Co. Ltd., Renegade Battery, Robert Bosch GmbH, Scorpion Battery Inc., Skyrich Powersport Batteries, Super B Lithium Power B.V., The NOCO Co., and Trojan Battery Co. LLC. Also, the powersports batteries market analysis report includes information on upcoming trends and challenges that will influence market growth. This is to help companies strategize and leverage all forthcoming growth opportunities.
The publisher presents a detailed picture of the market by the way of study, synthesis, and summation of data from multiple sources by an analysis of key parameters such as profit, pricing, competition, and promotions. It presents various market facets by identifying the key industry influencers. The data presented is comprehensive, reliable, and a result of extensive primary and secondary research. The market research reports provide a complete competitive landscape and an in-depth vendor selection methodology and analysis using qualitative and quantitative research to forecast accurate market growth.
Table of Contents
1 Executive Summary
- 1.1 Market overview
- Executive Summary - Chart on Market Overview
- Executive Summary - Data Table on Market Overview
- Executive Summary - Chart on Global Market Characteristics
- Executive Summary - Chart on Market By Geographical Landscape
- Executive Summary - Chart on Market Segmentation by Vehicle Type
- Executive Summary - Chart on Market Segmentation by Channel
- Executive Summary - Chart on Market Segmentation by Battery Type
- Executive Summary - Chart on Incremental Growth
- Executive Summary - Data Table on Incremental Growth
- Executive Summary - Chart on Company Market Positioning
2 Technavio Analysis
- 2.1 Analysis of price sensitivity, lifecycle, customer purchase basket, adoption rates, and purchase criteria
- Analysis of price sensitivity, lifecycle, customer purchase basket, adoption rates, and purchase criteria
- 2.2 Criticality of inputs and Factors of differentiation
- Overview on criticality of inputs and factors of differentiation
- 2.3 Factors of disruption
- Overview on factors of disruption
- 2.4 Impact of drivers and challenges
- Impact of drivers and challenges in 2024 and 2029
3 Market Landscape
- 3.1 Market ecosystem
- Parent Market
- Data Table on - Parent Market
- 3.2 Market characteristics
- Market characteristics analysis
- 3.3 Value chain analysis
- Value chain analysis
4 Market Sizing
- 4.1 Market definition
- Offerings of companies included in the market definition
- 4.2 Market segment analysis
- Market segments
- 4.3 Market size 2024
- 4.4 Market outlook: Forecast for 2024-2029
- Chart on Global - Market size and forecast 2024-2029 ($ million)
- Data Table on Global - Market size and forecast 2024-2029 ($ million)
- Chart on Global Market: Year-over-year growth 2024-2029 (%)
- Data Table on Global Market: Year-over-year growth 2024-2029 (%)
5 Historic Market Size
- 5.1 Global Powersports Batteries Market 2019 - 2023
- Historic Market Size - Data Table on Global Powersports Batteries Market 2019 - 2023 ($ million)
- 5.2 Vehicle Type segment analysis 2019 - 2023
- Historic Market Size - Vehicle Type Segment 2019 - 2023 ($ million)
- 5.3 Channel segment analysis 2019 - 2023
- Historic Market Size - Channel Segment 2019 - 2023 ($ million)
- 5.4 Battery Type segment analysis 2019 - 2023
- Historic Market Size - Battery Type Segment 2019 - 2023 ($ million)
- 5.5 Geography segment analysis 2019 - 2023
- Historic Market Size - Geography Segment 2019 - 2023 ($ million)
- 5.6 Country segment analysis 2019 - 2023
- Historic Market Size - Country Segment 2019 - 2023 ($ million)
6 Qualitative Analysis
- 6.1 The AI impact on global powersports batteries market
7 Five Forces Analysis
- 7.1 Five forces summary
- Five forces analysis - Comparison between 2024 and 2029
- 7.2 Bargaining power of buyers
- Bargaining power of buyers - Impact of key factors 2024 and 2029
- 7.3 Bargaining power of suppliers
- Bargaining power of suppliers - Impact of key factors in 2024 and 2029
- 7.4 Threat of new entrants
- Threat of new entrants - Impact of key factors in 2024 and 2029
- 7.5 Threat of substitutes
- Threat of substitutes - Impact of key factors in 2024 and 2029
- 7.6 Threat of rivalry
- Threat of rivalry - Impact of key factors in 2024 and 2029
- 7.7 Market condition
- Chart on Market condition - Five forces 2024 and 2029
8 Market Segmentation by Vehicle Type
- 8.1 Market segments
- Chart on Vehicle Type - Market share 2024-2029 (%)
- Data Table on Vehicle Type - Market share 2024-2029 (%)
- 8.2 Comparison by Vehicle Type
- Chart on Comparison by Vehicle Type
- Data Table on Comparison by Vehicle Type
- 8.3 Motorcycles - Market size and forecast 2024-2029
- Chart on Motorcycles - Market size and forecast 2024-2029 ($ million)
- Data Table on Motorcycles - Market size and forecast 2024-2029 ($ million)
- Chart on Motorcycles - Year-over-year growth 2024-2029 (%)
- Data Table on Motorcycles - Year-over-year growth 2024-2029 (%)
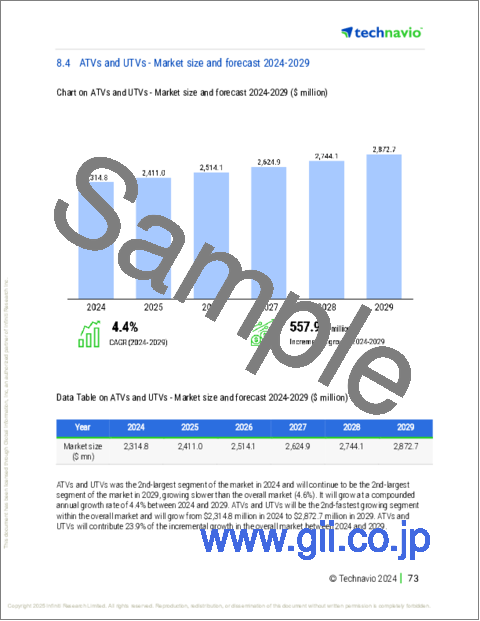
- 8.4 ATVs and UTVs - Market size and forecast 2024-2029
- Chart on ATVs and UTVs - Market size and forecast 2024-2029 ($ million)
- Data Table on ATVs and UTVs - Market size and forecast 2024-2029 ($ million)
- Chart on ATVs and UTVs - Year-over-year growth 2024-2029 (%)
- Data Table on ATVs and UTVs - Year-over-year growth 2024-2029 (%)
- 8.5 Mopeds and scooters - Market size and forecast 2024-2029
- Chart on Mopeds and scooters - Market size and forecast 2024-2029 ($ million)
- Data Table on Mopeds and scooters - Market size and forecast 2024-2029 ($ million)
- Chart on Mopeds and scooters - Year-over-year growth 2024-2029 (%)
- Data Table on Mopeds and scooters - Year-over-year growth 2024-2029 (%)
- 8.6 Others - Market size and forecast 2024-2029
- Chart on Others - Market size and forecast 2024-2029 ($ million)
- Data Table on Others - Market size and forecast 2024-2029 ($ million)
- Chart on Others - Year-over-year growth 2024-2029 (%)
- Data Table on Others - Year-over-year growth 2024-2029 (%)
- 8.7 Market opportunity by Vehicle Type
- Market opportunity by Vehicle Type ($ million)
- Data Table on Market opportunity by Vehicle Type ($ million)
9 Market Segmentation by Channel
- 9.1 Market segments
- Chart on Channel - Market share 2024-2029 (%)
- Data Table on Channel - Market share 2024-2029 (%)
- 9.2 Comparison by Channel
- Chart on Comparison by Channel
- Data Table on Comparison by Channel
- 9.3 Aftermarket - Market size and forecast 2024-2029
- Chart on Aftermarket - Market size and forecast 2024-2029 ($ million)
- Data Table on Aftermarket - Market size and forecast 2024-2029 ($ million)
- Chart on Aftermarket - Year-over-year growth 2024-2029 (%)
- Data Table on Aftermarket - Year-over-year growth 2024-2029 (%)
- 9.4 OEM - Market size and forecast 2024-2029
- Chart on OEM - Market size and forecast 2024-2029 ($ million)
- Data Table on OEM - Market size and forecast 2024-2029 ($ million)
- Chart on OEM - Year-over-year growth 2024-2029 (%)
- Data Table on OEM - Year-over-year growth 2024-2029 (%)
- 9.5 Market opportunity by Channel
- Market opportunity by Channel ($ million)
- Data Table on Market opportunity by Channel ($ million)
10 Market Segmentation by Battery Type
- 10.1 Market segments
- Chart on Battery Type - Market share 2024-2029 (%)
- Data Table on Battery Type - Market share 2024-2029 (%)
- 10.2 Comparison by Battery Type
- Chart on Comparison by Battery Type
- Data Table on Comparison by Battery Type
- 10.3 Nickel-metal hydride (NiMH) - Market size and forecast 2024-2029
- Chart on Nickel-metal hydride (NiMH) - Market size and forecast 2024-2029 ($ million)
- Data Table on Nickel-metal hydride (NiMH) - Market size and forecast 2024-2029 ($ million)
- Chart on Nickel-metal hydride (NiMH) - Year-over-year growth 2024-2029 (%)
- Data Table on Nickel-metal hydride (NiMH) - Year-over-year growth 2024-2029 (%)
- 10.4 Lithium-iron phosphate (LiFePO4) - Market size and forecast 2024-2029
- Chart on Lithium-iron phosphate (LiFePO4) - Market size and forecast 2024-2029 ($ million)
- Data Table on Lithium-iron phosphate (LiFePO4) - Market size and forecast 2024-2029 ($ million)
- Chart on Lithium-iron phosphate (LiFePO4) - Year-over-year growth 2024-2029 (%)
- Data Table on Lithium-iron phosphate (LiFePO4) - Year-over-year growth 2024-2029 (%)
- 10.5 Market opportunity by Battery Type
- Market opportunity by Battery Type ($ million)
- Data Table on Market opportunity by Battery Type ($ million)
11 Customer Landscape
- 11.1 Customer landscape overview
- Analysis of price sensitivity, lifecycle, customer purchase basket, adoption rates, and purchase criteria
12 Geographic Landscape
- 12.1 Geographic segmentation
- Chart on Market share By Geographical Landscape 2024-2029 (%)
- Data Table on Market share By Geographical Landscape 2024-2029 (%)
- 12.2 Geographic comparison
- Chart on Geographic comparison
- Data Table on Geographic comparison
- 12.3 APAC - Market size and forecast 2024-2029
- Chart on APAC - Market size and forecast 2024-2029 ($ million)
- Data Table on APAC - Market size and forecast 2024-2029 ($ million)
- Chart on APAC - Year-over-year growth 2024-2029 (%)
- Data Table on APAC - Year-over-year growth 2024-2029 (%)
- 12.4 North America - Market size and forecast 2024-2029
- Chart on North America - Market size and forecast 2024-2029 ($ million)
- Data Table on North America - Market size and forecast 2024-2029 ($ million)
- Chart on North America - Year-over-year growth 2024-2029 (%)
- Data Table on North America - Year-over-year growth 2024-2029 (%)
- 12.5 Europe - Market size and forecast 2024-2029
- Chart on Europe - Market size and forecast 2024-2029 ($ million)
- Data Table on Europe - Market size and forecast 2024-2029 ($ million)
- Chart on Europe - Year-over-year growth 2024-2029 (%)
- Data Table on Europe - Year-over-year growth 2024-2029 (%)
- 12.6 South America - Market size and forecast 2024-2029
- Chart on South America - Market size and forecast 2024-2029 ($ million)
- Data Table on South America - Market size and forecast 2024-2029 ($ million)
- Chart on South America - Year-over-year growth 2024-2029 (%)
- Data Table on South America - Year-over-year growth 2024-2029 (%)
- 12.7 Middle East and Africa - Market size and forecast 2024-2029
- Chart on Middle East and Africa - Market size and forecast 2024-2029 ($ million)
- Data Table on Middle East and Africa - Market size and forecast 2024-2029 ($ million)
- Chart on Middle East and Africa - Year-over-year growth 2024-2029 (%)
- Data Table on Middle East and Africa - Year-over-year growth 2024-2029 (%)
- 12.8 US - Market size and forecast 2024-2029
- Chart on US - Market size and forecast 2024-2029 ($ million)
- Data Table on US - Market size and forecast 2024-2029 ($ million)
- Chart on US - Year-over-year growth 2024-2029 (%)
- Data Table on US - Year-over-year growth 2024-2029 (%)
- 12.9 China - Market size and forecast 2024-2029
- Chart on China - Market size and forecast 2024-2029 ($ million)
- Data Table on China - Market size and forecast 2024-2029 ($ million)
- Chart on China - Year-over-year growth 2024-2029 (%)
- Data Table on China - Year-over-year growth 2024-2029 (%)
- 12.10 India - Market size and forecast 2024-2029
- Chart on India - Market size and forecast 2024-2029 ($ million)
- Data Table on India - Market size and forecast 2024-2029 ($ million)
- Chart on India - Year-over-year growth 2024-2029 (%)
- Data Table on India - Year-over-year growth 2024-2029 (%)
- 12.11 Japan - Market size and forecast 2024-2029
- Chart on Japan - Market size and forecast 2024-2029 ($ million)
- Data Table on Japan - Market size and forecast 2024-2029 ($ million)
- Chart on Japan - Year-over-year growth 2024-2029 (%)
- Data Table on Japan - Year-over-year growth 2024-2029 (%)
- 12.12 South Korea - Market size and forecast 2024-2029
- Chart on South Korea - Market size and forecast 2024-2029 ($ million)
- Data Table on South Korea - Market size and forecast 2024-2029 ($ million)
- Chart on South Korea - Year-over-year growth 2024-2029 (%)
- Data Table on South Korea - Year-over-year growth 2024-2029 (%)
- 12.13 Germany - Market size and forecast 2024-2029
- Chart on Germany - Market size and forecast 2024-2029 ($ million)
- Data Table on Germany - Market size and forecast 2024-2029 ($ million)
- Chart on Germany - Year-over-year growth 2024-2029 (%)
- Data Table on Germany - Year-over-year growth 2024-2029 (%)
- 12.14 Australia - Market size and forecast 2024-2029
- Chart on Australia - Market size and forecast 2024-2029 ($ million)
- Data Table on Australia - Market size and forecast 2024-2029 ($ million)
- Chart on Australia - Year-over-year growth 2024-2029 (%)
- Data Table on Australia - Year-over-year growth 2024-2029 (%)
- 12.15 UK - Market size and forecast 2024-2029
- Chart on UK - Market size and forecast 2024-2029 ($ million)
- Data Table on UK - Market size and forecast 2024-2029 ($ million)
- Chart on UK - Year-over-year growth 2024-2029 (%)
- Data Table on UK - Year-over-year growth 2024-2029 (%)
- 12.16 Canada - Market size and forecast 2024-2029
- Chart on Canada - Market size and forecast 2024-2029 ($ million)
- Data Table on Canada - Market size and forecast 2024-2029 ($ million)
- Chart on Canada - Year-over-year growth 2024-2029 (%)
- Data Table on Canada - Year-over-year growth 2024-2029 (%)
- 12.17 France - Market size and forecast 2024-2029
- Chart on France - Market size and forecast 2024-2029 ($ million)
- Data Table on France - Market size and forecast 2024-2029 ($ million)
- Chart on France - Year-over-year growth 2024-2029 (%)
- Data Table on France - Year-over-year growth 2024-2029 (%)
- 12.18 Market opportunity By Geographical Landscape
- Market opportunity By Geographical Landscape ($ million)
- Data Tables on Market opportunity By Geographical Landscape ($ million)
13 Drivers, Challenges, and Opportunity/Restraints
- 13.1 Market drivers
- 13.2 Market challenges
- 13.3 Impact of drivers and challenges
- Impact of drivers and challenges in 2024 and 2029
- 13.4 Market opportunities/restraints
14 Competitive Landscape
- 14.1 Overview
- 14.2 Competitive Landscape
- Overview on criticality of inputs and factors of differentiation
- 14.3 Landscape disruption
- Overview on factors of disruption
- 14.4 Industry risks
- Impact of key risks on business
15 Competitive Analysis
- 15.1 Companies profiled
- Companies covered
- 15.2 Company ranking index
- Company ranking index
- 15.3 Market positioning of companies
- Matrix on companies position and classification
- 15.4 CLARIOS LLC
- CLARIOS LLC - Overview
- CLARIOS LLC - Product / Service
- CLARIOS LLC - Key news
- CLARIOS LLC - Key offerings
- SWOT
- 15.5 Discover Battery
- Discover Battery - Overview
- Discover Battery - Product / Service
- Discover Battery - Key offerings
- SWOT
- 15.6 EnerSys
- EnerSys - Overview
- EnerSys - Business segments
- EnerSys - Key news
- EnerSys - Key offerings
- EnerSys - Segment focus
- SWOT
- 15.7 Exide Industries Ltd.
- Exide Industries Ltd. - Overview
- Exide Industries Ltd. - Product / Service
- Exide Industries Ltd. - Key news
- Exide Industries Ltd. - Key offerings
- SWOT
- 15.8 GS Yuasa International Ltd.
- GS Yuasa International Ltd. - Overview
- GS Yuasa International Ltd. - Business segments
- GS Yuasa International Ltd. - Key news
- GS Yuasa International Ltd. - Key offerings
- GS Yuasa International Ltd. - Segment focus
- SWOT
- 15.9 Interstate Batteries Inc.
- Interstate Batteries Inc. - Overview
- Interstate Batteries Inc. - Product / Service
- Interstate Batteries Inc. - Key offerings
- SWOT
- 15.10 Johnson Controls International Plc
- Johnson Controls International Plc - Overview
- Johnson Controls International Plc - Business segments
- Johnson Controls International Plc - Key news
- Johnson Controls International Plc - Key offerings
- Johnson Controls International Plc - Segment focus
- SWOT
- 15.11 PAM Vilicar doo
- PAM Vilicar doo - Overview
- PAM Vilicar doo - Product / Service
- PAM Vilicar doo - Key offerings
- SWOT
- 15.12 Power Sonic Corp.
- Power Sonic Corp. - Overview
- Power Sonic Corp. - Product / Service
- Power Sonic Corp. - Key offerings
- SWOT
- 15.13 Poweroad Xiamen Renewable Energy Technology Co. Ltd.
- Poweroad Xiamen Renewable Energy Technology Co. Ltd. - Overview
- Poweroad Xiamen Renewable Energy Technology Co. Ltd. - Product / Service
- Poweroad Xiamen Renewable Energy Technology Co. Ltd. - Key offerings
- SWOT
- 15.14 Robert Bosch GmbH
- Robert Bosch GmbH - Overview
- Robert Bosch GmbH - Product / Service
- Robert Bosch GmbH - Key news
- Robert Bosch GmbH - Key offerings
- SWOT
- 15.15 Scorpion Battery Inc.
- Scorpion Battery Inc. - Overview
- Scorpion Battery Inc. - Product / Service
- Scorpion Battery Inc. - Key offerings
- SWOT
- 15.16 Super B Lithium Power B.V.
- Super B Lithium Power B.V. - Overview
- Super B Lithium Power B.V. - Product / Service
- Super B Lithium Power B.V. - Key offerings
- SWOT
- 15.17 The NOCO Co.
- The NOCO Co. - Overview
- The NOCO Co. - Product / Service
- The NOCO Co. - Key offerings
- SWOT
- 15.18 Trojan Battery Co. LLC
- Trojan Battery Co. LLC - Overview
- Trojan Battery Co. LLC - Product / Service
- Trojan Battery Co. LLC - Key offerings
- SWOT
16 Appendix
- 16.1 Scope of the report
- 16.2 Inclusions and exclusions checklist
- Inclusions checklist
- Exclusions checklist
- 16.3 Currency conversion rates for US$
- Currency conversion rates for US$
- 16.4 Research methodology
- Research methodology
- 16.5 Data procurement
- Information sources
- 16.6 Data validation
- Data validation
- 16.7 Validation techniques employed for market sizing
- Validation techniques employed for market sizing
- 16.8 Data synthesis
- Data synthesis
- 16.9 360 degree market analysis
- 360 degree market analysis
- 16.10 List of abbreviations
- List of abbreviations

