|
|
市場調査レポート
商品コード
1908892
世界の再生基油市場2026-2030年Global Re-Refined Base Oils Market 2026-2030 |
||||||
|
|||||||
カスタマイズ可能
|
|||||||

| 世界の再生基油市場2026-2030年 |
|
出版日: 2026年01月14日
発行: TechNavio
ページ情報: 英文 308 Pages
納期: 即納可能
|

概要
世界の再生基油市場は、2025年から2030年にかけて32億2,770万米ドルの成長が見込まれ、予測期間中のCAGRは7.3%と予測されています。
本報告書では、世界の再生基油市場に関する包括的な分析、市場規模と予測、動向、成長要因、課題に加え、約25社のベンダー分析を提供しております。
本レポートは、現在の市場状況、最新の動向と促進要因、市場環境全般に関する最新の分析を提供します。市場は、厳格な環境規制と循環型経済の義務、企業の持続可能性とスコープ3排出量削減への注力、水素化処理および蒸留プロセスにおける技術的進歩によって牽引されています。
本調査は、業界の主要関係者からの情報をはじめとする一次情報と二次情報を客観的に組み合わせて実施されました。本レポートには、主要企業の分析に加え、包括的な市場規模データ、地域別分析を伴うセグメント、ベンダー情勢が含まれています。レポートには過去データと予測データが掲載されています。
| 市場範囲 | |
|---|---|
| 基準年 | 2026年 |
| 終了年 | 2030年 |
| 予測期間 | 2026-2030 |
| 成長モメンタム | 加速 |
| 前年比2026年 | 6.7% |
| CAGR | 7.3% |
| 増分額 | 32億2,770万米ドル |
本調査では、高性能なグループ3基油の生産量と需要の増加が、今後数年間における世界の再生基油市場成長を牽引する主要な要因の一つであると特定しております。また、デジタル化やライフサイクルアセスメント追跡システムの導入、サプライチェーン全体での戦略的統合や協業事業の展開が、市場における相当な需要を生み出すものと見込まれます。
目次
第1章 エグゼクティブサマリー
- 市場概要
第2章 Technavio分析
- 価格・ライフサイクル・顧客購入バスケット・採用率・購入基準の分析
- インプットの重要性と差別化の要因
- 混乱の要因
- 促進要因と課題の影響
第3章 市場情勢
- 市場エコシステム
- 市場の特徴
- バリューチェーン分析
第4章 市場規模
- 市場の定義
- 市場セグメント分析
- 市場規模 2025
- 市場の見通し 2025-2030
第5章 市場規模実績
- 世界の再生基油市場 2020-2024
- タイプセグメント分析 2020-2024
- 用途別セグメント分析 2020-2024
- 技術セグメント分析 2020-2024
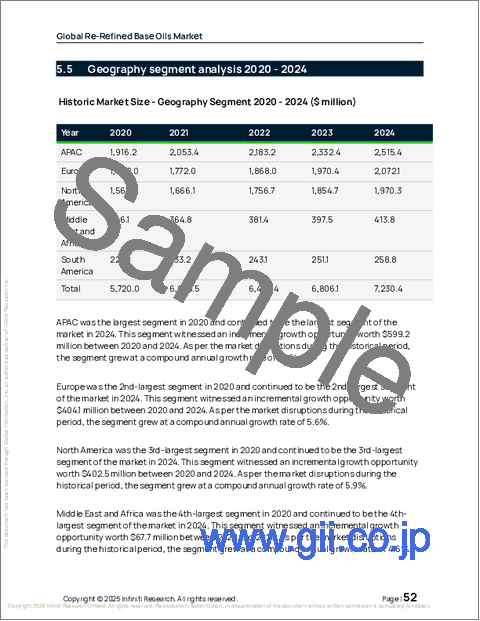
- 地域別セグメント分析 2020-2024
- 国別セグメント分析 2020-2024
第6章 定性分析
- AIが及ぼす影響世界の再生基油市場
第7章 ファイブフォース分析
- ファイブフォースの要約
- 買い手の交渉力
- 供給企業の交渉力
- 新規参入業者の脅威
- 代替品の脅威
- 競争の脅威
- 市況
第8章 市場セグメンテーション:タイプ別
- 市場セグメント
- 比較:タイプ別
- グループI:市場規模と予測 2025-2030
- グループII:市場規模と予測 2025-2030
- グループIII:市場規模と予測 2025-2030
- 市場機会:タイプ別
第9章 市場セグメンテーション:用途別
- 市場セグメント
- 比較:用途別
- エンジンオイル:市場規模と予測 2025-2030
- 工業用油:市場規模と予測 2025-2030
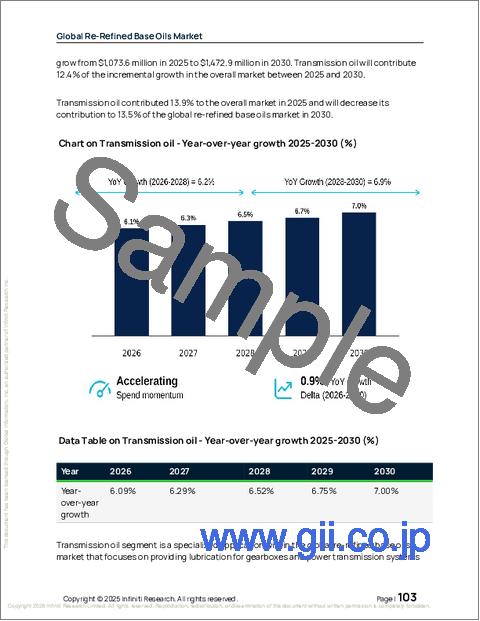
- トランスミッションオイル:市場規模と予測 2025-2030
- ギアオイル:市場規模と予測 2025-2030
- その他:市場規模と予測 2025-2030
- 市場機会:用途別
第10章 市場セグメンテーション:技術別
- 市場セグメント
- 比較:技術別
- 水素化処理プロセス:市場規模と予測 2025-2030
- 粘土処理:市場規模と予測 2025-2030
- 真空蒸留:市場規模と予測 2025-2030
- 溶媒抽出:市場規模と予測 2025-2030
- その他:市場規模と予測 2025-2030
- 市場機会:技術別
第11章 顧客情勢
- 顧客情勢の概要
第12章 地域別情勢
- 地域別セグメンテーション
- 地域別比較
- アジア太平洋:市場規模と予測 2025-2030
- 欧州:市場規模と予測 2025-2030
- 北米:市場規模と予測 2025-2030
- 中東・アフリカ:市場規模と予測 2025-2030
- 南米:市場規模と予測 2025-2030
- 市場機会:地域別
第13章 促進要因、課題、および機会
- 市場促進要因
- 市場の課題
- 促進要因と課題の影響
- 市場機会
第14章 競合情勢
- 概要
- 競合情勢
- 混乱の状況
- 業界のリスク
第15章 競合分析
- 企業プロファイル
- 企業ランキング指標
- 企業の市場ポジショニング
- AVISTA OIL Deutschland GmbH
- Biosynthetic Technologies
- Castrol Ltd.
- Clean Harbors Inc.
- Cleanaway Waste Management Ltd.
- Emerald Transformer
- GFL Environmental Inc.
- Heritage Crystal Clean Inc.
- Hydrodec Group plc
- IFP Petro Products Pvt. Ltd.
- Itelyum Regeneration S.p.A.
- Lwart Solucoes Ambientais
- Nynas AB
- PURAGLOBE Germany GmbH
- Vertex Energy Inc.

