|
|
市場調査レポート
商品コード
2030808
自動車用再生タイヤの世界市場 2026年~2030年Global Automotive Retreaded Tires Market 2026-2030 |
||||||
|
|||||||
カスタマイズ可能
|
|||||||

| 自動車用再生タイヤの世界市場 2026年~2030年 |
|
出版日: 2026年05月03日
発行: TechNavio
ページ情報: 英文 293 Pages
納期: 即納可能
|

概要
世界の自動車用再生タイヤ市場は、2025年から2030年にかけて58億240万米ドル成長し、予測期間中のCAGRは7.8%になると予測されています。
本レポートでは、世界の自動車用再生タイヤ市場について、包括的な分析、市場規模と予測、動向、成長要因、課題に加え、約25社のベンダーを網羅したベンダー分析を提供しています。
本レポートでは、現在の市場状況、最新の動向と促進要因、および市場環境全体に関する最新の分析を提供しています。この市場は、世界の商用車保有台数の拡大と貨物輸送量の増加、環境の持続可能性と循環型経済への注目の高まり、そしてリトレッド技術と品質における継続的な革新によって牽引されています。
本調査は、業界の主要関係者からの情報を含む一次情報および二次情報を客観的に組み合わせて実施されました。本レポートには、主要企業の分析に加え、包括的な市場規模データ、地域別分析を伴うセグメント、およびベンダー情勢が含まれています。レポートには、過去データと予測データが掲載されています。
| 市場範囲 | |
|---|---|
| 基準年 | 2025年 |
| 終了年 | 2030年 |
| 調査期間 | 2026年~2030年 |
| 成長モメンタム | 加速 |
| 2026年の前年比 | 7.1% |
| CAGR | 7.8% |
| 増分額 | 58億240万米ドル |
本調査では、デジタル化とフリート管理ソリューションの統合が、今後数年間における世界の自動車用再生タイヤ市場の成長を牽引する主な要因の一つであると特定しています。また、用途特化型再生タイヤの普及や、小型商用車および電気自動車セグメントへの拡大により、市場ではかなりの需要が見込まれます。
目次
第1章 エグゼクティブサマリー
第2章 Technavio分析
- 価格・ライフサイクル・顧客購入バスケット・採用率・購入基準の分析
- インプットの重要性と差別化の要因
- ディスラプション要因
- 促進要因と課題の影響
第3章 市場情勢
- 市場エコシステム
- 市場の特徴
- バリューチェーン分析
第4章 市場規模
- 市場の定義
- 市場セグメント分析
- 市場規模、2025年
- 市場の見通し、2025年-2030年
第5章 市場規模実績
- 世界の自動車用再生タイヤ市場、2020年-2024年
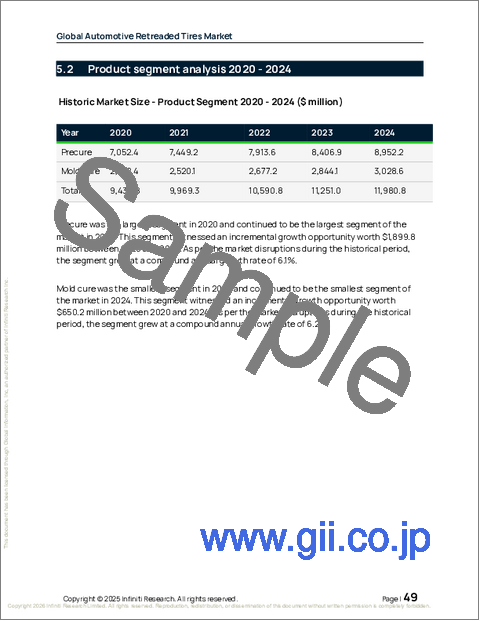
- 製品別セグメント分析、2020年-2024年
- 車両タイプ別セグメント分析、2020年-2024年
- エンドユーザー別セグメント分析、2020年-2024年
- 地域別セグメント分析、2020年-2024年
- 国別セグメント分析、2020年-2024年
第6章 定性分析
- AIの影響:世界の自動車用再生タイヤ市場
- 地政学的紛争が及ぼす影響:世界の自動車用再生タイヤ市場
第7章 ファイブフォース分析
第8章 市場セグメンテーション:製品別
- 比較:製品別
- プレキュア
- モールドキュア
- 市場機会:製品別
第9章 市場セグメンテーション:車両タイプ別
- 比較:車両タイプ別
- 商用車
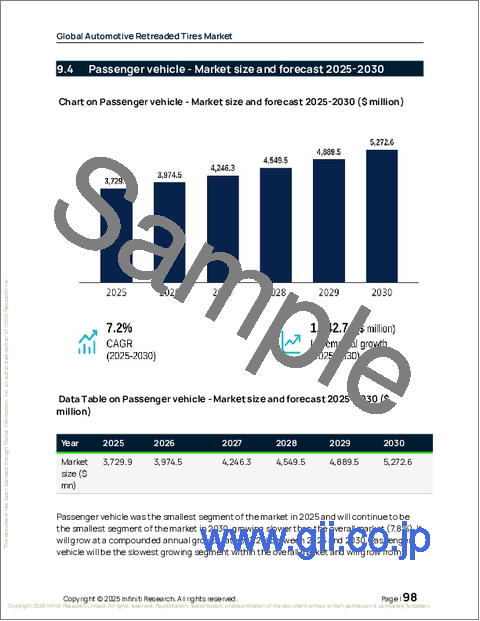
- 乗用車
- 市場機会:車両タイプ別
第10章 市場セグメンテーション:エンドユーザー別
- 比較:エンドユーザー別
- アフターマーケット
- OEM
- 市場機会:エンドユーザー別
第11章 顧客情勢
第12章 地域別情勢
- 地域別セグメンテーション
- 地域別比較
- 北米
- 米国
- カナダ
- メキシコ
- アジア太平洋
- 中国
- 日本
- インド
- 韓国
- オーストラリア
- インドネシア
- 欧州
- ドイツ
- 英国
- フランス
- イタリア
- スペイン
- オランダ
- 南アメリカ
- ブラジル
- アルゼンチン
- チリ
- 中東・アフリカ
- サウジアラビア
- UAE
- 南アフリカ
- イスラエル
- トルコ
- 市場機会:地域別
第13章 促進要因・課題・機会
- 市場促進要因
- 市場の課題
- 促進要因と課題の影響
- 市場機会
第14章 競合情勢
- 概要
- 競合情勢
- ディスラプション情勢
- 業界のリスク
第15章 競合分析
- 企業プロファイル
- 企業ランキング指標
- 企業の市場ポジショニング
- Bridgestone Corp.
- CIO Tyres Pvt. Ltd
- Continental AG
- Eastern Treads Ltd.
- Goodyear Tire and Rubber Co.
- JK Tyre and Industries Ltd.
- Kal Tire
- KRAIBURG AUSTRIA GmbH
- MARANGONI Group.
- Michelin
- MRF Ltd.
- Nokian Tyres Plc
- Oliver Rubber Co.
- REIFEN HINGHAUS GmbH
- Yokohama Rubber Co. Ltd.
