|
|
市場調査レポート
商品コード
1666780
ブラジルナッツの世界市場 2025~2029年Global Brazil Nuts Market 2025-2029 |
||||||
|
|||||||
カスタマイズ可能
|
|||||||


| ブラジルナッツの世界市場 2025~2029年 |
|
出版日: 2025年02月21日
発行: TechNavio
ページ情報: 英文 230 Pages
納期: 即納可能
|

全表示
- 概要
- 目次
ブラジルナッツ市場は2024~2029年に7,180万米ドル、予測期間中のCAGRは4.7%で成長すると予測されます。
当レポートでは、ブラジルナッツ市場の全体的な分析、市場規模・予測、動向、成長促進要因、課題、約25のベンダーを網羅したベンダー分析などを掲載しています。
現在の市場シナリオ、最新動向と促進要因、市場環境全体に関する最新分析を提供しています。ブラジルナッツ市場は、ブラジルナッツの消費に関連する数多くの健康上の利点、ブラジルナッツを消費する利便性、ブラジルナッツメーカーの強力な流通網とオムニチャネルプレゼンスによって牽引されています。
| 市場範囲 | |
|---|---|
| 基準年 | 2025年 |
| 終了年 | 2029年 |
| 予測期間 | 2025~2029年 |
| 成長モメンタム | 加速 |
| 前年比2025年 | 4.3% |
| CAGR | 4.7% |
| 増分額 | 7,180万米ドル |
本調査は、業界の主要参加者からのインプットを含め、一次情報と二次情報を客観的に組み合わせて実施しました。レポートには、主要企業の分析に加え、包括的な市場規模データ、地域分析によるセグメント、ベンダー情勢が含まれています。レポートには過去データと予測データがあります。
本調査では、今後数年間のブラジルナッツ市場の成長を促進する主な要因の1つとして、ブラジルナッツの製品革新と市場の多様化の増加を挙げています。また、様々なエンドユーザーにおけるブラジルナッツの需要の増加、クリーンラベリングやフェアトレードの普及は、市場の大きな需要につながるでしょう。
目次
第1章 エグゼクティブサマリー
- 市場概要
第2章 Technavio別分析
- 価格・ライフサイクル・顧客購入バスケット・採用率・購入基準の分析
- インプットの重要性と差別化の要因
- 混乱の要因
- 促進要因と課題の影響
第3章 市場情勢
- 市場エコシステム
- 市場の特徴
- バリューチェーン分析
第4章 市場規模
- 市場の定義
- 市場セグメント分析
- 市場規模 2024年
- 市場展望 2024~2029年
第5章 市場規模実績
- ブラジルナッツの世界市場 2019~2023年
- 製品別セグメント分析 2019~2023年
- 流通チャネル別セグメント分析 2019~2023年
- タイプ別セグメント分析 2019~2023年
- エンドユーザー別セグメント分析 2019~2023年
- 地域別セグメント分析 2019~2023年
- 国別セグメント分析 2019~2023年
第6章 定性分析
- AIの影響:ブラジルナッツの世界市場
第7章 ファイブフォース分析
- ファイブフォースの要約
- 買い手の交渉力
- 供給企業の交渉力
- 新規参入業者の脅威
- 代替品の脅威
- 競争の脅威
- 市況
第8章 市場セグメンテーション:製品別
- 市場セグメント
- 比較:製品別
- 従来型ブラジルナッツ:市場規模と予測 2024~2029年
- オーガニックブラジルナッツ:市場規模と予測 2024~2029年
- 市場機会:製品別
第9章 市場セグメンテーション:流通チャネル別
- 市場セグメント
- 比較:流通チャネル別
- オフライン:市場規模と予測 2024~2029年
- オンライン:市場規模と予測 2024~2029年
- 市場機会:流通チャネル別
第10章 市場セグメンテーション:タイプ別
- 市場セグメント
- 比較:タイプ別
- ホールナッツ:市場規模と予測 2024~2029年
- ピース:市場規模と予測 2024~2029年
- パウダー:市場規模と予測 2024~2029年
- 市場機会:タイプ別
第11章 市場セグメンテーション:エンドユーザー別
- 市場セグメント
- 比較:エンドユーザー別
- 食品・飲料:市場規模と予測 2024~2029年
- 化粧品:市場規模と予測 2024~2029年
- ニュートラシューティカル:市場規模と予測 2024~2029年
- 市場機会:エンドユーザー別
第12章 顧客情勢
- 顧客情勢の概要
第13章 地域別情勢
- 地域別セグメンテーション
- 地域別比較
- 欧州:市場規模と予測 2024~2029年
- 北米:市場規模と予測 2024~2029年
- アジア太平洋:市場規模と予測 2024~2029年
- 南米:市場規模と予測 2024~2029年
- 中東・アフリカ:市場規模と予測 2024~2029年
- 米国:市場規模と予測 2024~2029年
- 英国:市場規模と予測 2024~2029年
- ドイツ:市場規模と予測 2024~2029年
- フランス:市場規模と予測 2024~2029年
- イタリア:市場規模と予測 2024~2029年
- オランダ:市場規模と予測 2024~2029年
- スペイン:市場規模と予測 2024~2029年
- カナダ:市場規模と予測 2024~2029年
- 中国:市場規模と予測 2024~2029年
- 日本:市場規模と予測 2024~2029年
- 市場機会:地域情勢別
第14章 促進要因・課題・機会・抑制要因
- 市場促進要因
- 市場の課題
- 促進要因と課題の影響
- 市場の機会・抑制要因
第15章 競合情勢
- 概要
- 競合情勢
- 混乱の状況
- 業界のリスク
第16章 競合分析
- 企業プロファイル
- 企業ランキング指数
- 企業の市場ポジショニング
- Basse Nuts
- FLORENZANO NUTS
- Happilo International Pvt. Ltd.
- Urban Platter
- Food to Live
- NOW Foods
- Nut Cravings
- Nuts.com Inc.
- Nutshup
- Royal Nut Co.
- Select Harvests Ltd.
- Sunfood
- Terrasoul Superfoods
- The Roasting Company
- Wildly Organic
第17章 付録
The Brazil nuts market is forecasted to grow by USD 71.8 million during 2024-2029, accelerating at a CAGR of 4.7% during the forecast period. The report on the Brazil nuts market provides a holistic analysis, market size and forecast, trends, growth drivers, and challenges, as well as vendor analysis covering around 25 vendors.
The report offers an up-to-date analysis regarding the current market scenario, the latest trends and drivers, and the overall market environment. The market is driven by numerous health benefits associated with consumption of Brazil nuts, convenience of consuming Brazil nuts, and strong distribution networks and omnichannel presence of Brazil nuts manufacturers.
| Market Scope | |
|---|---|
| Base Year | 2025 |
| End Year | 2029 |
| Series Year | 2025-2029 |
| Growth Momentum | Accelerate |
| YOY 2025 | 4.3% |
| CAGR | 4.7% |
| Incremental Value | $71.8 mn |
The study was conducted using an objective combination of primary and secondary information including inputs from key participants in the industry. The report contains a comprehensive market size data, segment with regional analysis and vendor landscape in addition to an analysis of the key companies. Reports have historic and forecast data.
Technavio's Brazil nuts market is segmented as below:
By Product
- Conventional Brazil nuts
- Organic Brazil nuts
By Distribution Channel
- Offline
- Online
By Type
- Whole nuts
- Pieces
- Powder
By End-user
- Food and beverage
- Cosmetic
- Neutraceutical
By Geographical Landscape
- Europe
- North America
- APAC
- South America
- Middle East and Africa
This study identifies the increase in product innovation and diversification of Brazil nuts as one of the prime reasons driving the Brazil nuts market growth during the next few years. Also, increasing demand for Brazil nuts among various end-users and prevalence of clean labeling and fair-trade practices will lead to sizable demand in the market.
The report on the Brazil nuts market covers the following areas:
- Brazil Nuts Market sizing
- Brazil Nuts Market forecast
- Brazil Nuts Market industry analysis
The robust vendor analysis is designed to help clients improve their market position, and in line with this, this report provides a detailed analysis of several leading Brazil nuts market vendors that include Basse Nuts, Bata Food, Nutty Gritties, FLORENZANO NUTS, Happilo International Pvt. Ltd., Urban Platter, Food to Live, NOW Foods, Nut Cravings, Nuts.com Inc., Nutshup, Royal Nut Co., Select Harvests Ltd., Sincerely Nuts, Sunbest Natural, Sunfood, Terrasoul Superfoods, The Roasting Company, We Got Nuts, and Wildly Organic. Also, the Brazil nuts market analysis report includes information on upcoming trends and challenges that will influence market growth. This is to help companies strategize and leverage all forthcoming growth opportunities.
The publisher presents a detailed picture of the market by the way of study, synthesis, and summation of data from multiple sources by an analysis of key parameters such as profit, pricing, competition, and promotions. It presents various market facets by identifying the key industry influencers. The data presented is comprehensive, reliable, and a result of extensive primary and secondary research. The market research reports provide a complete competitive landscape and an in-depth vendor selection methodology and analysis using qualitative and quantitative research to forecast accurate market growth.
Table of Contents
1 Executive Summary
- 1.1 Market overview
- Executive Summary - Chart on Market Overview
- Executive Summary - Data Table on Market Overview
- Executive Summary - Chart on Global Market Characteristics
- Executive Summary - Chart on Market By Geographical Landscape
- Executive Summary - Chart on Market Segmentation by Product
- Executive Summary - Chart on Market Segmentation by Distribution Channel
- Executive Summary - Chart on Market Segmentation by Type
- Executive Summary - Chart on Market Segmentation by End-user
- Executive Summary - Chart on Incremental Growth
- Executive Summary - Data Table on Incremental Growth
- Executive Summary - Chart on Company Market Positioning
2 Technavio Analysis
- 2.1 Analysis of price sensitivity, lifecycle, customer purchase basket, adoption rates, and purchase criteria
- Analysis of price sensitivity, lifecycle, customer purchase basket, adoption rates, and purchase criteria
- 2.2 Criticality of inputs and Factors of differentiation
- Overview on criticality of inputs and factors of differentiation
- 2.3 Factors of disruption
- Overview on factors of disruption
- 2.4 Impact of drivers and challenges
- Impact of drivers and challenges in 2024 and 2029
3 Market Landscape
- 3.1 Market ecosystem
- Parent Market
- Data Table on - Parent Market
- 3.2 Market characteristics
- Market characteristics analysis
- 3.3 Value chain analysis
- Value chain analysis
4 Market Sizing
- 4.1 Market definition
- Offerings of companies included in the market definition
- 4.2 Market segment analysis
- Market segments
- 4.3 Market size 2024
- 4.4 Market outlook: Forecast for 2024-2029
- Chart on Global - Market size and forecast 2024-2029 ($ million)
- Data Table on Global - Market size and forecast 2024-2029 ($ million)
- Chart on Global Market: Year-over-year growth 2024-2029 (%)
- Data Table on Global Market: Year-over-year growth 2024-2029 (%)
5 Historic Market Size
- 5.1 Global Brazil Nuts Market 2019 - 2023
- Historic Market Size - Data Table on Global Brazil Nuts Market 2019 - 2023 ($ million)
- 5.2 Product segment analysis 2019 - 2023
- Historic Market Size - Product Segment 2019 - 2023 ($ million)
- 5.3 Distribution Channel segment analysis 2019 - 2023
- Historic Market Size - Distribution Channel Segment 2019 - 2023 ($ million)
- 5.4 Type segment analysis 2019 - 2023
- Historic Market Size - Type Segment 2019 - 2023 ($ million)
- 5.5 End-user segment analysis 2019 - 2023
- Historic Market Size - End-user Segment 2019 - 2023 ($ million)
- 5.6 Geography segment analysis 2019 - 2023
- Historic Market Size - Geography Segment 2019 - 2023 ($ million)
- 5.7 Country segment analysis 2019 - 2023
- Historic Market Size - Country Segment 2019 - 2023 ($ million)
6 Qualitative Analysis
- 6.1 Impact of AI on Global Brazil Nuts Market
7 Five Forces Analysis
- 7.1 Five forces summary
- Five forces analysis - Comparison between 2024 and 2029
- 7.2 Bargaining power of buyers
- Bargaining power of buyers - Impact of key factors 2024 and 2029
- 7.3 Bargaining power of suppliers
- Bargaining power of suppliers - Impact of key factors in 2024 and 2029
- 7.4 Threat of new entrants
- Threat of new entrants - Impact of key factors in 2024 and 2029
- 7.5 Threat of substitutes
- Threat of substitutes - Impact of key factors in 2024 and 2029
- 7.6 Threat of rivalry
- Threat of rivalry - Impact of key factors in 2024 and 2029
- 7.7 Market condition
- Chart on Market condition - Five forces 2024 and 2029
8 Market Segmentation by Product
- 8.1 Market segments
- Chart on Product - Market share 2024-2029 (%)
- Data Table on Product - Market share 2024-2029 (%)
- 8.2 Comparison by Product
- Chart on Comparison by Product
- Data Table on Comparison by Product
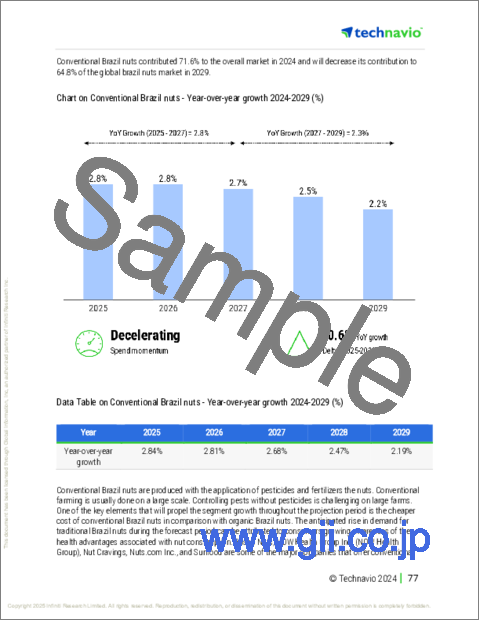
- 8.3 Conventional Brazil nuts - Market size and forecast 2024-2029
- Chart on Conventional Brazil nuts - Market size and forecast 2024-2029 ($ million)
- Data Table on Conventional Brazil nuts - Market size and forecast 2024-2029 ($ million)
- Chart on Conventional Brazil nuts - Year-over-year growth 2024-2029 (%)
- Data Table on Conventional Brazil nuts - Year-over-year growth 2024-2029 (%)
- 8.4 Organic Brazil nuts - Market size and forecast 2024-2029
- Chart on Organic Brazil nuts - Market size and forecast 2024-2029 ($ million)
- Data Table on Organic Brazil nuts - Market size and forecast 2024-2029 ($ million)
- Chart on Organic Brazil nuts - Year-over-year growth 2024-2029 (%)
- Data Table on Organic Brazil nuts - Year-over-year growth 2024-2029 (%)
- 8.5 Market opportunity by Product
- Market opportunity by Product ($ million)
- Data Table on Market opportunity by Product ($ million)
9 Market Segmentation by Distribution Channel
- 9.1 Market segments
- Chart on Distribution Channel - Market share 2024-2029 (%)
- Data Table on Distribution Channel - Market share 2024-2029 (%)
- 9.2 Comparison by Distribution Channel
- Chart on Comparison by Distribution Channel
- Data Table on Comparison by Distribution Channel
- 9.3 Offline - Market size and forecast 2024-2029
- Chart on Offline - Market size and forecast 2024-2029 ($ million)
- Data Table on Offline - Market size and forecast 2024-2029 ($ million)
- Chart on Offline - Year-over-year growth 2024-2029 (%)
- Data Table on Offline - Year-over-year growth 2024-2029 (%)
- 9.4 Online - Market size and forecast 2024-2029
- Chart on Online - Market size and forecast 2024-2029 ($ million)
- Data Table on Online - Market size and forecast 2024-2029 ($ million)
- Chart on Online - Year-over-year growth 2024-2029 (%)
- Data Table on Online - Year-over-year growth 2024-2029 (%)
- 9.5 Market opportunity by Distribution Channel
- Market opportunity by Distribution Channel ($ million)
- Data Table on Market opportunity by Distribution Channel ($ million)
10 Market Segmentation by Type
- 10.1 Market segments
- Chart on Type - Market share 2024-2029 (%)
- Data Table on Type - Market share 2024-2029 (%)
- 10.2 Comparison by Type
- Chart on Comparison by Type
- Data Table on Comparison by Type
- 10.3 Whole nuts - Market size and forecast 2024-2029
- Chart on Whole nuts - Market size and forecast 2024-2029 ($ million)
- Data Table on Whole nuts - Market size and forecast 2024-2029 ($ million)
- Chart on Whole nuts - Year-over-year growth 2024-2029 (%)
- Data Table on Whole nuts - Year-over-year growth 2024-2029 (%)
- 10.4 Pieces - Market size and forecast 2024-2029
- Chart on Pieces - Market size and forecast 2024-2029 ($ million)
- Data Table on Pieces - Market size and forecast 2024-2029 ($ million)
- Chart on Pieces - Year-over-year growth 2024-2029 (%)
- Data Table on Pieces - Year-over-year growth 2024-2029 (%)
- 10.5 Powder - Market size and forecast 2024-2029
- Chart on Powder - Market size and forecast 2024-2029 ($ million)
- Data Table on Powder - Market size and forecast 2024-2029 ($ million)
- Chart on Powder - Year-over-year growth 2024-2029 (%)
- Data Table on Powder - Year-over-year growth 2024-2029 (%)
- 10.6 Market opportunity by Type
- Market opportunity by Type ($ million)
- Data Table on Market opportunity by Type ($ million)
11 Market Segmentation by End-user
- 11.1 Market segments
- Chart on End-user - Market share 2024-2029 (%)
- Data Table on End-user - Market share 2024-2029 (%)
- 11.2 Comparison by End-user
- Chart on Comparison by End-user
- Data Table on Comparison by End-user
- 11.3 Food and beverage - Market size and forecast 2024-2029
- Chart on Food and beverage - Market size and forecast 2024-2029 ($ million)
- Data Table on Food and beverage - Market size and forecast 2024-2029 ($ million)
- Chart on Food and beverage - Year-over-year growth 2024-2029 (%)
- Data Table on Food and beverage - Year-over-year growth 2024-2029 (%)
- 11.4 Cosmetic - Market size and forecast 2024-2029
- Chart on Cosmetic - Market size and forecast 2024-2029 ($ million)
- Data Table on Cosmetic - Market size and forecast 2024-2029 ($ million)
- Chart on Cosmetic - Year-over-year growth 2024-2029 (%)
- Data Table on Cosmetic - Year-over-year growth 2024-2029 (%)
- 11.5 Neutraceutical - Market size and forecast 2024-2029
- Chart on Neutraceutical - Market size and forecast 2024-2029 ($ million)
- Data Table on Neutraceutical - Market size and forecast 2024-2029 ($ million)
- Chart on Neutraceutical - Year-over-year growth 2024-2029 (%)
- Data Table on Neutraceutical - Year-over-year growth 2024-2029 (%)
- 11.6 Market opportunity by End-user
- Market opportunity by End-user ($ million)
- Data Table on Market opportunity by End-user ($ million)
12 Customer Landscape
- 12.1 Customer landscape overview
- Analysis of price sensitivity, lifecycle, customer purchase basket, adoption rates, and purchase criteria
13 Geographic Landscape
- 13.1 Geographic segmentation
- Chart on Market share By Geographical Landscape 2024-2029 (%)
- Data Table on Market share By Geographical Landscape 2024-2029 (%)
- 13.2 Geographic comparison
- Chart on Geographic comparison
- Data Table on Geographic comparison
- 13.3 Europe - Market size and forecast 2024-2029
- Chart on Europe - Market size and forecast 2024-2029 ($ million)
- Data Table on Europe - Market size and forecast 2024-2029 ($ million)
- Chart on Europe - Year-over-year growth 2024-2029 (%)
- Data Table on Europe - Year-over-year growth 2024-2029 (%)
- 13.4 North America - Market size and forecast 2024-2029
- Chart on North America - Market size and forecast 2024-2029 ($ million)
- Data Table on North America - Market size and forecast 2024-2029 ($ million)
- Chart on North America - Year-over-year growth 2024-2029 (%)
- Data Table on North America - Year-over-year growth 2024-2029 (%)
- 13.5 APAC - Market size and forecast 2024-2029
- Chart on APAC - Market size and forecast 2024-2029 ($ million)
- Data Table on APAC - Market size and forecast 2024-2029 ($ million)
- Chart on APAC - Year-over-year growth 2024-2029 (%)
- Data Table on APAC - Year-over-year growth 2024-2029 (%)
- 13.6 South America - Market size and forecast 2024-2029
- Chart on South America - Market size and forecast 2024-2029 ($ million)
- Data Table on South America - Market size and forecast 2024-2029 ($ million)
- Chart on South America - Year-over-year growth 2024-2029 (%)
- Data Table on South America - Year-over-year growth 2024-2029 (%)
- 13.7 Middle East and Africa - Market size and forecast 2024-2029
- Chart on Middle East and Africa - Market size and forecast 2024-2029 ($ million)
- Data Table on Middle East and Africa - Market size and forecast 2024-2029 ($ million)
- Chart on Middle East and Africa - Year-over-year growth 2024-2029 (%)
- Data Table on Middle East and Africa - Year-over-year growth 2024-2029 (%)
- 13.8 US - Market size and forecast 2024-2029
- Chart on US - Market size and forecast 2024-2029 ($ million)
- Data Table on US - Market size and forecast 2024-2029 ($ million)
- Chart on US - Year-over-year growth 2024-2029 (%)
- Data Table on US - Year-over-year growth 2024-2029 (%)
- 13.9 UK - Market size and forecast 2024-2029
- Chart on UK - Market size and forecast 2024-2029 ($ million)
- Data Table on UK - Market size and forecast 2024-2029 ($ million)
- Chart on UK - Year-over-year growth 2024-2029 (%)
- Data Table on UK - Year-over-year growth 2024-2029 (%)
- 13.10 Germany - Market size and forecast 2024-2029
- Chart on Germany - Market size and forecast 2024-2029 ($ million)
- Data Table on Germany - Market size and forecast 2024-2029 ($ million)
- Chart on Germany - Year-over-year growth 2024-2029 (%)
- Data Table on Germany - Year-over-year growth 2024-2029 (%)
- 13.11 France - Market size and forecast 2024-2029
- Chart on France - Market size and forecast 2024-2029 ($ million)
- Data Table on France - Market size and forecast 2024-2029 ($ million)
- Chart on France - Year-over-year growth 2024-2029 (%)
- Data Table on France - Year-over-year growth 2024-2029 (%)
- 13.12 Italy - Market size and forecast 2024-2029
- Chart on Italy - Market size and forecast 2024-2029 ($ million)
- Data Table on Italy - Market size and forecast 2024-2029 ($ million)
- Chart on Italy - Year-over-year growth 2024-2029 (%)
- Data Table on Italy - Year-over-year growth 2024-2029 (%)
- 13.13 The Netherlands - Market size and forecast 2024-2029
- Chart on The Netherlands - Market size and forecast 2024-2029 ($ million)
- Data Table on The Netherlands - Market size and forecast 2024-2029 ($ million)
- Chart on The Netherlands - Year-over-year growth 2024-2029 (%)
- Data Table on The Netherlands - Year-over-year growth 2024-2029 (%)
- 13.14 Spain - Market size and forecast 2024-2029
- Chart on Spain - Market size and forecast 2024-2029 ($ million)
- Data Table on Spain - Market size and forecast 2024-2029 ($ million)
- Chart on Spain - Year-over-year growth 2024-2029 (%)
- Data Table on Spain - Year-over-year growth 2024-2029 (%)
- 13.15 Canada - Market size and forecast 2024-2029
- Chart on Canada - Market size and forecast 2024-2029 ($ million)
- Data Table on Canada - Market size and forecast 2024-2029 ($ million)
- Chart on Canada - Year-over-year growth 2024-2029 (%)
- Data Table on Canada - Year-over-year growth 2024-2029 (%)
- 13.16 China - Market size and forecast 2024-2029
- Chart on China - Market size and forecast 2024-2029 ($ million)
- Data Table on China - Market size and forecast 2024-2029 ($ million)
- Chart on China - Year-over-year growth 2024-2029 (%)
- Data Table on China - Year-over-year growth 2024-2029 (%)
- 13.17 Japan - Market size and forecast 2024-2029
- Chart on Japan - Market size and forecast 2024-2029 ($ million)
- Data Table on Japan - Market size and forecast 2024-2029 ($ million)
- Chart on Japan - Year-over-year growth 2024-2029 (%)
- Data Table on Japan - Year-over-year growth 2024-2029 (%)
- 13.18 Market opportunity By Geographical Landscape
- Market opportunity By Geographical Landscape ($ million)
- Data Tables on Market opportunity By Geographical Landscape ($ million)
14 Drivers, Challenges, and Opportunity/Restraints
- 14.1 Market drivers
- 14.2 Market challenges
- 14.3 Impact of drivers and challenges
- Impact of drivers and challenges in 2024 and 2029
- 14.4 Market opportunities/restraints
15 Competitive Landscape
- 15.1 Overview
- 15.2 Competitive Landscape
- Overview on criticality of inputs and factors of differentiation
- 15.3 Landscape disruption
- Overview on factors of disruption
- 15.4 Industry risks
- Impact of key risks on business
16 Competitive Analysis
- 16.1 Companies profiled
- Companies covered
- 16.2 Company ranking index
- Company ranking index
- 16.3 Market positioning of companies
- Matrix on companies position and classification
- 16.4 Basse Nuts
- Basse Nuts - Overview
- Basse Nuts - Product / Service
- Basse Nuts - Key offerings
- SWOT
- 16.5 FLORENZANO NUTS
- FLORENZANO NUTS - Overview
- FLORENZANO NUTS - Product / Service
- FLORENZANO NUTS - Key offerings
- SWOT
- 16.6 Happilo International Pvt. Ltd.
- Happilo International Pvt. Ltd. - Overview
- Happilo International Pvt. Ltd. - Product / Service
- Happilo International Pvt. Ltd. - Key offerings
- SWOT
- 16.7 Urban Platter
- Urban Platter - Overview
- Urban Platter - Product / Service
- Urban Platter - Key offerings
- SWOT
- 16.8 Food to Live
- Food to Live - Overview
- Food to Live - Product / Service
- Food to Live - Key offerings
- SWOT
- 16.9 NOW Foods
- NOW Foods - Overview
- NOW Foods - Product / Service
- NOW Foods - Key offerings
- SWOT
- 16.10 Nut Cravings
- Nut Cravings - Overview
- Nut Cravings - Product / Service
- Nut Cravings - Key offerings
- SWOT
- 16.11 Nuts.com Inc.
- Nuts.com Inc. - Overview
- Nuts.com Inc. - Product / Service
- Nuts.com Inc. - Key offerings
- SWOT
- 16.12 Nutshup
- Nutshup - Overview
- Nutshup - Product / Service
- Nutshup - Key offerings
- SWOT
- 16.13 Royal Nut Co.
- Royal Nut Co. - Overview
- Royal Nut Co. - Product / Service
- Royal Nut Co. - Key offerings
- SWOT
- 16.14 Select Harvests Ltd.
- Select Harvests Ltd. - Overview
- Select Harvests Ltd. - Business segments
- Select Harvests Ltd. - Key offerings
- Select Harvests Ltd. - Segment focus
- SWOT
- 16.15 Sunfood
- Sunfood - Overview
- Sunfood - Product / Service
- Sunfood - Key offerings
- SWOT
- 16.16 Terrasoul Superfoods
- Terrasoul Superfoods - Overview
- Terrasoul Superfoods - Product / Service
- Terrasoul Superfoods - Key offerings
- SWOT
- 16.17 The Roasting Company
- The Roasting Company - Overview
- The Roasting Company - Product / Service
- The Roasting Company - Key offerings
- SWOT
- 16.18 Wildly Organic
- Wildly Organic - Overview
- Wildly Organic - Product / Service
- Wildly Organic - Key offerings
- SWOT
17 Appendix
- 17.1 Scope of the report
- 17.2 Inclusions and exclusions checklist
- Inclusions checklist
- Exclusions checklist
- 17.3 Currency conversion rates for US$
- Currency conversion rates for US$
- 17.4 Research methodology
- Research methodology
- 17.5 Data procurement
- Information sources
- 17.6 Data validation
- Data validation
- 17.7 Validation techniques employed for market sizing
- Validation techniques employed for market sizing
- 17.8 Data synthesis
- Data synthesis
- 17.9 360 degree market analysis
- 360 degree market analysis
- 17.10 List of abbreviations
- List of abbreviations
