|
|
市場調査レポート
商品コード
1915360
世界の民間・軍用航空機整備・修理・オーバーホール(MRO)市場2026-2030年Global Commercial And Military Aircraft Mro Market 2026-2030 |
||||||
|
|||||||
カスタマイズ可能
|
|||||||

| 世界の民間・軍用航空機整備・修理・オーバーホール(MRO)市場2026-2030年 |
|
出版日: 2026年01月19日
発行: TechNavio
ページ情報: 英文 300 Pages
納期: 即納可能
|

概要
世界の民間・軍用航空機MRO市場は、2025年から2030年にかけて223億5,330万米ドルの成長が見込まれており、予測期間中のCAGRは4.6%と予測されています。
本報告書では、世界の民間・軍用航空機MRO市場に関する包括的な分析、市場規模と予測、動向、成長要因、課題に加え、約25社のベンダー分析を提供しております。
本レポートは、現在の市場状況、最新の動向と促進要因、市場環境全般に関する最新の分析を提供します。市場は、世界の航空機機材の増加、既存航空機の耐用年数延長、航空機安全・規制順守・運用信頼性への注目の高まり、技術進歩、航空機システムの複雑化によって牽引されています。
本調査は、業界の主要関係者からの情報を含む、一次情報と二次情報の客観的な組み合わせを用いて実施されました。本レポートには、主要企業の分析に加え、包括的な市場規模データ、地域別分析を伴うセグメント、ベンダー情勢が含まれています。レポートには過去データと予測データが掲載されています。
| 市場範囲 | |
|---|---|
| 基準年 | 2026年 |
| 対象期間 | 2030年 |
| 予測期間 | 2026-2030 |
| 成長モメンタム | 加速 |
| 前年比2026年 | 4.5% |
| CAGR | 4.6% |
| 増分額 | 223億5,330万米ドル |
本調査では、今後数年間における世界の民間・軍用航空機MRO市場成長の主要要因の一つとして、予測型およびデータ駆動型メンテナンス手法の採用拡大を挙げております。また、メンテナンス業務の外部委託や長期サービス契約の増加、新興航空ハブにおけるMRO能力の拡充が、市場における相当な需要創出につながると見込まれます。
目次
第1章 エグゼクティブサマリー
第2章 Technavio分析
- 価格・ライフサイクル・顧客購入バスケット・採用率・購入基準の分析
- インプットの重要性と差別化の要因
- 混乱の要因
- 促進要因と課題の影響
第3章 市場情勢
- 市場エコシステム
- 市場の特徴
- バリューチェーン分析
第4章 市場規模
- 市場の定義
- 市場セグメント分析
- 市場規模 2025
- 市場の見通し 2025-2030
第5章 市場規模実績
- 世界の民間・軍用航空機整備・修理・オーバーホール(MRO)市場 2020-2024
- エンドユーザーセグメント分析 2020-2024
- 部品セグメント分析 2020-2024
- タイプセグメント分析 2020-2024
- 地域別セグメント分析 2020-2024
- 国別セグメント分析 2020-2024
第6章 定性分析
- AIが及ぼす影響世界の民間・軍用航空機整備・修理・オーバーホール(MRO)市場
第7章 ファイブフォース分析
- ファイブフォースの要約
- 買い手の交渉力
- 供給企業の交渉力
- 新規参入業者の脅威
- 代替品の脅威
- 競争の脅威
- 市況
第8章 市場セグメンテーション:エンドユーザー別
- 比較:エンドユーザー別
- 軍事
- 商業用
- 市場機会:エンドユーザー別
第9章 市場セグメンテーション:コンポーネント別
- 比較:コンポーネント別
- エンジンオーバーホール
- 機体整備
- ライン整備
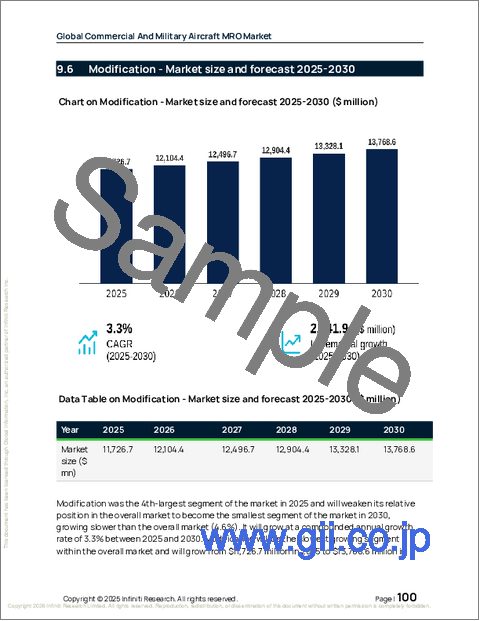
- 改造
- コンポーネント
- 市場機会:コンポーネント別
第10章 市場セグメンテーション:タイプ別
- 比較:タイプ別
- 大型フリート
- 小規模フリート
- 市場機会:タイプ別
第11章 顧客情勢
第12章 地域別情勢
- 地域別セグメンテーション
- 地域別比較
- アジア太平洋
- 中国
- インド
- 日本
- シンガポール
- 韓国
- インドネシア
- 北米
- 米国
- カナダ
- メキシコ
- 欧州
- ドイツ
- 英国
- フランス
- イタリア
- スペイン
- オランダ
- 中東・アフリカ
- アラブ首長国連邦
- サウジアラビア
- 南アフリカ
- エジプト
- イスラエル
- 南米
- ブラジル
- アルゼンチン
- チリ
- 市場機会:地域別
第13章 促進要因・課題・機会
- 市場促進要因
- 市場の課題
- 促進要因と課題の影響
- 市場機会
第14章 競合情勢
- 概要
- 競合情勢
- 混乱の状況
- 業界のリスク
第15章 競合分析
- 企業プロファイル
- 企業ランキング指標
- 企業の市場ポジショニング
- AAR Corp.
- Air France KLM SA
- Airbus SE
- Barnes Aerospace
- Delta Air Lines Inc.
- General Electric Co.
- Israel Aerospace Ltd.
- Lockheed Martin Corp.
- MTU Aero Engines AG
- RTX Corp.
- Safran SA
- ST Engineering Ltd.
- StandardAero
- Thales Group
- The Boeing Co.

