|
|
市場調査レポート
商品コード
1652919
世界の保険市場(2025年~2029年)Global Insurance Market 2025-2029 |
||||||

|
|||||||
カスタマイズ可能
|
|||||||


| 世界の保険市場(2025年~2029年) |
|
出版日: 2025年01月25日
発行: TechNavio
ページ情報: 英文 203 Pages
納期: 即納可能
|

全表示
- 概要
- 目次
世界の保険の市場規模は、2024年~2029年に1兆4,615億米ドルに達し、予測期間中のCAGRは4.3%で成長すると予測されます。
当レポートでは、保険市場の全体的な分析、市場規模・予測、動向、成長促進要因、課題、約25のベンダーを網羅したベンダー分析などを掲載しています。
当レポートは、現在の市場シナリオ、最新動向と促進要因、市場環境全体に関する最新分析を提供しています。新興国市場における保険加入義務化に関する政府規制の増加、保険需要の増加につながる不確実な大災害、保険市場のデジタル化などが市場を牽引しています。
| 市場範囲 | |
|---|---|
| 基準年 | 2025年 |
| 終了年 | 2029年 |
| 予測期間 | 2025年~2029年 |
| 成長モメンタム | 加速 |
| 前年比2025年 | 4.1% |
| CAGR | 4.3% |
| 増分額 | 1兆4,615億米ドル |
本調査は、業界の主要参入企業からのインプットを含め、一次情報と二次情報を客観的に組み合わせて実施しました。本レポートには、主要企業の分析に加え、包括的な市場規模データ、地域分析によるセグメント、ベンダー情勢が含まれています。レポートには実績データと予測データがあります。
本調査では、今後数年間の保険市場の成長を促進する主な理由の1つとして、ウェアラブルを生命保険ソフトウェアの顧客エンゲージメント指標に統合することを挙げています。また、インシュアテック企業と協力する投資家や、家庭用保険業界における新たな技術開発は、市場の大きな需要につながると思われます。
目次
第1章 エグゼクティブサマリー
- 市場概要
第2章 Technavioの分析
- 価格感度・ライフサイクル・顧客購入バスケット・採用率・購入基準の分析
- インプットの重要性と差別化の要因
- ディスラプションの要因
- 促進要因と課題の影響
第3章 市場情勢
- 市場エコシステム
- 市場の特徴
- バリューチェーン分析
第4章 市場規模
- 市場の定義
- 市場セグメント分析
- 市場規模(2024年)
- 市場の見通し(2024年~2029年)
第5章 市場規模実績
- 世界の保険市場(2019年~2023年)
- 流通チャネルセグメント分析(2019年~2023年)
- タイプセグメント分析(2019年~2023年)
- 地域セグメント分析(2019年~2023年)
- 国セグメント分析(2019年~2023年)
第6章 定性分析
- AIの影響:世界の保険市場
第7章 ファイブフォース分析
- ファイブフォースの要約
- 買い手の交渉力
- 供給企業の交渉力
- 新規参入業者の脅威
- 代替品の脅威
- 競争の脅威
- 市況
第8章 市場セグメンテーション:流通チャネル別
- 市場セグメント
- 比較:流通チャネル別
- 営業担当者:市場規模と予測(2024年~2029年)
- 保険代理店:市場規模と予測(2024年~2029年)
- 市場機会:流通チャネル別
第9章 市場セグメンテーション:タイプ別
- 市場セグメント
- 比較:タイプ別
- 生命保険:市場規模と予測(2024年~2029年)
- 非生命保険:市場規模と予測(2024年~2029年)
- 市場機会:タイプ別
第10章 顧客情勢
- 顧客情勢の概要
第11章 地域別情勢
- 地域別セグメンテーション
- 地域別比較
- 北米:市場規模と予測(2024年~2029年)
- アジア太平洋:市場規模と予測(2024年~2029年)
- 欧州:市場規模と予測(2024年~2029年)
- 南米:市場規模と予測(2024年~2029年)
- 中東・アフリカ:市場規模と予測(2024年~2029年)
- 米国:市場規模と予測(2024年~2029年)
- 中国:市場規模と予測(2024年~2029年)
- 日本:市場規模と予測(2024年~2029年)
- 英国:市場規模と予測(2024年~2029年)
- フランス:市場規模と予測(2024年~2029年)
- インド:市場規模と予測(2024年~2029年)
- ドイツ:市場規模と予測(2024年~2029年)
- オーストラリア:市場規模と予測(2024年~2029年)
- 韓国:市場規模と予測(2024年~2029年)
- カナダ:市場規模と予測(2024年~2029年)
- 市場機会:地域情勢別
第12章 促進要因・課題・機会・抑制要因
- 市場促進要因
- 市場の課題
- 促進要因と課題の影響
- 市場の機会・抑制要因
第13章 競合情勢
- 概要
- 競合情勢
- ディスラプションの状況
- 業界のリスク
第14章 競合分析
- 企業プロファイル
- 企業ランキング指数
- 企業の市場ポジショニング
- Aditya Birla Management Corp. Pvt. Ltd.
- Allianz SE
- American International Group Inc.
- AXA Group
- Bank of America Corp.
- Berkshire Hathaway Inc.
- Canara Bank
- Citigroup Inc.
- HDFC Bank Ltd.
- ICICI Bank Ltd.
- JPMorgan Chase and Co.
- Kotak Mahindra Bank Ltd.
- Life Insurance Corp. of India
- Microsoft Corp.
- Wells Fargo and Co.
第15章 付録
The insurance market is forecasted to grow by USD 1461.5 bn during 2024-2029, accelerating at a CAGR of 4.3% during the forecast period. The report on the insurance market provides a holistic analysis, market size and forecast, trends, growth drivers, and challenges, as well as vendor analysis covering around 25 vendors.
The report offers an up-to-date analysis regarding the current market scenario, the latest trends and drivers, and the overall market environment. The market is driven by increasing government regulations on mandatory insurance coverage in developing countries, uncertain catastrophic events leading to increasing demand for insurance, and digitalization of insurance market.
| Market Scope | |
|---|---|
| Base Year | 2025 |
| End Year | 2029 |
| Series Year | 2025-2029 |
| Growth Momentum | Accelerate |
| YOY 2025 | 4.1% |
| CAGR | 4.3% |
| Incremental Value | $1461.5 bn |
The study was conducted using an objective combination of primary and secondary information including inputs from key participants in the industry. The report contains a comprehensive market size data, segment with regional analysis and vendor landscape in addition to an analysis of the key companies. Reports have historic and forecast data.
Technavio's insurance market is segmented as below:
By Distribution Channel
- Sales personnel
- Insurance agencies
By Type
- Life
- Non-life
By Geographical Landscape
- North America
- APAC
- Europe
- South America
- Middle East and Africa
This study identifies the integration of wearables into customer engagement metrics for life insurance software as one of the prime reasons driving the insurance market growth during the next few years. Also, investors collaborating with insurtech firms and new technological developments in home insurance industry will lead to sizable demand in the market.
The report on the insurance market covers the following areas:
- Insurance Market sizing
- Insurance Market forecast
- Insurance Market industry analysis
The robust vendor analysis is designed to help clients improve their market position, and in line with this, this report provides a detailed analysis of several leading insurance market vendors that include Aditya Birla Management Corp. Pvt. Ltd., Allianz SE, American International Group Inc., AXA Group, Bank of America Corp., Berkshire Hathaway Inc., Canara Bank, Citigroup Inc., Go Digit General Insurance Ltd., HDFC Bank Ltd., ICICI Bank Ltd., JPMorgan Chase and Co., Kotak Mahindra Bank Ltd., Life Insurance Corp. of India, Microsoft Corp., State Bank of India, THE PNC FINANCIAL SERVICES GROUP INC., Truist Financial Corp., U.S. Bancorp, and Wells Fargo and Co.. Also, the insurance market analysis report includes information on upcoming trends and challenges that will influence market growth. This is to help companies strategize and leverage all forthcoming growth opportunities.
The publisher presents a detailed picture of the market by the way of study, synthesis, and summation of data from multiple sources by an analysis of key parameters such as profit, pricing, competition, and promotions. It presents various market facets by identifying the key industry influencers. The data presented is comprehensive, reliable, and a result of extensive primary and secondary research. The market research reports provide a complete competitive landscape and an in-depth vendor selection methodology and analysis using qualitative and quantitative research to forecast accurate market growth.
Table of Contents
1 Executive Summary
- 1.1 Market overview
- Executive Summary - Chart on Market Overview
- Executive Summary - Data Table on Market Overview
- Executive Summary - Chart on Global Market Characteristics
- Executive Summary - Chart on Market By Geographical Landscape
- Executive Summary - Chart on Market Segmentation by Distribution Channel
- Executive Summary - Chart on Market Segmentation by Type
- Executive Summary - Chart on Incremental Growth
- Executive Summary - Data Table on Incremental Growth
- Executive Summary - Chart on Company Market Positioning
2 Technavio Analysis
- 2.1 Analysis of price sensitivity, lifecycle, customer purchase basket, adoption rates, and purchase criteria
- Analysis of price sensitivity, lifecycle, customer purchase basket, adoption rates, and purchase criteria
- 2.2 Criticality of inputs and Factors of differentiation
- Overview on criticality of inputs and factors of differentiation
- 2.3 Factors of disruption
- Overview on factors of disruption
- 2.4 Impact of drivers and challenges
- Impact of drivers and challenges in 2024 and 2029
3 Market Landscape
- 3.1 Market ecosystem
- Parent Market
- Data Table on - Parent Market
- 3.2 Market characteristics
- Market characteristics analysis
- 3.3 Value chain analysis
- Value chain analysis
4 Market Sizing
- 4.1 Market definition
- Offerings of companies included in the market definition
- 4.2 Market segment analysis
- Market segments
- 4.3 Market size 2024
- 4.4 Market outlook: Forecast for 2024-2029
- Chart on Global - Market size and forecast 2024-2029 ($ billion)
- Data Table on Global - Market size and forecast 2024-2029 ($ billion)
- Chart on Global Market: Year-over-year growth 2024-2029 (%)
- Data Table on Global Market: Year-over-year growth 2024-2029 (%)
5 Historic Market Size
- 5.1 Global Insurance Market 2019 - 2023
- Historic Market Size - Data Table on Global Insurance Market 2019 - 2023 ($ billion)
- 5.2 Distribution Channel segment analysis 2019 - 2023
- Historic Market Size - Distribution Channel Segment 2019 - 2023 ($ billion)
- 5.3 Type segment analysis 2019 - 2023
- Historic Market Size - Type Segment 2019 - 2023 ($ billion)
- 5.4 Geography segment analysis 2019 - 2023
- Historic Market Size - Geography Segment 2019 - 2023 ($ billion)
- 5.5 Country segment analysis 2019 - 2023
- Historic Market Size - Country Segment 2019 - 2023 ($ billion)
6 Qualitative Analysis
- 6.1 The AI impact on Global Insurance Market
7 Five Forces Analysis
- 7.1 Five forces summary
- Five forces analysis - Comparison between 2024 and 2029
- 7.2 Bargaining power of buyers
- Bargaining power of buyers - Impact of key factors 2024 and 2029
- 7.3 Bargaining power of suppliers
- Bargaining power of suppliers - Impact of key factors in 2024 and 2029
- 7.4 Threat of new entrants
- Threat of new entrants - Impact of key factors in 2024 and 2029
- 7.5 Threat of substitutes
- Threat of substitutes - Impact of key factors in 2024 and 2029
- 7.6 Threat of rivalry
- Threat of rivalry - Impact of key factors in 2024 and 2029
- 7.7 Market condition
- Chart on Market condition - Five forces 2024 and 2029
8 Market Segmentation by Distribution Channel
- 8.1 Market segments
- Chart on Distribution Channel - Market share 2024-2029 (%)
- Data Table on Distribution Channel - Market share 2024-2029 (%)
- 8.2 Comparison by Distribution Channel
- Chart on Comparison by Distribution Channel
- Data Table on Comparison by Distribution Channel
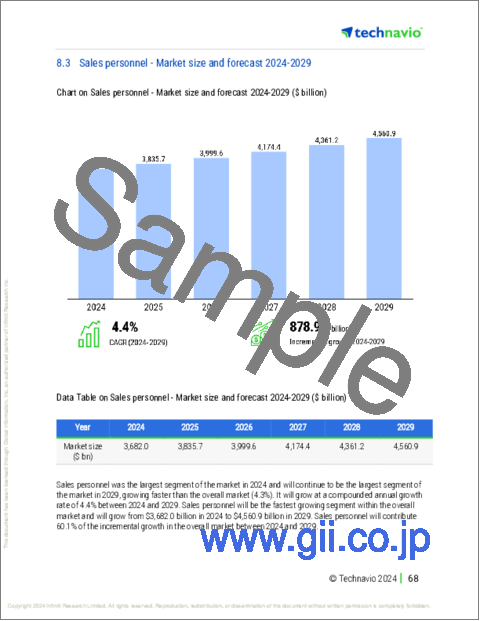
- 8.3 Sales personnel - Market size and forecast 2024-2029
- Chart on Sales personnel - Market size and forecast 2024-2029 ($ billion)
- Data Table on Sales personnel - Market size and forecast 2024-2029 ($ billion)
- Chart on Sales personnel - Year-over-year growth 2024-2029 (%)
- Data Table on Sales personnel - Year-over-year growth 2024-2029 (%)
- 8.4 Insurance agencies - Market size and forecast 2024-2029
- Chart on Insurance agencies - Market size and forecast 2024-2029 ($ billion)
- Data Table on Insurance agencies - Market size and forecast 2024-2029 ($ billion)
- Chart on Insurance agencies - Year-over-year growth 2024-2029 (%)
- Data Table on Insurance agencies - Year-over-year growth 2024-2029 (%)
- 8.5 Market opportunity by Distribution Channel
- Market opportunity by Distribution Channel ($ billion)
- Data Table on Market opportunity by Distribution Channel ($ billion)
9 Market Segmentation by Type
- 9.1 Market segments
- Chart on Type - Market share 2024-2029 (%)
- Data Table on Type - Market share 2024-2029 (%)
- 9.2 Comparison by Type
- Chart on Comparison by Type
- Data Table on Comparison by Type
- 9.3 Life - Market size and forecast 2024-2029
- Chart on Life - Market size and forecast 2024-2029 ($ billion)
- Data Table on Life - Market size and forecast 2024-2029 ($ billion)
- Chart on Life - Year-over-year growth 2024-2029 (%)
- Data Table on Life - Year-over-year growth 2024-2029 (%)
- 9.4 Non-life - Market size and forecast 2024-2029
- Chart on Non-life - Market size and forecast 2024-2029 ($ billion)
- Data Table on Non-life - Market size and forecast 2024-2029 ($ billion)
- Chart on Non-life - Year-over-year growth 2024-2029 (%)
- Data Table on Non-life - Year-over-year growth 2024-2029 (%)
- 9.5 Market opportunity by Type
- Market opportunity by Type ($ billion)
- Data Table on Market opportunity by Type ($ billion)
10 Customer Landscape
- 10.1 Customer landscape overview
- Analysis of price sensitivity, lifecycle, customer purchase basket, adoption rates, and purchase criteria
11 Geographic Landscape
- 11.1 Geographic segmentation
- Chart on Market share By Geographical Landscape 2024-2029 (%)
- Data Table on Market share By Geographical Landscape 2024-2029 (%)
- 11.2 Geographic comparison
- Chart on Geographic comparison
- Data Table on Geographic comparison
- 11.3 North America - Market size and forecast 2024-2029
- Chart on North America - Market size and forecast 2024-2029 ($ billion)
- Data Table on North America - Market size and forecast 2024-2029 ($ billion)
- Chart on North America - Year-over-year growth 2024-2029 (%)
- Data Table on North America - Year-over-year growth 2024-2029 (%)
- 11.4 APAC - Market size and forecast 2024-2029
- Chart on APAC - Market size and forecast 2024-2029 ($ billion)
- Data Table on APAC - Market size and forecast 2024-2029 ($ billion)
- Chart on APAC - Year-over-year growth 2024-2029 (%)
- Data Table on APAC - Year-over-year growth 2024-2029 (%)
- 11.5 Europe - Market size and forecast 2024-2029
- Chart on Europe - Market size and forecast 2024-2029 ($ billion)
- Data Table on Europe - Market size and forecast 2024-2029 ($ billion)
- Chart on Europe - Year-over-year growth 2024-2029 (%)
- Data Table on Europe - Year-over-year growth 2024-2029 (%)
- 11.6 South America - Market size and forecast 2024-2029
- Chart on South America - Market size and forecast 2024-2029 ($ billion)
- Data Table on South America - Market size and forecast 2024-2029 ($ billion)
- Chart on South America - Year-over-year growth 2024-2029 (%)
- Data Table on South America - Year-over-year growth 2024-2029 (%)
- 11.7 Middle East and Africa - Market size and forecast 2024-2029
- Chart on Middle East and Africa - Market size and forecast 2024-2029 ($ billion)
- Data Table on Middle East and Africa - Market size and forecast 2024-2029 ($ billion)
- Chart on Middle East and Africa - Year-over-year growth 2024-2029 (%)
- Data Table on Middle East and Africa - Year-over-year growth 2024-2029 (%)
- 11.8 US - Market size and forecast 2024-2029
- Chart on US - Market size and forecast 2024-2029 ($ billion)
- Data Table on US - Market size and forecast 2024-2029 ($ billion)
- Chart on US - Year-over-year growth 2024-2029 (%)
- Data Table on US - Year-over-year growth 2024-2029 (%)
- 11.9 China - Market size and forecast 2024-2029
- Chart on China - Market size and forecast 2024-2029 ($ billion)
- Data Table on China - Market size and forecast 2024-2029 ($ billion)
- Chart on China - Year-over-year growth 2024-2029 (%)
- Data Table on China - Year-over-year growth 2024-2029 (%)
- 11.10 Japan - Market size and forecast 2024-2029
- Chart on Japan - Market size and forecast 2024-2029 ($ billion)
- Data Table on Japan - Market size and forecast 2024-2029 ($ billion)
- Chart on Japan - Year-over-year growth 2024-2029 (%)
- Data Table on Japan - Year-over-year growth 2024-2029 (%)
- 11.11 UK - Market size and forecast 2024-2029
- Chart on UK - Market size and forecast 2024-2029 ($ billion)
- Data Table on UK - Market size and forecast 2024-2029 ($ billion)
- Chart on UK - Year-over-year growth 2024-2029 (%)
- Data Table on UK - Year-over-year growth 2024-2029 (%)
- 11.12 France - Market size and forecast 2024-2029
- Chart on France - Market size and forecast 2024-2029 ($ billion)
- Data Table on France - Market size and forecast 2024-2029 ($ billion)
- Chart on France - Year-over-year growth 2024-2029 (%)
- Data Table on France - Year-over-year growth 2024-2029 (%)
- 11.13 India - Market size and forecast 2024-2029
- Chart on India - Market size and forecast 2024-2029 ($ billion)
- Data Table on India - Market size and forecast 2024-2029 ($ billion)
- Chart on India - Year-over-year growth 2024-2029 (%)
- Data Table on India - Year-over-year growth 2024-2029 (%)
- 11.14 Germany - Market size and forecast 2024-2029
- Chart on Germany - Market size and forecast 2024-2029 ($ billion)
- Data Table on Germany - Market size and forecast 2024-2029 ($ billion)
- Chart on Germany - Year-over-year growth 2024-2029 (%)
- Data Table on Germany - Year-over-year growth 2024-2029 (%)
- 11.15 Australia - Market size and forecast 2024-2029
- Chart on Australia - Market size and forecast 2024-2029 ($ billion)
- Data Table on Australia - Market size and forecast 2024-2029 ($ billion)
- Chart on Australia - Year-over-year growth 2024-2029 (%)
- Data Table on Australia - Year-over-year growth 2024-2029 (%)
- 11.16 South Korea - Market size and forecast 2024-2029
- Chart on South Korea - Market size and forecast 2024-2029 ($ billion)
- Data Table on South Korea - Market size and forecast 2024-2029 ($ billion)
- Chart on South Korea - Year-over-year growth 2024-2029 (%)
- Data Table on South Korea - Year-over-year growth 2024-2029 (%)
- 11.17 Canada - Market size and forecast 2024-2029
- Chart on Canada - Market size and forecast 2024-2029 ($ billion)
- Data Table on Canada - Market size and forecast 2024-2029 ($ billion)
- Chart on Canada - Year-over-year growth 2024-2029 (%)
- Data Table on Canada - Year-over-year growth 2024-2029 (%)
- 11.18 Market opportunity By Geographical Landscape
- Market opportunity By Geographical Landscape ($ billion)
- Data Tables on Market opportunity By Geographical Landscape ($ billion)
12 Drivers, Challenges, and Opportunity/Restraints
- 12.1 Market drivers
- 12.2 Market challenges
- 12.3 Impact of drivers and challenges
- Impact of drivers and challenges in 2024 and 2029
- 12.4 Market opportunities/restraints
13 Competitive Landscape
- 13.1 Overview
- 13.2 Competitive Landscape
- Overview on criticality of inputs and factors of differentiation
- 13.3 Landscape disruption
- Overview on factors of disruption
- 13.4 Industry risks
- Impact of key risks on business
14 Competitive Analysis
- 14.1 Companies profiled
- Companies covered
- 14.2 Company ranking index
- Company ranking index
- 14.3 Market positioning of companies
- Matrix on companies position and classification
- 14.4 Aditya Birla Management Corp. Pvt. Ltd.
- Aditya Birla Management Corp. Pvt. Ltd. - Overview
- Aditya Birla Management Corp. Pvt. Ltd. - Product / Service
- Aditya Birla Management Corp. Pvt. Ltd. - Key news
- Aditya Birla Management Corp. Pvt. Ltd. - Key offerings
- SWOT
- 14.5 Allianz SE
- Allianz SE - Overview
- Allianz SE - Business segments
- Allianz SE - Key news
- Allianz SE - Key offerings
- Allianz SE - Segment focus
- SWOT
- 14.6 American International Group Inc.
- American International Group Inc. - Overview
- American International Group Inc. - Business segments
- American International Group Inc. - Key news
- American International Group Inc. - Key offerings
- American International Group Inc. - Segment focus
- SWOT
- 14.7 AXA Group
- AXA Group - Overview
- AXA Group - Business segments
- AXA Group - Key news
- AXA Group - Key offerings
- AXA Group - Segment focus
- SWOT
- 14.8 Bank of America Corp.
- Bank of America Corp. - Overview
- Bank of America Corp. - Business segments
- Bank of America Corp. - Key news
- Bank of America Corp. - Key offerings
- Bank of America Corp. - Segment focus
- SWOT
- 14.9 Berkshire Hathaway Inc.
- Berkshire Hathaway Inc. - Overview
- Berkshire Hathaway Inc. - Business segments
- Berkshire Hathaway Inc. - Key news
- Berkshire Hathaway Inc. - Key offerings
- Berkshire Hathaway Inc. - Segment focus
- SWOT
- 14.10 Canara Bank
- Canara Bank - Overview
- Canara Bank - Product / Service
- Canara Bank - Key offerings
- SWOT
- 14.11 Citigroup Inc.
- Citigroup Inc. - Overview
- Citigroup Inc. - Business segments
- Citigroup Inc. - Key news
- Citigroup Inc. - Key offerings
- Citigroup Inc. - Segment focus
- SWOT
- 14.12 HDFC Bank Ltd.
- HDFC Bank Ltd. - Overview
- HDFC Bank Ltd. - Business segments
- HDFC Bank Ltd. - Key offerings
- HDFC Bank Ltd. - Segment focus
- SWOT
- 14.13 ICICI Bank Ltd.
- ICICI Bank Ltd. - Overview
- ICICI Bank Ltd. - Business segments
- ICICI Bank Ltd. - Key offerings
- ICICI Bank Ltd. - Segment focus
- SWOT
- 14.14 JPMorgan Chase and Co.
- JPMorgan Chase and Co. - Overview
- JPMorgan Chase and Co. - Business segments
- JPMorgan Chase and Co. - Key offerings
- JPMorgan Chase and Co. - Segment focus
- SWOT
- 14.15 Kotak Mahindra Bank Ltd.
- Kotak Mahindra Bank Ltd. - Overview
- Kotak Mahindra Bank Ltd. - Business segments
- Kotak Mahindra Bank Ltd. - Key offerings
- Kotak Mahindra Bank Ltd. - Segment focus
- SWOT
- 14.16 Life Insurance Corp. of India
- Life Insurance Corp. of India - Overview
- Life Insurance Corp. of India - Product / Service
- Life Insurance Corp. of India - Key offerings
- SWOT
- 14.17 Microsoft Corp.
- Microsoft Corp. - Overview
- Microsoft Corp. - Business segments
- Microsoft Corp. - Key news
- Microsoft Corp. - Key offerings
- Microsoft Corp. - Segment focus
- SWOT
- 14.18 Wells Fargo and Co.
- Wells Fargo and Co. - Overview
- Wells Fargo and Co. - Business segments
- Wells Fargo and Co. - Key offerings
- Wells Fargo and Co. - Segment focus
- SWOT
15 Appendix
- 15.1 Scope of the report
- 15.2 Inclusions and exclusions checklist
- Inclusions checklist
- Exclusions checklist
- 15.3 Currency conversion rates for US$
- Currency conversion rates for US$
- 15.4 Research methodology
- Research methodology
- 15.5 Data procurement
- Information sources
- 15.6 Data validation
- Data validation
- 15.7 Validation techniques employed for market sizing
- Validation techniques employed for market sizing
- 15.8 Data synthesis
- Data synthesis
- 15.9 360 degree market analysis
- 360 degree market analysis
- 15.10 List of abbreviations
- List of abbreviations

