|
|
市場調査レポート
商品コード
1652843
DTC(消費者直接取引)ラボ検査の世界市場(2025年~2029年)Global Direct to Consumer Laboratory Testing Market 2025-2029 |
||||||

|
|||||||
カスタマイズ可能
|
|||||||


| DTC(消費者直接取引)ラボ検査の世界市場(2025年~2029年) |
|
出版日: 2025年01月23日
発行: TechNavio
ページ情報: 英文 196 Pages
納期: 即納可能
|

全表示
- 概要
- 目次
世界のDTC(消費者直接取引)ラボ検査の市場規模は、2024年~2029年に208億4,440万米ドルに達し、予測期間中のCAGRは36.3%で成長すると予測されています。
この調査レポートは、DTC(消費者直接取引)ラボ検査市場の全体分析、市場規模・予測、動向、成長促進要因、課題、約25のベンダーを網羅したベンダー分析などを掲載しています。
当レポートは、現在の市場シナリオ、最新動向と促進要因、市場環境全体に関する最新分析を提供しています。市場は、DTCラボ検査の利便性とアクセシビリティ、可処分所得の増加、高齢者人口の増加が牽引しています。
| 市場範囲 | |
|---|---|
| 基準年 | 2025年 |
| 終了年 | 2029年 |
| 予測期間 | 2025年~2029年 |
| 成長モメンタム | 加速 |
| 前年比2025年 | 33.9% |
| CAGR | 36.3% |
| 増分額 | 208億4,440万米ドル |
本調査では、今後数年間のDTC(消費者直接取引)ラボ検査市場の成長を促進する主な要因の1つとして、インターネット普及率の上昇が市場成長を後押しすることを挙げています。また、検査キットに使用される技術の進歩やヘルスケア産業の堅調な成長は、市場の大きな需要につながります。
目次
第1章 エグゼクティブサマリー
- 市場概要
第2章 Technavioの分析
- 価格感度・ライフサイクル・顧客購入バスケット・採用率・購入基準の分析
- インプットの重要性と差別化の要因
- ディスラプションの要因
- 促進要因と課題の影響
第3章 市場情勢
- 市場エコシステム
- 市場の特徴
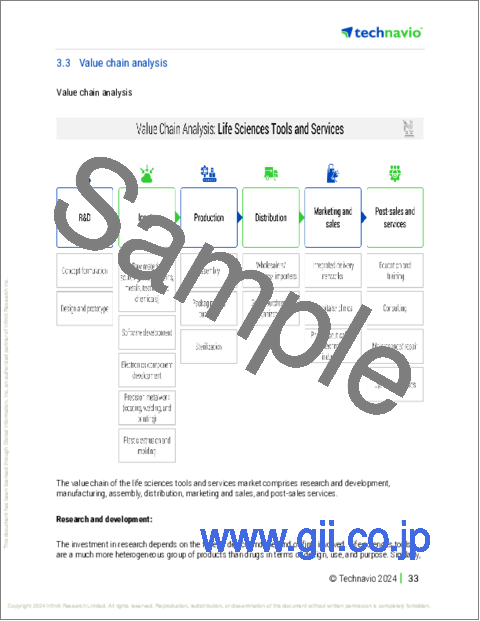
- バリューチェーン分析
第4章 市場規模
- 市場の定義
- 市場セグメント分析
- 市場規模(2024年)
- 市場の見通し(2024年~2029年)
第5章 市場規模実績
- DTC(消費者直接取引)ラボ検査の世界市場(2019年~2023年)
- タイプセグメント分析(2019年~2023年)
- 用途セグメント分析(2019年~2023年)
- 地域セグメント分析(2019年~2023年)
- 国セグメント分析(2019年~2023年)
第6章 定性分析
- AIの影響:DTC(消費者直接取引)ラボ検査の世界市場
第7章 ファイブフォース分析
- ファイブフォースの要約
- 買い手の交渉力
- 供給企業の交渉力
- 新規参入業者の脅威
- 代替品の脅威
- 競争の脅威
- 市況
第8章 市場セグメンテーション:タイプ別
- 市場セグメント
- 比較:タイプ別
- 血液:市場規模と予測(2024年~2029年)
- 尿:市場規模と予測(2024年~2029年)
- 唾液:市場規模と予測(2024年~2029年)
- その他:市場規模と予測(2024年~2029年)
- 市場機会:タイプ別
第9章 市場セグメンテーション:用途別
- 市場セグメント
- 比較:用途別
- 定期ラボ検査:市場規模と予測(2024年~2029年)
- 糖尿病検査:市場規模と予測(2024年~2029年)
- 遺伝子検査:市場規模と予測(2024年~2029年)
- 甲状腺刺激ホルモン検査:市場規模と予測(2024年~2029年)
- その他:市場規模と予測(2024年~2029年)
- 市場機会:用途別
第10章 顧客情勢
- 顧客情勢の概要
第11章 地域別情勢
- 地域別セグメンテーション
- 地域別比較
- 北米:市場規模と予測(2024年~2029年)
- 欧州:市場規模と予測(2024年~2029年)
- アジア:市場規模と予測(2024年~2029年)
- 世界のその他の地域:市場規模と予測(2024年~2029年)
- 米国:市場規模と予測(2024年~2029年)
- 英国:市場規模と予測(2024年~2029年)
- ドイツ:市場規模と予測(2024年~2029年)
- 中国:市場規模と予測(2024年~2029年)
- 日本:市場規模と予測(2024年~2029年)
- カナダ:市場規模と予測(2024年~2029年)
- インド:市場規模と予測(2024年~2029年)
- オーストラリア:市場規模と予測(2024年~2029年)
- フランス:市場規模と予測(2024年~2029年)
- ブラジル:市場規模と予測(2024年~2029年)
- 市場機会:地域情勢別
第12章 促進要因・課題・機会・抑制要因
- 市場促進要因
- 市場の課題
- 促進要因と課題の影響
- 市場の機会・抑制要因
第13章 競合情勢
- 概要
- 競合情勢
- ディスラプションの状況
- 業界のリスク
第14章 競合分析
- 企業プロファイル
- 企業ランキング指数
- 企業の市場ポジショニング
- Any Lab Test Now Inc.
- Color Health Inc.
- Direct Laboratory Services LLC
- EasyDNA
- Everlywell Inc.
- Genesis Healthcare Co.
- Konica Minolta Inc.
- Laboratory Corp. of America Holdings
- MyMedLab Inc.
- Myriad Genetics Inc.
- Quest Diagnostics Inc.
- VERITAS INTERCONTINENTAL
- Walk In Lab LLC.
- WellnessFX
第15章 付録
The direct to consumer laboratory testing market is forecasted to grow by $ 20844.4 mn during 2024-2029, accelerating at a CAGR of 36.3% during the forecast period. The report on the direct to consumer laboratory testing market provides a holistic analysis, market size and forecast, trends, growth drivers, and challenges, as well as vendor analysis covering around 25 vendors.
The report offers an up-to-date analysis regarding the current market scenario, the latest trends and drivers, and the overall market environment. The market is driven by convenience and accessibility of dtc laboratory testing, increased disposable income, and rising geriatric population.
| Market Scope | |
|---|---|
| Base Year | 2025 |
| End Year | 2029 |
| Series Year | 2025-2029 |
| Growth Momentum | Accelerate |
| YOY 2025 | 33.9% |
| CAGR | 36.3% |
| Incremental Value | $20844.4 mn |
Technavio's direct to consumer laboratory testing market is segmented as below:
By Type
- Blood
- Urine
- Saliva
- Others
By Application
- Routine clinical testing
- Diabetes testing
- Genetic testing
- Thyroid stimulating hormone testing
- Others
By Geographical Landscape
- North America
- Europe
- Asia
- Rest of World (ROW)
This study identifies the increased internet penetration fuels market growth as one of the prime reasons driving the direct to consumer laboratory testing market growth during the next few years. Also, advances in technology used in testing kits and robust growth of healthcare industry will lead to sizable demand in the market.
The report on the direct to consumer laboratory testing market covers the following areas:
- Direct To Consumer Laboratory Testing Market sizing
- Direct To Consumer Laboratory Testing Market forecast
- Direct To Consumer Laboratory Testing Market industry analysis
The robust vendor analysis is designed to help clients improve their market position, and in line with this, this report provides a detailed analysis of several leading direct to consumer laboratory testing market vendors that include 23andMe Holding Co., Any Lab Test Now Inc., Color Health Inc., DecodeME Partnership, Direct Laboratory Services LLC, EasyDNA, Everlywell Inc., Genesis Healthcare Co., International Biosciences, Konica Minolta Inc., Laboratory Corp. of America Holdings, LetsGetChecked, MyMedLab Inc., Myriad Genetics Inc., Quest Diagnostics Inc., Sonora Quest Laboratories, Ulta Lab Tests LLC, VERITAS INTERCONTINENTAL, Walk In Lab LLC., and WellnessFX. Also, the direct to consumer laboratory testing market analysis report includes information on upcoming trends and challenges that will influence market growth. This is to help companies strategize and leverage all forthcoming growth opportunities.
The study was conducted using an objective combination of primary and secondary information including inputs from key participants in the industry. The report contains a comprehensive market and vendor landscape in addition to an analysis of the key vendors.
The publisher presents a detailed picture of the market by the way of study, synthesis, and summation of data from multiple sources by an analysis of key parameters such as profit, pricing, competition, and promotions. It presents various market facets by identifying the key industry influencers. The data presented is comprehensive, reliable, and a result of extensive primary and secondary research. The market research reports provide a complete competitive landscape and an in-depth vendor selection methodology and analysis using qualitative and quantitative research to forecast accurate market growth.
Table of Contents
1 Executive Summary
- 1.1 Market overview
- Executive Summary - Chart on Market Overview
- Executive Summary - Data Table on Market Overview
- Executive Summary - Chart on Global Market Characteristics
- Executive Summary - Chart on Market By Geographical Landscape
- Executive Summary - Chart on Market Segmentation by Type
- Executive Summary - Chart on Market Segmentation by Application
- Executive Summary - Chart on Incremental Growth
- Executive Summary - Data Table on Incremental Growth
- Executive Summary - Chart on Company Market Positioning
2 Technavio Analysis
- 2.1 Analysis of price sensitivity, lifecycle, customer purchase basket, adoption rates, and purchase criteria
- Analysis of price sensitivity, lifecycle, customer purchase basket, adoption rates, and purchase criteria
- 2.2 Criticality of inputs and Factors of differentiation
- Overview on criticality of inputs and factors of differentiation
- 2.3 Factors of disruption
- Overview on factors of disruption
- 2.4 Impact of drivers and challenges
- Impact of drivers and challenges in 2024 and 2029
3 Market Landscape
- 3.1 Market ecosystem
- Parent Market
- Data Table on - Parent Market
- 3.2 Market characteristics
- Market characteristics analysis
- 3.3 Value chain analysis
- Value chain analysis
4 Market Sizing
- 4.1 Market definition
- Offerings of companies included in the market definition
- 4.2 Market segment analysis
- Market segments
- 4.3 Market size 2024
- 4.4 Market outlook: Forecast for 2024-2029
- Chart on Global - Market size and forecast 2024-2029 ($ million)
- Data Table on Global - Market size and forecast 2024-2029 ($ million)
- Chart on Global Market: Year-over-year growth 2024-2029 (%)
- Data Table on Global Market: Year-over-year growth 2024-2029 (%)
5 Historic Market Size
- 5.1 Global Direct To Consumer Laboratory Testing Market 2019 - 2023
- Historic Market Size - Data Table on Global Direct To Consumer Laboratory Testing Market 2019 - 2023 ($ million)
- 5.2 Type segment analysis 2019 - 2023
- Historic Market Size - Type Segment 2019 - 2023 ($ million)
- 5.3 Application segment analysis 2019 - 2023
- Historic Market Size - Application Segment 2019 - 2023 ($ million)
- 5.4 Geography segment analysis 2019 - 2023
- Historic Market Size - Geography Segment 2019 - 2023 ($ million)
- 5.5 Country segment analysis 2019 - 2023
- Historic Market Size - Country Segment 2019 - 2023 ($ million)
6 Qualitative Analysis
- 6.1 Impact of AI on the Global Direct to Consumer Laboratory Testing Market
7 Five Forces Analysis
- 7.1 Five forces summary
- Five forces analysis - Comparison between 2024 and 2029
- 7.2 Bargaining power of buyers
- Bargaining power of buyers - Impact of key factors 2024 and 2029
- 7.3 Bargaining power of suppliers
- Bargaining power of suppliers - Impact of key factors in 2024 and 2029
- 7.4 Threat of new entrants
- Threat of new entrants - Impact of key factors in 2024 and 2029
- 7.5 Threat of substitutes
- Threat of substitutes - Impact of key factors in 2024 and 2029
- 7.6 Threat of rivalry
- Threat of rivalry - Impact of key factors in 2024 and 2029
- 7.7 Market condition
- Chart on Market condition - Five forces 2024 and 2029
8 Market Segmentation by Type
- 8.1 Market segments
- Chart on Type - Market share 2024-2029 (%)
- Data Table on Type - Market share 2024-2029 (%)
- 8.2 Comparison by Type
- Chart on Comparison by Type
- Data Table on Comparison by Type
- 8.3 Blood - Market size and forecast 2024-2029
- Chart on Blood - Market size and forecast 2024-2029 ($ million)
- Data Table on Blood - Market size and forecast 2024-2029 ($ million)
- Chart on Blood - Year-over-year growth 2024-2029 (%)
- Data Table on Blood - Year-over-year growth 2024-2029 (%)
- 8.4 Urine - Market size and forecast 2024-2029
- Chart on Urine - Market size and forecast 2024-2029 ($ million)
- Data Table on Urine - Market size and forecast 2024-2029 ($ million)
- Chart on Urine - Year-over-year growth 2024-2029 (%)
- Data Table on Urine - Year-over-year growth 2024-2029 (%)
- 8.5 Saliva - Market size and forecast 2024-2029
- Chart on Saliva - Market size and forecast 2024-2029 ($ million)
- Data Table on Saliva - Market size and forecast 2024-2029 ($ million)
- Chart on Saliva - Year-over-year growth 2024-2029 (%)
- Data Table on Saliva - Year-over-year growth 2024-2029 (%)
- 8.6 Others - Market size and forecast 2024-2029
- Chart on Others - Market size and forecast 2024-2029 ($ million)
- Data Table on Others - Market size and forecast 2024-2029 ($ million)
- Chart on Others - Year-over-year growth 2024-2029 (%)
- Data Table on Others - Year-over-year growth 2024-2029 (%)
- 8.7 Market opportunity by Type
- Market opportunity by Type ($ million)
- Data Table on Market opportunity by Type ($ million)
9 Market Segmentation by Application
- 9.1 Market segments
- Chart on Application - Market share 2024-2029 (%)
- Data Table on Application - Market share 2024-2029 (%)
- 9.2 Comparison by Application
- Chart on Comparison by Application
- Data Table on Comparison by Application
- 9.3 Routine clinical testing - Market size and forecast 2024-2029
- Chart on Routine clinical testing - Market size and forecast 2024-2029 ($ million)
- Data Table on Routine clinical testing - Market size and forecast 2024-2029 ($ million)
- Chart on Routine clinical testing - Year-over-year growth 2024-2029 (%)
- Data Table on Routine clinical testing - Year-over-year growth 2024-2029 (%)
- 9.4 Diabetes testing - Market size and forecast 2024-2029
- Chart on Diabetes testing - Market size and forecast 2024-2029 ($ million)
- Data Table on Diabetes testing - Market size and forecast 2024-2029 ($ million)
- Chart on Diabetes testing - Year-over-year growth 2024-2029 (%)
- Data Table on Diabetes testing - Year-over-year growth 2024-2029 (%)
- 9.5 Genetic testing - Market size and forecast 2024-2029
- Chart on Genetic testing - Market size and forecast 2024-2029 ($ million)
- Data Table on Genetic testing - Market size and forecast 2024-2029 ($ million)
- Chart on Genetic testing - Year-over-year growth 2024-2029 (%)
- Data Table on Genetic testing - Year-over-year growth 2024-2029 (%)
- 9.6 Thyroid stimulating hormone testing - Market size and forecast 2024-2029
- Chart on Thyroid stimulating hormone testing - Market size and forecast 2024-2029 ($ million)
- Data Table on Thyroid stimulating hormone testing - Market size and forecast 2024-2029 ($ million)
- Chart on Thyroid stimulating hormone testing - Year-over-year growth 2024-2029 (%)
- Data Table on Thyroid stimulating hormone testing - Year-over-year growth 2024-2029 (%)
- 9.7 Others - Market size and forecast 2024-2029
- Chart on Others - Market size and forecast 2024-2029 ($ million)
- Data Table on Others - Market size and forecast 2024-2029 ($ million)
- Chart on Others - Year-over-year growth 2024-2029 (%)
- Data Table on Others - Year-over-year growth 2024-2029 (%)
- 9.8 Market opportunity by Application
- Market opportunity by Application ($ million)
- Data Table on Market opportunity by Application ($ million)
10 Customer Landscape
- 10.1 Customer landscape overview
- Analysis of price sensitivity, lifecycle, customer purchase basket, adoption rates, and purchase criteria
11 Geographic Landscape
- 11.1 Geographic segmentation
- Chart on Market share By Geographical Landscape 2024-2029 (%)
- Data Table on Market share By Geographical Landscape 2024-2029 (%)
- 11.2 Geographic comparison
- Chart on Geographic comparison
- Data Table on Geographic comparison
- 11.3 North America - Market size and forecast 2024-2029
- Chart on North America - Market size and forecast 2024-2029 ($ million)
- Data Table on North America - Market size and forecast 2024-2029 ($ million)
- Chart on North America - Year-over-year growth 2024-2029 (%)
- Data Table on North America - Year-over-year growth 2024-2029 (%)
- 11.4 Europe - Market size and forecast 2024-2029
- Chart on Europe - Market size and forecast 2024-2029 ($ million)
- Data Table on Europe - Market size and forecast 2024-2029 ($ million)
- Chart on Europe - Year-over-year growth 2024-2029 (%)
- Data Table on Europe - Year-over-year growth 2024-2029 (%)
- 11.5 Asia - Market size and forecast 2024-2029
- Chart on Asia - Market size and forecast 2024-2029 ($ million)
- Data Table on Asia - Market size and forecast 2024-2029 ($ million)
- Chart on Asia - Year-over-year growth 2024-2029 (%)
- Data Table on Asia - Year-over-year growth 2024-2029 (%)
- 11.6 Rest of World (ROW) - Market size and forecast 2024-2029
- Chart on Rest of World (ROW) - Market size and forecast 2024-2029 ($ million)
- Data Table on Rest of World (ROW) - Market size and forecast 2024-2029 ($ million)
- Chart on Rest of World (ROW) - Year-over-year growth 2024-2029 (%)
- Data Table on Rest of World (ROW) - Year-over-year growth 2024-2029 (%)
- 11.7 US - Market size and forecast 2024-2029
- Chart on US - Market size and forecast 2024-2029 ($ million)
- Data Table on US - Market size and forecast 2024-2029 ($ million)
- Chart on US - Year-over-year growth 2024-2029 (%)
- Data Table on US - Year-over-year growth 2024-2029 (%)
- 11.8 UK - Market size and forecast 2024-2029
- Chart on UK - Market size and forecast 2024-2029 ($ million)
- Data Table on UK - Market size and forecast 2024-2029 ($ million)
- Chart on UK - Year-over-year growth 2024-2029 (%)
- Data Table on UK - Year-over-year growth 2024-2029 (%)
- 11.9 Germany - Market size and forecast 2024-2029
- Chart on Germany - Market size and forecast 2024-2029 ($ million)
- Data Table on Germany - Market size and forecast 2024-2029 ($ million)
- Chart on Germany - Year-over-year growth 2024-2029 (%)
- Data Table on Germany - Year-over-year growth 2024-2029 (%)
- 11.10 China - Market size and forecast 2024-2029
- Chart on China - Market size and forecast 2024-2029 ($ million)
- Data Table on China - Market size and forecast 2024-2029 ($ million)
- Chart on China - Year-over-year growth 2024-2029 (%)
- Data Table on China - Year-over-year growth 2024-2029 (%)
- 11.11 Japan - Market size and forecast 2024-2029
- Chart on Japan - Market size and forecast 2024-2029 ($ million)
- Data Table on Japan - Market size and forecast 2024-2029 ($ million)
- Chart on Japan - Year-over-year growth 2024-2029 (%)
- Data Table on Japan - Year-over-year growth 2024-2029 (%)
- 11.12 Canada - Market size and forecast 2024-2029
- Chart on Canada - Market size and forecast 2024-2029 ($ million)
- Data Table on Canada - Market size and forecast 2024-2029 ($ million)
- Chart on Canada - Year-over-year growth 2024-2029 (%)
- Data Table on Canada - Year-over-year growth 2024-2029 (%)
- 11.13 India - Market size and forecast 2024-2029
- Chart on India - Market size and forecast 2024-2029 ($ million)
- Data Table on India - Market size and forecast 2024-2029 ($ million)
- Chart on India - Year-over-year growth 2024-2029 (%)
- Data Table on India - Year-over-year growth 2024-2029 (%)
- 11.14 Australia - Market size and forecast 2024-2029
- Chart on Australia - Market size and forecast 2024-2029 ($ million)
- Data Table on Australia - Market size and forecast 2024-2029 ($ million)
- Chart on Australia - Year-over-year growth 2024-2029 (%)
- Data Table on Australia - Year-over-year growth 2024-2029 (%)
- 11.15 France - Market size and forecast 2024-2029
- Chart on France - Market size and forecast 2024-2029 ($ million)
- Data Table on France - Market size and forecast 2024-2029 ($ million)
- Chart on France - Year-over-year growth 2024-2029 (%)
- Data Table on France - Year-over-year growth 2024-2029 (%)
- 11.16 Brazil - Market size and forecast 2024-2029
- Chart on Brazil - Market size and forecast 2024-2029 ($ million)
- Data Table on Brazil - Market size and forecast 2024-2029 ($ million)
- Chart on Brazil - Year-over-year growth 2024-2029 (%)
- Data Table on Brazil - Year-over-year growth 2024-2029 (%)
- 11.17 Market opportunity By Geographical Landscape
- Market opportunity By Geographical Landscape ($ million)
- Data Tables on Market opportunity By Geographical Landscape ($ million)
12 Drivers, Challenges, and Opportunity/Restraints
- 12.1 Market drivers
- 12.2 Market challenges
- 12.3 Impact of drivers and challenges
- Impact of drivers and challenges in 2024 and 2029
- 12.4 Market opportunities/restraints
13 Competitive Landscape
- 13.1 Overview
- 13.2 Competitive Landscape
- Overview on criticality of inputs and factors of differentiation
- 13.3 Landscape disruption
- Overview on factors of disruption
- 13.4 Industry risks
- Impact of key risks on business
14 Competitive Analysis
- 14.1 Companies profiled
- Companies covered
- 14.2 Company ranking index
- Company ranking index
- 14.3 Market positioning of companies
- Matrix on companies position and classification
- 23andMe Holding Co.
- 23andMe Holding Co. - Overview
- 23andMe Holding Co. - Business segments
- 23andMe Holding Co. - Key offerings
- 23andMe Holding Co. - Segment focus
- SWOT
- 14.5 Any Lab Test Now Inc.
- Any Lab Test Now Inc. - Overview
- Any Lab Test Now Inc. - Product / Service
- Any Lab Test Now Inc. - Key offerings
- SWOT
- 14.6 Color Health Inc.
- Color Health Inc. - Overview
- Color Health Inc. - Product / Service
- Color Health Inc. - Key offerings
- SWOT
- 14.7 Direct Laboratory Services LLC
- Direct Laboratory Services LLC - Overview
- Direct Laboratory Services LLC - Product / Service
- Direct Laboratory Services LLC - Key offerings
- SWOT
- 14.8 EasyDNA
- EasyDNA - Overview
- EasyDNA - Product / Service
- EasyDNA - Key offerings
- SWOT
- 14.9 Everlywell Inc.
- Everlywell Inc. - Overview
- Everlywell Inc. - Product / Service
- Everlywell Inc. - Key offerings
- SWOT
- 14.10 Genesis Healthcare Co.
- Genesis Healthcare Co. - Overview
- Genesis Healthcare Co. - Product / Service
- Genesis Healthcare Co. - Key offerings
- SWOT
- 14.11 Konica Minolta Inc.
- Konica Minolta Inc. - Overview
- Konica Minolta Inc. - Business segments
- Konica Minolta Inc. - Key news
- Konica Minolta Inc. - Key offerings
- Konica Minolta Inc. - Segment focus
- SWOT
- 14.12 Laboratory Corp. of America Holdings
- Laboratory Corp. of America Holdings - Overview
- Laboratory Corp. of America Holdings - Business segments
- Laboratory Corp. of America Holdings - Key news
- Laboratory Corp. of America Holdings - Key offerings
- Laboratory Corp. of America Holdings - Segment focus
- SWOT
- 14.13 MyMedLab Inc.
- MyMedLab Inc. - Overview
- MyMedLab Inc. - Product / Service
- MyMedLab Inc. - Key offerings
- SWOT
- 14.14 Myriad Genetics Inc.
- Myriad Genetics Inc. - Overview
- Myriad Genetics Inc. - Product / Service
- Myriad Genetics Inc. - Key news
- Myriad Genetics Inc. - Key offerings
- SWOT
- 14.15 Quest Diagnostics Inc.
- Quest Diagnostics Inc. - Overview
- Quest Diagnostics Inc. - Business segments
- Quest Diagnostics Inc. - Key offerings
- Quest Diagnostics Inc. - Segment focus
- SWOT
- 14.16 VERITAS INTERCONTINENTAL
- VERITAS INTERCONTINENTAL - Overview
- VERITAS INTERCONTINENTAL - Product / Service
- VERITAS INTERCONTINENTAL - Key offerings
- SWOT
- 14.17 Walk In Lab LLC.
- Walk In Lab LLC. - Overview
- Walk In Lab LLC. - Product / Service
- Walk In Lab LLC. - Key offerings
- SWOT
- 14.18 WellnessFX
- WellnessFX - Overview
- WellnessFX - Product / Service
- WellnessFX - Key offerings
- SWOT
15 Appendix
- 15.1 Scope of the report
- 15.2 Inclusions and exclusions checklist
- Inclusions checklist
- Exclusions checklist
- 15.3 Currency conversion rates for US$
- Currency conversion rates for US$
- 15.4 Research methodology
- Research methodology
- 15.5 Data procurement
- Information sources
- 15.6 Data validation
- Data validation
- 15.7 Validation techniques employed for market sizing
- Validation techniques employed for market sizing
- 15.8 Data synthesis
- Data synthesis
- 15.9 360 degree market analysis
- 360 degree market analysis
- 15.10 List of abbreviations
- List of abbreviations

