|
|
市場調査レポート
商品コード
1975615
ゲームにおける人工知能(AI)の世界市場 2026年~2030年Global Artificial Intelligence (AI) In Games Market 2026-2030 |
||||||
|
|||||||
カスタマイズ可能
|
|||||||

| ゲームにおける人工知能(AI)の世界市場 2026年~2030年 |
|
出版日: 2026年03月09日
発行: TechNavio
ページ情報: 英文 304 Pages
納期: 即納可能
|

概要
世界のゲームにおける人工知能(AI)場は、2025年から2030年にかけて341億430万米ドルの成長が見込まれており、予測期間中のCAGRは40.7%と予測されております。
本報告書は、世界のゲームにおける人工知能(AI)場に関する包括的な分析を提供し、市場規模と予測、動向、成長要因、課題に加え、約25社のベンダー分析を網羅しております。
本レポートは、現在の市場状況、最新の動向と促進要因、市場環境全般に関する最新の分析を提供します。市場は、AI生成サウンドスケープと動的音楽制作の産業化、知能型NPCと動的・主体的な物語システムの進化、AI駆動型品質保証と自動化されたライブ運営の産業化によって牽引されています。
本調査は、業界の主要関係者からの情報を含む、一次情報と二次情報の客観的な組み合わせを用いて実施されました。本レポートには、主要企業の分析に加え、包括的な市場規模データ、地域別分析を伴うセグメント、ベンダー情勢が含まれています。レポートには過去データと予測データが掲載されています。
| 市場範囲 | |
|---|---|
| 基準年 | 2026年 |
| 終了年 | 2030年 |
| 予測期間 | 2026-2030 |
| 成長モメンタム | 加速 |
| 前年比2026年 | 35% |
| CAGR | 40.7% |
| 増分額 | 341億430万米ドル |
本調査では、AI駆動型プロシージャルコンテンツ生成と自動化されたワールドビルディングの統合が、今後数年間における世界のゲームにおける人工知能(AI)場成長を牽引する主要要因の一つであると特定しております。また、AIを活用したプレイヤー分析および行動ベースの不正防止システムの拡大、ならびに低遅延インタラクションのためのエッジAIおよびハイブリッドクラウドアーキテクチャの成長が、市場における相当な需要を生み出すものと見込まれます。
目次
第1章 エグゼクティブサマリー
第2章 Technavio分析
- 価格・ライフサイクル・顧客購入バスケット・採用率・購入基準の分析
- インプットの重要性と差別化の要因
- 混乱の要因
- 促進要因と課題の影響
第3章 市場情勢
- 市場エコシステム
- 市場の特徴
- バリューチェーン分析
第4章 市場規模
- 市場の定義
- 市場セグメント分析
- 市場規模、2025年
- 市場の見通し、2025年~2030年
第5章 市場規模実績
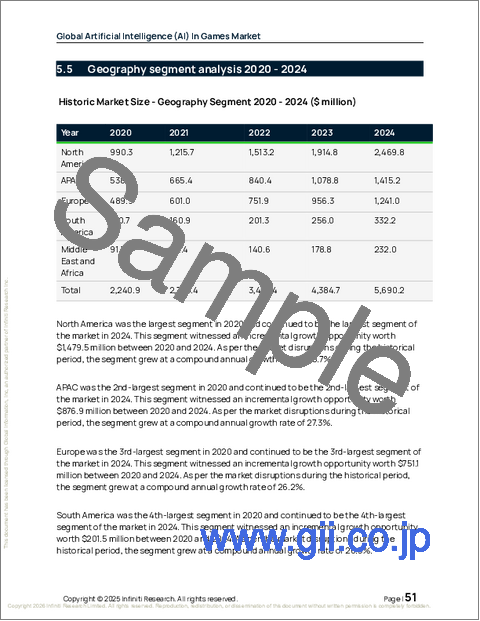
- ゲームにおける人工知能(AI)の世界市場、2020年~2024年
- タイプセグメント分析、2020年~2024年
- 技術セグメント分析、2020年~2024年
- ジャンル別セグメント分析、2020年~2024年
- 地域別セグメント分析、2020年~2024年
- 国別セグメント分析、2020年~2024年
第6章 ファイブフォース分析
- ファイブフォースの要約
- 買い手の交渉力
- 供給企業の交渉力
- 新規参入業者の脅威
- 代替品の脅威
- 競争の脅威
- 市況
第7章 市場セグメンテーション:タイプ別
- 比較:タイプ別
- AI搭載プラットフォーム
- AI対応ゲーム
- 市場機会:タイプ別
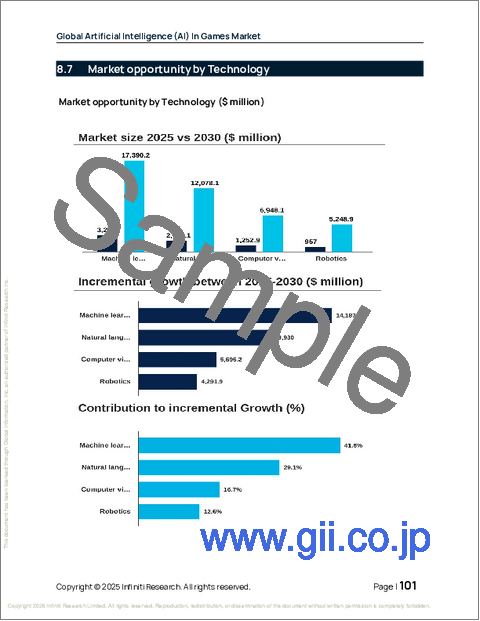
第8章 市場セグメンテーション:技術別
- 比較:技術別
- 機械学習
- 自然言語処理
- コンピュータビジョン
- ロボティクス
- 市場機会:技術別
第9章 市場セグメンテーション:ジャンル別
- 比較:ジャンル別
- アクション・アドベンチャー
- ロールプレイングゲーム
- ファーストパーソン・シューティングゲーム
- シミュレーション・ストラテジー
- その他
- 市場機会:ジャンル別
第10章 顧客情勢
第11章 地域別情勢
- 地域別セグメンテーション
- 地域別比較
- 北米
- 米国
- カナダ
- メキシコ
- アジア太平洋
- 中国
- 日本
- 韓国
- インド
- オーストラリア
- インドネシア
- 欧州
- ドイツ
- 英国
- フランス
- イタリア
- スペイン
- オランダ
- 南米
- ブラジル
- コロンビア
- チリ
- 中東・アフリカ
- アラブ首長国連邦
- サウジアラビア
- 南アフリカ
- エジプト
- トルコ
- 市場機会:地域別
第12章 促進要因・課題・機会
- 市場促進要因
- 市場の課題
- 促進要因と課題の影響
- 市場機会
第13章 競合情勢
- 概要
- 競合情勢
- 混乱の状況
- 業界のリスク
第14章 競合分析
- 企業プロファイル
- 企業ランキング指標
- 企業の市場ポジショニング
- Amazon.com Inc.
- Charisma Entertainment Ltd.
- Didimo
- Eleven Labs Inc.
- Epic Games Inc.
- Google LLC
- IBM Corp.
- Inworld AI
- Keywords Studios Plc
- Leonardo Interactive Pty Ltd
- Microsoft Corp.
- NVIDIA Corp.
- Sony Group Corp.
- Tencent Holdings Ltd.
- Ubisoft Entertainment SA
