|
|
市場調査レポート
商品コード
1645469
自動車アフターマーケットの世界市場、2025-2029年Global Automotive Aftermarket Market 2025-2029 |
||||||

|
|||||||
カスタマイズ可能
|
|||||||

| 自動車アフターマーケットの世界市場、2025-2029年 |
|
出版日: 2025年01月14日
発行: TechNavio
ページ情報: 英文 201 Pages
納期: 即納可能
|

全表示
- 概要
- 図表
- 目次
自動車アフターマーケット市場は2024-2029年に1,797億米ドル、予測期間中のCAGRは6%で成長すると予測されます。
当レポートでは、自動車アフターマーケット市場の全体的な分析、市場規模・予測、動向、成長促進要因、課題、約25のベンダーを網羅したベンダー分析などを掲載しています。
現在の市場シナリオ、最新動向と促進要因、市場環境全体に関する最新分析を提供しています。自動車部品の高い普及率、自動車製品のオンライン購入の利便性、自動車のカスタマイズ需要の高まりが市場を牽引しています。
| 市場範囲 | |
|---|---|
| 基準年 | 2025 |
| 終了年 | 2029 |
| 予測期間 | 2025-2029 |
| 成長モメンタム | 加速 |
| 前年比2025年 | 5.7% |
| CAGR | 6% |
| 増分額 | 1,797億米ドル |
本調査では、今後数年間の自動車アフターマーケット市場の成長を促進する主な要因の1つとして、自動車アフターマーケットにおけるアフターマーケットe-retailingの普及を挙げています。また、アフターマーケットeリテーリングに革命をもたらす高度な分析ツールの使用や、自動車部品のオンライン販売を促進するeコマース市場の活況も、市場の大きな需要につながると思われます。
目次
第1章 エグゼクティブサマリー
- 市場概要
第2章 Technavio分析
- 価格・ライフサイクル・顧客購入バスケット・採用率・購入基準の分析
- インプットの重要性と差別化の要因
- 混乱の要因
- 促進要因と課題の影響
第3章 市場情勢
- 市場エコシステム
- 市場の特徴
- バリューチェーン分析
第4章 市場規模
- 市場の定義
- 市場セグメント分析
- 市場規模 2024
- 市場の見通し 2024-2029
第5章 市場規模実績
- 自動車アフターマーケットの世界市場 2019-2023
- 車両タイプセグメント分析 2019-2023
- 流通チャネルセグメント分析 2019-2023
- 地域別セグメント分析 2019-2023
- 国別セグメント分析 2019-2023
第6章 定性分析
- AIの影響:自動車アフターマーケットの世界市場
第7章 ファイブフォース分析
- ファイブフォースの要約
- 買い手の交渉力
- 供給企業の交渉力
- 新規参入業者の脅威
- 代替品の脅威
- 競争の脅威
- 市況
第8章 市場セグメンテーション:車両タイプ別
- 市場セグメント
- 比較:車両タイプ別
- 乗用車:市場規模と予測 2024-2029
- 商用車:市場規模と予測 2024-2029
- 市場機会:車両タイプ別
第9章 市場セグメンテーション:流通チャネル別
- 市場セグメント
- 比較:流通チャネル別
- 小売業者:市場規模と予測 2024-2029
- 卸売および流通:市場規模と予測 2024-2029
- 市場機会:流通チャネル別
第10章 顧客情勢
- 顧客情勢の概要
第11章 地域別情勢
- 地域別セグメンテーション
- 地域別比較
- アジア太平洋:市場規模と予測 2024-2029
- 欧州:市場規模と予測 2024-2029
- 北米:市場規模と予測 2024-2029
- 南米:市場規模と予測 2024-2029
- 中東・アフリカ:市場規模と予測 2024-2029
- 中国:市場規模と予測 2024-2029
- 米国:市場規模と予測 2024-2029
- 日本:市場規模と予測 2024-2029
- インド:市場規模と予測 2024-2029
- ドイツ:市場規模と予測 2024-2029
- 英国:市場規模と予測 2024-2029
- フランス:市場規模と予測 2024-2029
- 韓国:市場規模と予測 2024-2029
- ブラジル:市場規模と予測 2024-2029
- イタリア:市場規模と予測 2024-2029
- 市場機会:地域情勢別
第12章 促進要因・課題・機会・抑制要因
- 市場促進要因
- 市場の課題
- 促進要因と課題の影響
- 市場の機会・抑制要因
第13章 競合情勢
- 概要
- 競合情勢
- 混乱の状況
- 業界のリスク
第14章 競合分析
- 企業プロファイル
- 企業ランキング指数
- 企業の市場ポジショニング
- AISIN CORP.
- Akebono Brake Corp.
- ALCO Filters Ltd.
- BASF SE
- BorgWarner Inc.
- Bridgestone Corp.
- Continental AG
- DENSO Corp.
- Faurecia SE
- HELLA GmbH and Co. KGaA
- JK Tyre and Industries Ltd.
- LCI Industries
- MAP MotoRad Automotive Parts Ltd.
- Niterra Co. Ltd.
第15章 付録
Exhibits:
- Exhibits1: Executive Summary - Chart on Market Overview
- Exhibits2: Executive Summary - Data Table on Market Overview
- Exhibits3: Executive Summary - Chart on Global Market Characteristics
- Exhibits4: Executive Summary - Chart on Market By Geographical Landscape
- Exhibits5: Executive Summary - Chart on Market Segmentation by Vehicle Type
- Exhibits6: Executive Summary - Chart on Market Segmentation by Distribution Channel
- Exhibits7: Executive Summary - Chart on Incremental Growth
- Exhibits8: Executive Summary - Data Table on Incremental Growth
- Exhibits9: Executive Summary - Chart on Company Market Positioning
- Exhibits10: Analysis of price sensitivity, lifecycle, customer purchase basket, adoption rates, and purchase criteria
- Exhibits11: Overview on criticality of inputs and factors of differentiation
- Exhibits12: Overview on factors of disruption
- Exhibits13: Impact of drivers and challenges in 2024 and 2029
- Exhibits14: Parent Market
- Exhibits15: Data Table on - Parent Market
- Exhibits16: Market characteristics analysis
- Exhibits17: Value chain analysis
- Exhibits18: Offerings of companies included in the market definition
- Exhibits19: Market segments
- Exhibits20: Chart on Global - Market size and forecast 2024-2029 ($ billion)
- Exhibits21: Data Table on Global - Market size and forecast 2024-2029 ($ billion)
- Exhibits22: Chart on Global Market: Year-over-year growth 2024-2029 (%)
- Exhibits23: Data Table on Global Market: Year-over-year growth 2024-2029 (%)
- Exhibits24: Historic Market Size - Data Table on Global Automotive Aftermarket Market 2019 - 2023 ($ billion)
- Exhibits25: Historic Market Size - Vehicle Type Segment 2019 - 2023 ($ billion)
- Exhibits26: Historic Market Size - Distribution Channel Segment 2019 - 2023 ($ billion)
- Exhibits27: Historic Market Size - Geography Segment 2019 - 2023 ($ billion)
- Exhibits28: Historic Market Size - Country Segment 2019 - 2023 ($ billion)
- Exhibits29: Five forces analysis - Comparison between 2024 and 2029
- Exhibits30: Bargaining power of buyers - Impact of key factors 2024 and 2029
- Exhibits31: Bargaining power of suppliers - Impact of key factors in 2024 and 2029
- Exhibits32: Threat of new entrants - Impact of key factors in 2024 and 2029
- Exhibits33: Threat of substitutes - Impact of key factors in 2024 and 2029
- Exhibits34: Threat of rivalry - Impact of key factors in 2024 and 2029
- Exhibits35: Chart on Market condition - Five forces 2024 and 2029
- Exhibits36: Chart on Vehicle Type - Market share 2024-2029 (%)
- Exhibits37: Data Table on Vehicle Type - Market share 2024-2029 (%)
- Exhibits38: Chart on Comparison by Vehicle Type
- Exhibits39: Data Table on Comparison by Vehicle Type
- Exhibits40: Chart on Passenger cars - Market size and forecast 2024-2029 ($ billion)
- Exhibits41: Data Table on Passenger cars - Market size and forecast 2024-2029 ($ billion)
- Exhibits42: Chart on Passenger cars - Year-over-year growth 2024-2029 (%)
- Exhibits43: Data Table on Passenger cars - Year-over-year growth 2024-2029 (%)
- Exhibits44: Chart on Commercial vehicles - Market size and forecast 2024-2029 ($ billion)
- Exhibits45: Data Table on Commercial vehicles - Market size and forecast 2024-2029 ($ billion)
- Exhibits46: Chart on Commercial vehicles - Year-over-year growth 2024-2029 (%)
- Exhibits47: Data Table on Commercial vehicles - Year-over-year growth 2024-2029 (%)
- Exhibits48: Market opportunity by Vehicle Type ($ billion)
- Exhibits49: Data Table on Market opportunity by Vehicle Type ($ billion)
- Exhibits50: Chart on Distribution Channel - Market share 2024-2029 (%)
- Exhibits51: Data Table on Distribution Channel - Market share 2024-2029 (%)
- Exhibits52: Chart on Comparison by Distribution Channel
- Exhibits53: Data Table on Comparison by Distribution Channel
- Exhibits54: Chart on Retailer - Market size and forecast 2024-2029 ($ billion)
- Exhibits55: Data Table on Retailer - Market size and forecast 2024-2029 ($ billion)
- Exhibits56: Chart on Retailer - Year-over-year growth 2024-2029 (%)
- Exhibits57: Data Table on Retailer - Year-over-year growth 2024-2029 (%)
- Exhibits58: Chart on Wholesale and distribution - Market size and forecast 2024-2029 ($ billion)
- Exhibits59: Data Table on Wholesale and distribution - Market size and forecast 2024-2029 ($ billion)
- Exhibits60: Chart on Wholesale and distribution - Year-over-year growth 2024-2029 (%)
- Exhibits61: Data Table on Wholesale and distribution - Year-over-year growth 2024-2029 (%)
- Exhibits62: Market opportunity by Distribution Channel ($ billion)
- Exhibits63: Data Table on Market opportunity by Distribution Channel ($ billion)
- Exhibits64: Analysis of price sensitivity, lifecycle, customer purchase basket, adoption rates, and purchase criteria
- Exhibits65: Chart on Market share By Geographical Landscape 2024-2029 (%)
- Exhibits66: Data Table on Market share By Geographical Landscape 2024-2029 (%)
- Exhibits67: Chart on Geographic comparison
- Exhibits68: Data Table on Geographic comparison
- Exhibits69: Chart on APAC - Market size and forecast 2024-2029 ($ billion)
- Exhibits70: Data Table on APAC - Market size and forecast 2024-2029 ($ billion)
- Exhibits71: Chart on APAC - Year-over-year growth 2024-2029 (%)
- Exhibits72: Data Table on APAC - Year-over-year growth 2024-2029 (%)
- Exhibits73: Chart on Europe - Market size and forecast 2024-2029 ($ billion)
- Exhibits74: Data Table on Europe - Market size and forecast 2024-2029 ($ billion)
- Exhibits75: Chart on Europe - Year-over-year growth 2024-2029 (%)
- Exhibits76: Data Table on Europe - Year-over-year growth 2024-2029 (%)
- Exhibits77: Chart on North America - Market size and forecast 2024-2029 ($ billion)
- Exhibits78: Data Table on North America - Market size and forecast 2024-2029 ($ billion)
- Exhibits79: Chart on North America - Year-over-year growth 2024-2029 (%)
- Exhibits80: Data Table on North America - Year-over-year growth 2024-2029 (%)
- Exhibits81: Chart on South America - Market size and forecast 2024-2029 ($ billion)
- Exhibits82: Data Table on South America - Market size and forecast 2024-2029 ($ billion)
- Exhibits83: Chart on South America - Year-over-year growth 2024-2029 (%)
- Exhibits84: Data Table on South America - Year-over-year growth 2024-2029 (%)
- Exhibits85: Chart on Middle East and Africa - Market size and forecast 2024-2029 ($ billion)
- Exhibits86: Data Table on Middle East and Africa - Market size and forecast 2024-2029 ($ billion)
- Exhibits87: Chart on Middle East and Africa - Year-over-year growth 2024-2029 (%)
- Exhibits88: Data Table on Middle East and Africa - Year-over-year growth 2024-2029 (%)
- Exhibits89: Chart on China - Market size and forecast 2024-2029 ($ billion)
- Exhibits90: Data Table on China - Market size and forecast 2024-2029 ($ billion)
- Exhibits91: Chart on China - Year-over-year growth 2024-2029 (%)
- Exhibits92: Data Table on China - Year-over-year growth 2024-2029 (%)
- Exhibits93: Chart on US - Market size and forecast 2024-2029 ($ billion)
- Exhibits94: Data Table on US - Market size and forecast 2024-2029 ($ billion)
- Exhibits95: Chart on US - Year-over-year growth 2024-2029 (%)
- Exhibits96: Data Table on US - Year-over-year growth 2024-2029 (%)
- Exhibits97: Chart on Japan - Market size and forecast 2024-2029 ($ billion)
- Exhibits98: Data Table on Japan - Market size and forecast 2024-2029 ($ billion)
- Exhibits99: Chart on Japan - Year-over-year growth 2024-2029 (%)
- Exhibits100: Data Table on Japan - Year-over-year growth 2024-2029 (%)
- Exhibits101: Chart on India - Market size and forecast 2024-2029 ($ billion)
- Exhibits102: Data Table on India - Market size and forecast 2024-2029 ($ billion)
- Exhibits103: Chart on India - Year-over-year growth 2024-2029 (%)
- Exhibits104: Data Table on India - Year-over-year growth 2024-2029 (%)
- Exhibits105: Chart on Germany - Market size and forecast 2024-2029 ($ billion)
- Exhibits106: Data Table on Germany - Market size and forecast 2024-2029 ($ billion)
- Exhibits107: Chart on Germany - Year-over-year growth 2024-2029 (%)
- Exhibits108: Data Table on Germany - Year-over-year growth 2024-2029 (%)
- Exhibits109: Chart on UK - Market size and forecast 2024-2029 ($ billion)
- Exhibits110: Data Table on UK - Market size and forecast 2024-2029 ($ billion)
- Exhibits111: Chart on UK - Year-over-year growth 2024-2029 (%)
- Exhibits112: Data Table on UK - Year-over-year growth 2024-2029 (%)
- Exhibits113: Chart on France - Market size and forecast 2024-2029 ($ billion)
- Exhibits114: Data Table on France - Market size and forecast 2024-2029 ($ billion)
- Exhibits115: Chart on France - Year-over-year growth 2024-2029 (%)
- Exhibits116: Data Table on France - Year-over-year growth 2024-2029 (%)
- Exhibits117: Chart on South Korea - Market size and forecast 2024-2029 ($ billion)
- Exhibits118: Data Table on South Korea - Market size and forecast 2024-2029 ($ billion)
- Exhibits119: Chart on South Korea - Year-over-year growth 2024-2029 (%)
- Exhibits120: Data Table on South Korea - Year-over-year growth 2024-2029 (%)
- Exhibits121: Chart on Brazil - Market size and forecast 2024-2029 ($ billion)
- Exhibits122: Data Table on Brazil - Market size and forecast 2024-2029 ($ billion)
- Exhibits123: Chart on Brazil - Year-over-year growth 2024-2029 (%)
- Exhibits124: Data Table on Brazil - Year-over-year growth 2024-2029 (%)
- Exhibits125: Chart on Italy - Market size and forecast 2024-2029 ($ billion)
- Exhibits126: Data Table on Italy - Market size and forecast 2024-2029 ($ billion)
- Exhibits127: Chart on Italy - Year-over-year growth 2024-2029 (%)
- Exhibits128: Data Table on Italy - Year-over-year growth 2024-2029 (%)
- Exhibits129: Market opportunity By Geographical Landscape ($ billion)
- Exhibits130: Data Tables on Market opportunity By Geographical Landscape ($ billion)
- Exhibits131: Impact of drivers and challenges in 2024 and 2029
- Exhibits132: Overview on criticality of inputs and factors of differentiation
- Exhibits133: Overview on factors of disruption
- Exhibits134: Impact of key risks on business
- Exhibits135: Companies covered
- Exhibits136: Company ranking index
- Exhibits137: Matrix on companies position and classification
- Exhibits138: 3M Co. - Overview
- Exhibits139: 3M Co. - Business segments
- Exhibits140: 3M Co. - Key news
- Exhibits141: 3M Co. - Key offerings
- Exhibits142: 3M Co. - Segment focus
- Exhibits143: SWOT
- Exhibits144: AISIN CORP. - Overview
- Exhibits145: AISIN CORP. - Business segments
- Exhibits146: AISIN CORP. - Key news
- Exhibits147: AISIN CORP. - Key offerings
- Exhibits148: AISIN CORP. - Segment focus
- Exhibits149: SWOT
- Exhibits150: Akebono Brake Corp. - Overview
- Exhibits151: Akebono Brake Corp. - Product / Service
- Exhibits152: Akebono Brake Corp. - Key offerings
- Exhibits153: SWOT
- Exhibits154: ALCO Filters Ltd. - Overview
- Exhibits155: ALCO Filters Ltd. - Product / Service
- Exhibits156: ALCO Filters Ltd. - Key offerings
- Exhibits157: SWOT
- Exhibits158: BASF SE - Overview
- Exhibits159: BASF SE - Business segments
- Exhibits160: BASF SE - Key news
- Exhibits161: BASF SE - Key offerings
- Exhibits162: BASF SE - Segment focus
- Exhibits163: SWOT
- Exhibits164: BorgWarner Inc. - Overview
- Exhibits165: BorgWarner Inc. - Business segments
- Exhibits166: BorgWarner Inc. - Key news
- Exhibits167: BorgWarner Inc. - Key offerings
- Exhibits168: BorgWarner Inc. - Segment focus
- Exhibits169: SWOT
- Exhibits170: Bridgestone Corp. - Overview
- Exhibits171: Bridgestone Corp. - Business segments
- Exhibits172: Bridgestone Corp. - Key news
- Exhibits173: Bridgestone Corp. - Key offerings
- Exhibits174: Bridgestone Corp. - Segment focus
- Exhibits175: SWOT
- Exhibits176: Continental AG - Overview
- Exhibits177: Continental AG - Business segments
- Exhibits178: Continental AG - Key news
- Exhibits179: Continental AG - Key offerings
- Exhibits180: Continental AG - Segment focus
- Exhibits181: SWOT
- Exhibits182: DENSO Corp. - Overview
- Exhibits183: DENSO Corp. - Business segments
- Exhibits184: DENSO Corp. - Key news
- Exhibits185: DENSO Corp. - Key offerings
- Exhibits186: DENSO Corp. - Segment focus
- Exhibits187: SWOT
- Exhibits188: Faurecia SE - Overview
- Exhibits189: Faurecia SE - Product / Service
- Exhibits190: Faurecia SE - Key news
- Exhibits191: Faurecia SE - Key offerings
- Exhibits192: SWOT
- Exhibits193: HELLA GmbH and Co. KGaA - Overview
- Exhibits194: HELLA GmbH and Co. KGaA - Business segments
- Exhibits195: HELLA GmbH and Co. KGaA - Key news
- Exhibits196: HELLA GmbH and Co. KGaA - Key offerings
- Exhibits197: HELLA GmbH and Co. KGaA - Segment focus
- Exhibits198: SWOT
- Exhibits199: JK Tyre and Industries Ltd. - Overview
- Exhibits200: JK Tyre and Industries Ltd. - Business segments
- Exhibits201: JK Tyre and Industries Ltd. - Key offerings
- Exhibits202: JK Tyre and Industries Ltd. - Segment focus
- Exhibits203: SWOT
- Exhibits204: LCI Industries - Overview
- Exhibits205: LCI Industries - Business segments
- Exhibits206: LCI Industries - Key offerings
- Exhibits207: LCI Industries - Segment focus
- Exhibits208: SWOT
- Exhibits209: MAP MotoRad Automotive Parts Ltd. - Overview
- Exhibits210: MAP MotoRad Automotive Parts Ltd. - Product / Service
- Exhibits211: MAP MotoRad Automotive Parts Ltd. - Key offerings
- Exhibits212: SWOT
- Exhibits213: Niterra Co. Ltd. - Overview
- Exhibits214: Niterra Co. Ltd. - Business segments
- Exhibits215: Niterra Co. Ltd. - Key offerings
- Exhibits216: Niterra Co. Ltd. - Segment focus
- Exhibits217: SWOT
- Exhibits218: Inclusions checklist
- Exhibits219: Exclusions checklist
- Exhibits220: Currency conversion rates for US$
- Exhibits221: Research methodology
- Exhibits222: Information sources
- Exhibits223: Data validation
- Exhibits224: Validation techniques employed for market sizing
- Exhibits225: Data synthesis
- Exhibits226: 360 degree market analysis
- Exhibits227: List of abbreviations
The automotive aftermarket market is forecasted to grow by USD 179.7 bn during 2024-2029, accelerating at a CAGR of 6% during the forecast period. The report on the automotive aftermarket market provides a holistic analysis, market size and forecast, trends, growth drivers, and challenges, as well as vendor analysis covering around 25 vendors.
The report offers an up-to-date analysis regarding the current market scenario, the latest trends and drivers, and the overall market environment. The market is driven by high adoption of vehicle parts, convenience of purchasing automotive products online, and growing demand for vehicle customization.
| Market Scope | |
|---|---|
| Base Year | 2025 |
| End Year | 2029 |
| Series Year | 2025-2029 |
| Growth Momentum | Accelerate |
| YOY 2025 | 5.7% |
| CAGR | 6% |
| Incremental Value | $179.7 bn |
Technavio's automotive aftermarket market is segmented as below:
By Vehicle Type
- Passenger cars
- Commercial vehicles
By Distribution Channel
- Retailer
- Wholesale and distribution
By Geographical Landscape
- APAC
- Europe
- North America
- South America
- Middle East and Africa
This study identifies the aftermarket e-retailing gaining popularity in automotive aftermarket as one of the prime reasons driving the automotive aftermarket market growth during the next few years. Also, use of advanced analytical tools to revolutionize aftermarket e-retailing and booming e-commerce market driving online sales of automotive parts will lead to sizable demand in the market.
The report on the automotive aftermarket market covers the following areas:
- Automotive Aftermarket Market sizing
- Automotive Aftermarket Market forecast
- Automotive Aftermarket Market industry analysis
The robust vendor analysis is designed to help clients improve their market position, and in line with this, this report provides a detailed analysis of several leading automotive aftermarket market vendors that include 3M Co., AISIN CORP., Akebono Brake Corp., ALCO Filters Ltd., BASF SE, BorgWarner Inc., Bridgestone Corp., Continental AG, DENSO Corp., Faurecia SE, HELLA GmbH and Co. KGaA, JK Tyre and Industries Ltd., LCI Industries, MAP MotoRad Automotive Parts Ltd., Niterra Co. Ltd., Pioneer Corp., Robert Bosch GmbH, Samsung Electronics Co. Ltd., Tenneco Inc., and The Goodyear Tire and Rubber Co.. Also, the automotive aftermarket market analysis report includes information on upcoming trends and challenges that will influence market growth. This is to help companies strategize and leverage all forthcoming growth opportunities.
The study was conducted using an objective combination of primary and secondary information including inputs from key participants in the industry. The report contains a comprehensive market and vendor landscape in addition to an analysis of the key vendors.
The publisher presents a detailed picture of the market by the way of study, synthesis, and summation of data from multiple sources by an analysis of key parameters such as profit, pricing, competition, and promotions. It presents various market facets by identifying the key industry influencers. The data presented is comprehensive, reliable, and a result of extensive primary and secondary research. The market research reports provide a complete competitive landscape and an in-depth vendor selection methodology and analysis using qualitative and quantitative research to forecast accurate market growth.
Table of Contents
1 Executive Summary
- 1.1 Market overview
- Executive Summary - Chart on Market Overview
- Executive Summary - Data Table on Market Overview
- Executive Summary - Chart on Global Market Characteristics
- Executive Summary - Chart on Market By Geographical Landscape
- Executive Summary - Chart on Market Segmentation by Vehicle Type
- Executive Summary - Chart on Market Segmentation by Distribution Channel
- Executive Summary - Chart on Incremental Growth
- Executive Summary - Data Table on Incremental Growth
- Executive Summary - Chart on Company Market Positioning
2 Technavio Analysis
- 2.1 Analysis of price sensitivity, lifecycle, customer purchase basket, adoption rates, and purchase criteria
- Analysis of price sensitivity, lifecycle, customer purchase basket, adoption rates, and purchase criteria
- 2.2 Criticality of inputs and Factors of differentiation
- Overview on criticality of inputs and factors of differentiation
- 2.3 Factors of disruption
- Overview on factors of disruption
- 2.4 Impact of drivers and challenges
- Impact of drivers and challenges in 2024 and 2029
3 Market Landscape
- 3.1 Market ecosystem
- Parent Market
- Data Table on - Parent Market
- 3.2 Market characteristics
- Market characteristics analysis
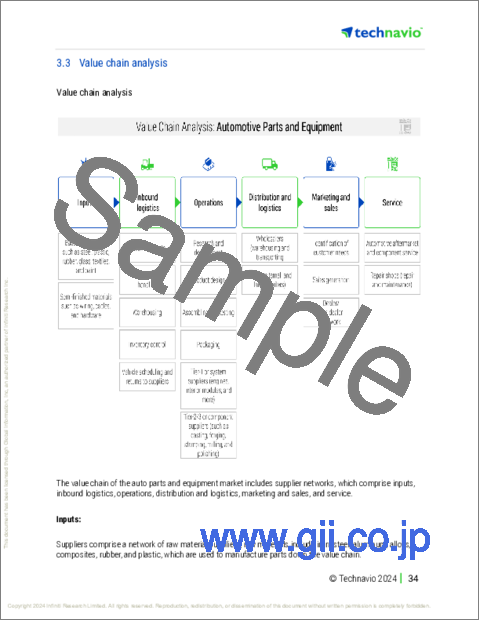
- 3.3 Value chain analysis
- Value chain analysis
4 Market Sizing
- 4.1 Market definition
- Offerings of companies included in the market definition
- 4.2 Market segment analysis
- Market segments
- 4.3 Market size 2024
- 4.4 Market outlook: Forecast for 2024-2029
- Chart on Global - Market size and forecast 2024-2029 ($ billion)
- Data Table on Global - Market size and forecast 2024-2029 ($ billion)
- Chart on Global Market: Year-over-year growth 2024-2029 (%)
- Data Table on Global Market: Year-over-year growth 2024-2029 (%)
5 Historic Market Size
- 5.1 Global Automotive Aftermarket Market 2019 - 2023
- Historic Market Size - Data Table on Global Automotive Aftermarket Market 2019 - 2023 ($ billion)
- 5.2 Vehicle Type segment analysis 2019 - 2023
- Historic Market Size - Vehicle Type Segment 2019 - 2023 ($ billion)
- 5.3 Distribution Channel segment analysis 2019 - 2023
- Historic Market Size - Distribution Channel Segment 2019 - 2023 ($ billion)
- 5.4 Geography segment analysis 2019 - 2023
- Historic Market Size - Geography Segment 2019 - 2023 ($ billion)
- 5.5 Country segment analysis 2019 - 2023
- Historic Market Size - Country Segment 2019 - 2023 ($ billion)
6 Qualitative Analysis
- 6.1 Impact of AI in the global automotive aftermarket market
7 Five Forces Analysis
- 7.1 Five forces summary
- Five forces analysis - Comparison between 2024 and 2029
- 7.2 Bargaining power of buyers
- Bargaining power of buyers - Impact of key factors 2024 and 2029
- 7.3 Bargaining power of suppliers
- Bargaining power of suppliers - Impact of key factors in 2024 and 2029
- 7.4 Threat of new entrants
- Threat of new entrants - Impact of key factors in 2024 and 2029
- 7.5 Threat of substitutes
- Threat of substitutes - Impact of key factors in 2024 and 2029
- 7.6 Threat of rivalry
- Threat of rivalry - Impact of key factors in 2024 and 2029
- 7.7 Market condition
- Chart on Market condition - Five forces 2024 and 2029
8 Market Segmentation by Vehicle Type
- 8.1 Market segments
- Chart on Vehicle Type - Market share 2024-2029 (%)
- Data Table on Vehicle Type - Market share 2024-2029 (%)
- 8.2 Comparison by Vehicle Type
- Chart on Comparison by Vehicle Type
- Data Table on Comparison by Vehicle Type
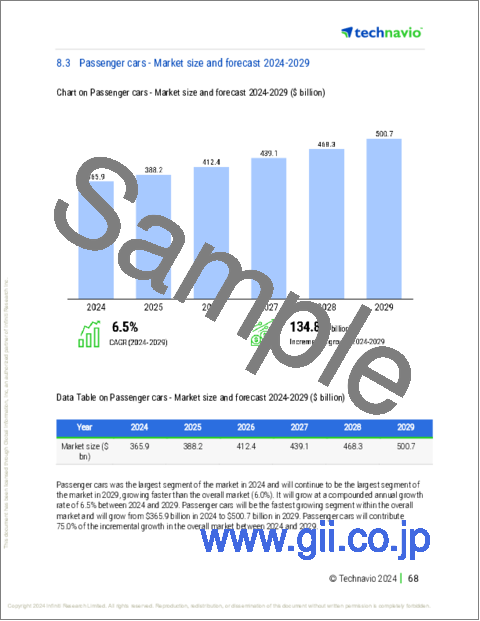
- 8.3 Passenger cars - Market size and forecast 2024-2029
- Chart on Passenger cars - Market size and forecast 2024-2029 ($ billion)
- Data Table on Passenger cars - Market size and forecast 2024-2029 ($ billion)
- Chart on Passenger cars - Year-over-year growth 2024-2029 (%)
- Data Table on Passenger cars - Year-over-year growth 2024-2029 (%)
- 8.4 Commercial vehicles - Market size and forecast 2024-2029
- Chart on Commercial vehicles - Market size and forecast 2024-2029 ($ billion)
- Data Table on Commercial vehicles - Market size and forecast 2024-2029 ($ billion)
- Chart on Commercial vehicles - Year-over-year growth 2024-2029 (%)
- Data Table on Commercial vehicles - Year-over-year growth 2024-2029 (%)
- 8.5 Market opportunity by Vehicle Type
- Market opportunity by Vehicle Type ($ billion)
- Data Table on Market opportunity by Vehicle Type ($ billion)
9 Market Segmentation by Distribution Channel
- 9.1 Market segments
- Chart on Distribution Channel - Market share 2024-2029 (%)
- Data Table on Distribution Channel - Market share 2024-2029 (%)
- 9.2 Comparison by Distribution Channel
- Chart on Comparison by Distribution Channel
- Data Table on Comparison by Distribution Channel
- 9.3 Retailer - Market size and forecast 2024-2029
- Chart on Retailer - Market size and forecast 2024-2029 ($ billion)
- Data Table on Retailer - Market size and forecast 2024-2029 ($ billion)
- Chart on Retailer - Year-over-year growth 2024-2029 (%)
- Data Table on Retailer - Year-over-year growth 2024-2029 (%)
- 9.4 Wholesale and distribution - Market size and forecast 2024-2029
- Chart on Wholesale and distribution - Market size and forecast 2024-2029 ($ billion)
- Data Table on Wholesale and distribution - Market size and forecast 2024-2029 ($ billion)
- Chart on Wholesale and distribution - Year-over-year growth 2024-2029 (%)
- Data Table on Wholesale and distribution - Year-over-year growth 2024-2029 (%)
- 9.5 Market opportunity by Distribution Channel
- Market opportunity by Distribution Channel ($ billion)
- Data Table on Market opportunity by Distribution Channel ($ billion)
10 Customer Landscape
- 10.1 Customer landscape overview
- Analysis of price sensitivity, lifecycle, customer purchase basket, adoption rates, and purchase criteria
11 Geographic Landscape
- 11.1 Geographic segmentation
- Chart on Market share By Geographical Landscape 2024-2029 (%)
- Data Table on Market share By Geographical Landscape 2024-2029 (%)
- 11.2 Geographic comparison
- Chart on Geographic comparison
- Data Table on Geographic comparison
- 11.3 APAC - Market size and forecast 2024-2029
- Chart on APAC - Market size and forecast 2024-2029 ($ billion)
- Data Table on APAC - Market size and forecast 2024-2029 ($ billion)
- Chart on APAC - Year-over-year growth 2024-2029 (%)
- Data Table on APAC - Year-over-year growth 2024-2029 (%)
- 11.4 Europe - Market size and forecast 2024-2029
- Chart on Europe - Market size and forecast 2024-2029 ($ billion)
- Data Table on Europe - Market size and forecast 2024-2029 ($ billion)
- Chart on Europe - Year-over-year growth 2024-2029 (%)
- Data Table on Europe - Year-over-year growth 2024-2029 (%)
- 11.5 North America - Market size and forecast 2024-2029
- Chart on North America - Market size and forecast 2024-2029 ($ billion)
- Data Table on North America - Market size and forecast 2024-2029 ($ billion)
- Chart on North America - Year-over-year growth 2024-2029 (%)
- Data Table on North America - Year-over-year growth 2024-2029 (%)
- 11.6 South America - Market size and forecast 2024-2029
- Chart on South America - Market size and forecast 2024-2029 ($ billion)
- Data Table on South America - Market size and forecast 2024-2029 ($ billion)
- Chart on South America - Year-over-year growth 2024-2029 (%)
- Data Table on South America - Year-over-year growth 2024-2029 (%)
- 11.7 Middle East and Africa - Market size and forecast 2024-2029
- Chart on Middle East and Africa - Market size and forecast 2024-2029 ($ billion)
- Data Table on Middle East and Africa - Market size and forecast 2024-2029 ($ billion)
- Chart on Middle East and Africa - Year-over-year growth 2024-2029 (%)
- Data Table on Middle East and Africa - Year-over-year growth 2024-2029 (%)
- 11.8 China - Market size and forecast 2024-2029
- Chart on China - Market size and forecast 2024-2029 ($ billion)
- Data Table on China - Market size and forecast 2024-2029 ($ billion)
- Chart on China - Year-over-year growth 2024-2029 (%)
- Data Table on China - Year-over-year growth 2024-2029 (%)
- 11.9 US - Market size and forecast 2024-2029
- Chart on US - Market size and forecast 2024-2029 ($ billion)
- Data Table on US - Market size and forecast 2024-2029 ($ billion)
- Chart on US - Year-over-year growth 2024-2029 (%)
- Data Table on US - Year-over-year growth 2024-2029 (%)
- 11.10 Japan - Market size and forecast 2024-2029
- Chart on Japan - Market size and forecast 2024-2029 ($ billion)
- Data Table on Japan - Market size and forecast 2024-2029 ($ billion)
- Chart on Japan - Year-over-year growth 2024-2029 (%)
- Data Table on Japan - Year-over-year growth 2024-2029 (%)
- 11.11 India - Market size and forecast 2024-2029
- Chart on India - Market size and forecast 2024-2029 ($ billion)
- Data Table on India - Market size and forecast 2024-2029 ($ billion)
- Chart on India - Year-over-year growth 2024-2029 (%)
- Data Table on India - Year-over-year growth 2024-2029 (%)
- 11.12 Germany - Market size and forecast 2024-2029
- Chart on Germany - Market size and forecast 2024-2029 ($ billion)
- Data Table on Germany - Market size and forecast 2024-2029 ($ billion)
- Chart on Germany - Year-over-year growth 2024-2029 (%)
- Data Table on Germany - Year-over-year growth 2024-2029 (%)
- 11.13 UK - Market size and forecast 2024-2029
- Chart on UK - Market size and forecast 2024-2029 ($ billion)
- Data Table on UK - Market size and forecast 2024-2029 ($ billion)
- Chart on UK - Year-over-year growth 2024-2029 (%)
- Data Table on UK - Year-over-year growth 2024-2029 (%)
- 11.14 France - Market size and forecast 2024-2029
- Chart on France - Market size and forecast 2024-2029 ($ billion)
- Data Table on France - Market size and forecast 2024-2029 ($ billion)
- Chart on France - Year-over-year growth 2024-2029 (%)
- Data Table on France - Year-over-year growth 2024-2029 (%)
- 11.15 South Korea - Market size and forecast 2024-2029
- Chart on South Korea - Market size and forecast 2024-2029 ($ billion)
- Data Table on South Korea - Market size and forecast 2024-2029 ($ billion)
- Chart on South Korea - Year-over-year growth 2024-2029 (%)
- Data Table on South Korea - Year-over-year growth 2024-2029 (%)
- 11.16 Brazil - Market size and forecast 2024-2029
- Chart on Brazil - Market size and forecast 2024-2029 ($ billion)
- Data Table on Brazil - Market size and forecast 2024-2029 ($ billion)
- Chart on Brazil - Year-over-year growth 2024-2029 (%)
- Data Table on Brazil - Year-over-year growth 2024-2029 (%)
- 11.17 Italy - Market size and forecast 2024-2029
- Chart on Italy - Market size and forecast 2024-2029 ($ billion)
- Data Table on Italy - Market size and forecast 2024-2029 ($ billion)
- Chart on Italy - Year-over-year growth 2024-2029 (%)
- Data Table on Italy - Year-over-year growth 2024-2029 (%)
- 11.18 Market opportunity By Geographical Landscape
- Market opportunity By Geographical Landscape ($ billion)
- Data Tables on Market opportunity By Geographical Landscape ($ billion)
12 Drivers, Challenges, and Opportunity/Restraints
- 12.1 Market drivers
- 12.2 Market challenges
- 12.3 Impact of drivers and challenges
- Impact of drivers and challenges in 2024 and 2029
- 12.4 Market opportunities/restraints
13 Competitive Landscape
- 13.1 Overview
- 13.2 Competitive Landscape
- Overview on criticality of inputs and factors of differentiation
- 13.3 Landscape disruption
- Overview on factors of disruption
- 13.4 Industry risks
- Impact of key risks on business
14 Competitive Analysis
- 14.1 Companies profiled
- Companies covered
- 14.2 Company ranking index
- Company ranking index
- 14.3 Market positioning of companies
- Matrix on companies position and classification
- 3M Co.
- 3M Co. - Overview
- 3M Co. - Business segments
- 3M Co. - Key news
- 3M Co. - Key offerings
- 3M Co. - Segment focus
- SWOT
- 14.5 AISIN CORP.
- AISIN CORP. - Overview
- AISIN CORP. - Business segments
- AISIN CORP. - Key news
- AISIN CORP. - Key offerings
- AISIN CORP. - Segment focus
- SWOT
- 14.6 Akebono Brake Corp.
- Akebono Brake Corp. - Overview
- Akebono Brake Corp. - Product / Service
- Akebono Brake Corp. - Key offerings
- SWOT
- 14.7 ALCO Filters Ltd.
- ALCO Filters Ltd. - Overview
- ALCO Filters Ltd. - Product / Service
- ALCO Filters Ltd. - Key offerings
- SWOT
- 14.8 BASF SE
- BASF SE - Overview
- BASF SE - Business segments
- BASF SE - Key news
- BASF SE - Key offerings
- BASF SE - Segment focus
- SWOT
- 14.9 BorgWarner Inc.
- BorgWarner Inc. - Overview
- BorgWarner Inc. - Business segments
- BorgWarner Inc. - Key news
- BorgWarner Inc. - Key offerings
- BorgWarner Inc. - Segment focus
- SWOT
- 14.10 Bridgestone Corp.
- Bridgestone Corp. - Overview
- Bridgestone Corp. - Business segments
- Bridgestone Corp. - Key news
- Bridgestone Corp. - Key offerings
- Bridgestone Corp. - Segment focus
- SWOT
- 14.11 Continental AG
- Continental AG - Overview
- Continental AG - Business segments
- Continental AG - Key news
- Continental AG - Key offerings
- Continental AG - Segment focus
- SWOT
- 14.12 DENSO Corp.
- DENSO Corp. - Overview
- DENSO Corp. - Business segments
- DENSO Corp. - Key news
- DENSO Corp. - Key offerings
- DENSO Corp. - Segment focus
- SWOT
- 14.13 Faurecia SE
- Faurecia SE - Overview
- Faurecia SE - Product / Service
- Faurecia SE - Key news
- Faurecia SE - Key offerings
- SWOT
- 14.14 HELLA GmbH and Co. KGaA
- HELLA GmbH and Co. KGaA - Overview
- HELLA GmbH and Co. KGaA - Business segments
- HELLA GmbH and Co. KGaA - Key news
- HELLA GmbH and Co. KGaA - Key offerings
- HELLA GmbH and Co. KGaA - Segment focus
- SWOT
- 14.15 JK Tyre and Industries Ltd.
- JK Tyre and Industries Ltd. - Overview
- JK Tyre and Industries Ltd. - Business segments
- JK Tyre and Industries Ltd. - Key offerings
- JK Tyre and Industries Ltd. - Segment focus
- SWOT
- 14.16 LCI Industries
- LCI Industries - Overview
- LCI Industries - Business segments
- LCI Industries - Key offerings
- LCI Industries - Segment focus
- SWOT
- 14.17 MAP MotoRad Automotive Parts Ltd.
- MAP MotoRad Automotive Parts Ltd. - Overview
- MAP MotoRad Automotive Parts Ltd. - Product / Service
- MAP MotoRad Automotive Parts Ltd. - Key offerings
- SWOT
- 14.18 Niterra Co. Ltd.
- Niterra Co. Ltd. - Overview
- Niterra Co. Ltd. - Business segments
- Niterra Co. Ltd. - Key offerings
- Niterra Co. Ltd. - Segment focus
- SWOT
15 Appendix
- 15.1 Scope of the report
- 15.2 Inclusions and exclusions checklist
- Inclusions checklist
- Exclusions checklist
- 15.3 Currency conversion rates for US$
- Currency conversion rates for US$
- 15.4 Research methodology
- Research methodology
- 15.5 Data procurement
- Information sources
- 15.6 Data validation
- Data validation
- 15.7 Validation techniques employed for market sizing
- Validation techniques employed for market sizing
- 15.8 Data synthesis
- Data synthesis
- 15.9 360 degree market analysis
- 360 degree market analysis
- 15.10 List of abbreviations
- List of abbreviations

