|
|
市場調査レポート
商品コード
1626740
照明の世界市場 2025-2029年Global Lighting Market 2025-2029 |
||||||

|
|||||||
カスタマイズ可能
|
|||||||


| 照明の世界市場 2025-2029年 |
|
出版日: 2024年12月19日
発行: TechNavio
ページ情報: 英文 200 Pages
納期: 即納可能
|

全表示
- 概要
- 図表
- 目次
照明市場 2025-2029年
照明市場は2024-2029年に628億米ドル、予測期間中のCAGRは7.4%で成長すると予測されます。当レポートでは、照明市場の全体的な分析、市場規模・予測、動向、成長促進要因、課題、約25のベンダーを網羅したベンダー分析などを掲載しています。
現在の市場シナリオ、最新動向と促進要因、市場環境全体に関する最新分析を提供しています。市場開発や照明製品の新興国市場の拡大、発光ダイオードの製造コストの低下、交通安全に関する厳しい規制などが市場を牽引しています。
| 市場範囲 | |
|---|---|
| 基準年 | 2025 |
| 終了年 | 2029 |
| 予測期間 | 2025-2029 |
| 成長モメンタム | 加速 |
| 前年比2025年 | 6.4% |
| CAGR | 7.4% |
| 増分額 | 628億米ドル |
本調査では、自動車用照明システムの進歩が、今後数年間の照明市場成長を牽引する主要因の1つであるとしています。また、インテリジェントな照明システムの普及とスマートシティの出現は、市場の大きな需要につながります。
目次
第1章 エグゼクティブサマリー
- 市場概要
第2章 Technavio別分析
- 価格・ライフサイクル・顧客購入バスケット・採用率・購入基準の分析
- インプットの重要性と差別化の要因
- 混乱の要因
- 促進要因と課題の影響
第3章 市場情勢
- 市場エコシステム
- 市場の特徴
- バリューチェーン分析
第4章 市場規模
- 市場の定義
- 市場セグメント分析
- 市場規模 2024
- 市場の見通し 2024-2029
第5章 市場規模実績
- 照明の世界市場 2019-2023
- 用途別セグメント分析 2019-2023
- タイプ別セグメント分析 2019-2023
- 地域別セグメント分析 2019-2023
- 国別セグメント分析 2019-2023
第6章 定性分析
- AIの影響:照明の世界市場
第7章 ファイブフォース分析
- ファイブフォースの要約
- 買い手の交渉力
- 供給企業の交渉力
- 新規参入業者の脅威
- 代替品の脅威
- 競争の脅威
- 市況
第8章 市場セグメンテーション:用途別
- 市場セグメント
- 比較:用途別
- 全般照明:市場規模と予測 2024-2029
- 自動車照明:市場規模と予測 2024-2029
- バックライト:市場規模と予測 2024-2029
- 市場機会:用途別
第9章 市場セグメンテーション:タイプ別
- 市場セグメント
- 比較:タイプ別
- LEDな技術:市場規模と予測 2024-2029
- 伝統的な技術:市場規模と予測 2024-2029
- 市場機会:タイプ別
第10章 顧客情勢
- 顧客情勢の概要
第11章 地域別情勢
- 地域別セグメンテーション
- 地域別比較
- アジア太平洋:市場規模と予測 2024-2029
- 欧州:市場規模と予測 2024-2029
- 北米:市場規模と予測 2024-2029
- 中東・アフリカ:市場規模と予測 2024-2029
- 南米:市場規模と予測 2024-2029
- 米国:市場規模と予測 2024-2029
- 中国:市場規模と予測 2024-2029
- ドイツ:市場規模と予測 2024-2029
- 日本:市場規模と予測 2024-2029
- 英国:市場規模と予測 2024-2029
- インド:市場規模と予測 2024-2029
- フランス:市場規模と予測 2024-2029
- 韓国:市場規模と予測 2024-2029
- カナダ:市場規模と予測 2024-2029
- イタリア:市場規模と予測 2024-2029
- 市場機会:地域情勢別
第12章 促進要因・課題・機会・抑制要因
- 市場促進要因
- 市場の課題
- 促進要因と課題の影響
- 市場の機会・抑制要因
第13章 競合情勢
- 概要
- 競合情勢
- 混乱の状況
- 業界のリスク
第14章 競合分析
- 企業プロファイル
- 企業ランキング指数
- 企業の市場ポジショニング
- Acuity Brands Inc.
- ams OSRAM AG
- Bridgelux Inc.
- Dialight Plc
- Digital Lumens Inc.
- Eaton Corp plc
- Ennostar Inc.
- General Electric Co.
- Hubbell Inc.
- IDEAL INDUSTRIES Inc.
- Koninklijke Philips NV
- LSI Industries Inc.
- Lumileds Holding BV
- Panasonic Holdings Corp.
- SMART Global Holdings Inc.
第15章 付録
Exhibits:
- Exhibits1: Executive Summary - Chart on Market Overview
- Exhibits2: Executive Summary - Data Table on Market Overview
- Exhibits3: Executive Summary - Chart on Global Market Characteristics
- Exhibits4: Executive Summary - Chart on Market By Geographical Landscape
- Exhibits5: Executive Summary - Chart on Market Segmentation by Application
- Exhibits6: Executive Summary - Chart on Market Segmentation by Type
- Exhibits7: Executive Summary - Chart on Incremental Growth
- Exhibits8: Executive Summary - Data Table on Incremental Growth
- Exhibits9: Executive Summary - Chart on Company Market Positioning
- Exhibits10: Analysis of price sensitivity, lifecycle, customer purchase basket, adoption rates, and purchase criteria
- Exhibits11: Overview on criticality of inputs and factors of differentiation
- Exhibits12: Overview on factors of disruption
- Exhibits13: Impact of drivers and challenges in 2024 and 2029
- Exhibits14: Parent Market
- Exhibits15: Data Table on - Parent Market
- Exhibits16: Market characteristics analysis
- Exhibits17: Value chain analysis
- Exhibits18: Offerings of companies included in the market definition
- Exhibits19: Market segments
- Exhibits20: Chart on Global - Market size and forecast 2024-2029 ($ billion)
- Exhibits21: Data Table on Global - Market size and forecast 2024-2029 ($ billion)
- Exhibits22: Chart on Global Market: Year-over-year growth 2024-2029 (%)
- Exhibits23: Data Table on Global Market: Year-over-year growth 2024-2029 (%)
- Exhibits24: Historic Market Size - Data Table on Global Lighting Market 2019 - 2023 ($ billion)
- Exhibits25: Historic Market Size - Application Segment 2019 - 2023 ($ billion)
- Exhibits26: Historic Market Size - Type Segment 2019 - 2023 ($ billion)
- Exhibits27: Historic Market Size - Geography Segment 2019 - 2023 ($ billion)
- Exhibits28: Historic Market Size - Country Segment 2019 - 2023 ($ billion)
- Exhibits29: Five forces analysis - Comparison between 2024 and 2029
- Exhibits30: Bargaining power of buyers - Impact of key factors 2024 and 2029
- Exhibits31: Bargaining power of suppliers - Impact of key factors in 2024 and 2029
- Exhibits32: Threat of new entrants - Impact of key factors in 2024 and 2029
- Exhibits33: Threat of substitutes - Impact of key factors in 2024 and 2029
- Exhibits34: Threat of rivalry - Impact of key factors in 2024 and 2029
- Exhibits35: Chart on Market condition - Five forces 2024 and 2029
- Exhibits36: Chart on Application - Market share 2024-2029 (%)
- Exhibits37: Data Table on Application - Market share 2024-2029 (%)
- Exhibits38: Chart on Comparison by Application
- Exhibits39: Data Table on Comparison by Application
- Exhibits40: Chart on General lighting - Market size and forecast 2024-2029 ($ billion)
- Exhibits41: Data Table on General lighting - Market size and forecast 2024-2029 ($ billion)
- Exhibits42: Chart on General lighting - Year-over-year growth 2024-2029 (%)
- Exhibits43: Data Table on General lighting - Year-over-year growth 2024-2029 (%)
- Exhibits44: Chart on Automotive lighting - Market size and forecast 2024-2029 ($ billion)
- Exhibits45: Data Table on Automotive lighting - Market size and forecast 2024-2029 ($ billion)
- Exhibits46: Chart on Automotive lighting - Year-over-year growth 2024-2029 (%)
- Exhibits47: Data Table on Automotive lighting - Year-over-year growth 2024-2029 (%)
- Exhibits48: Chart on Backlighting - Market size and forecast 2024-2029 ($ billion)
- Exhibits49: Data Table on Backlighting - Market size and forecast 2024-2029 ($ billion)
- Exhibits50: Chart on Backlighting - Year-over-year growth 2024-2029 (%)
- Exhibits51: Data Table on Backlighting - Year-over-year growth 2024-2029 (%)
- Exhibits52: Market opportunity by Application ($ billion)
- Exhibits53: Data Table on Market opportunity by Application ($ billion)
- Exhibits54: Chart on Type - Market share 2024-2029 (%)
- Exhibits55: Data Table on Type - Market share 2024-2029 (%)
- Exhibits56: Chart on Comparison by Type
- Exhibits57: Data Table on Comparison by Type
- Exhibits58: Chart on LED technology - Market size and forecast 2024-2029 ($ billion)
- Exhibits59: Data Table on LED technology - Market size and forecast 2024-2029 ($ billion)
- Exhibits60: Chart on LED technology - Year-over-year growth 2024-2029 (%)
- Exhibits61: Data Table on LED technology - Year-over-year growth 2024-2029 (%)
- Exhibits62: Chart on Traditional technology - Market size and forecast 2024-2029 ($ billion)
- Exhibits63: Data Table on Traditional technology - Market size and forecast 2024-2029 ($ billion)
- Exhibits64: Chart on Traditional technology - Year-over-year growth 2024-2029 (%)
- Exhibits65: Data Table on Traditional technology - Year-over-year growth 2024-2029 (%)
- Exhibits66: Market opportunity by Type ($ billion)
- Exhibits67: Data Table on Market opportunity by Type ($ billion)
- Exhibits68: Analysis of price sensitivity, lifecycle, customer purchase basket, adoption rates, and purchase criteria
- Exhibits69: Chart on Market share By Geographical Landscape 2024-2029 (%)
- Exhibits70: Data Table on Market share By Geographical Landscape 2024-2029 (%)
- Exhibits71: Chart on Geographic comparison
- Exhibits72: Data Table on Geographic comparison
- Exhibits73: Chart on APAC - Market size and forecast 2024-2029 ($ billion)
- Exhibits74: Data Table on APAC - Market size and forecast 2024-2029 ($ billion)
- Exhibits75: Chart on APAC - Year-over-year growth 2024-2029 (%)
- Exhibits76: Data Table on APAC - Year-over-year growth 2024-2029 (%)
- Exhibits77: Chart on Europe - Market size and forecast 2024-2029 ($ billion)
- Exhibits78: Data Table on Europe - Market size and forecast 2024-2029 ($ billion)
- Exhibits79: Chart on Europe - Year-over-year growth 2024-2029 (%)
- Exhibits80: Data Table on Europe - Year-over-year growth 2024-2029 (%)
- Exhibits81: Chart on North America - Market size and forecast 2024-2029 ($ billion)
- Exhibits82: Data Table on North America - Market size and forecast 2024-2029 ($ billion)
- Exhibits83: Chart on North America - Year-over-year growth 2024-2029 (%)
- Exhibits84: Data Table on North America - Year-over-year growth 2024-2029 (%)
- Exhibits85: Chart on Middle East and Africa - Market size and forecast 2024-2029 ($ billion)
- Exhibits86: Data Table on Middle East and Africa - Market size and forecast 2024-2029 ($ billion)
- Exhibits87: Chart on Middle East and Africa - Year-over-year growth 2024-2029 (%)
- Exhibits88: Data Table on Middle East and Africa - Year-over-year growth 2024-2029 (%)
- Exhibits89: Chart on South America - Market size and forecast 2024-2029 ($ billion)
- Exhibits90: Data Table on South America - Market size and forecast 2024-2029 ($ billion)
- Exhibits91: Chart on South America - Year-over-year growth 2024-2029 (%)
- Exhibits92: Data Table on South America - Year-over-year growth 2024-2029 (%)
- Exhibits93: Chart on US - Market size and forecast 2024-2029 ($ billion)
- Exhibits94: Data Table on US - Market size and forecast 2024-2029 ($ billion)
- Exhibits95: Chart on US - Year-over-year growth 2024-2029 (%)
- Exhibits96: Data Table on US - Year-over-year growth 2024-2029 (%)
- Exhibits97: Chart on China - Market size and forecast 2024-2029 ($ billion)
- Exhibits98: Data Table on China - Market size and forecast 2024-2029 ($ billion)
- Exhibits99: Chart on China - Year-over-year growth 2024-2029 (%)
- Exhibits100: Data Table on China - Year-over-year growth 2024-2029 (%)
- Exhibits101: Chart on Germany - Market size and forecast 2024-2029 ($ billion)
- Exhibits102: Data Table on Germany - Market size and forecast 2024-2029 ($ billion)
- Exhibits103: Chart on Germany - Year-over-year growth 2024-2029 (%)
- Exhibits104: Data Table on Germany - Year-over-year growth 2024-2029 (%)
- Exhibits105: Chart on Japan - Market size and forecast 2024-2029 ($ billion)
- Exhibits106: Data Table on Japan - Market size and forecast 2024-2029 ($ billion)
- Exhibits107: Chart on Japan - Year-over-year growth 2024-2029 (%)
- Exhibits108: Data Table on Japan - Year-over-year growth 2024-2029 (%)
- Exhibits109: Chart on UK - Market size and forecast 2024-2029 ($ billion)
- Exhibits110: Data Table on UK - Market size and forecast 2024-2029 ($ billion)
- Exhibits111: Chart on UK - Year-over-year growth 2024-2029 (%)
- Exhibits112: Data Table on UK - Year-over-year growth 2024-2029 (%)
- Exhibits113: Chart on India - Market size and forecast 2024-2029 ($ billion)
- Exhibits114: Data Table on India - Market size and forecast 2024-2029 ($ billion)
- Exhibits115: Chart on India - Year-over-year growth 2024-2029 (%)
- Exhibits116: Data Table on India - Year-over-year growth 2024-2029 (%)
- Exhibits117: Chart on France - Market size and forecast 2024-2029 ($ billion)
- Exhibits118: Data Table on France - Market size and forecast 2024-2029 ($ billion)
- Exhibits119: Chart on France - Year-over-year growth 2024-2029 (%)
- Exhibits120: Data Table on France - Year-over-year growth 2024-2029 (%)
- Exhibits121: Chart on South Korea - Market size and forecast 2024-2029 ($ billion)
- Exhibits122: Data Table on South Korea - Market size and forecast 2024-2029 ($ billion)
- Exhibits123: Chart on South Korea - Year-over-year growth 2024-2029 (%)
- Exhibits124: Data Table on South Korea - Year-over-year growth 2024-2029 (%)
- Exhibits125: Chart on Canada - Market size and forecast 2024-2029 ($ billion)
- Exhibits126: Data Table on Canada - Market size and forecast 2024-2029 ($ billion)
- Exhibits127: Chart on Canada - Year-over-year growth 2024-2029 (%)
- Exhibits128: Data Table on Canada - Year-over-year growth 2024-2029 (%)
- Exhibits129: Chart on Italy - Market size and forecast 2024-2029 ($ billion)
- Exhibits130: Data Table on Italy - Market size and forecast 2024-2029 ($ billion)
- Exhibits131: Chart on Italy - Year-over-year growth 2024-2029 (%)
- Exhibits132: Data Table on Italy - Year-over-year growth 2024-2029 (%)
- Exhibits133: Market opportunity By Geographical Landscape ($ billion)
- Exhibits134: Data Tables on Market opportunity By Geographical Landscape ($ billion)
- Exhibits135: Impact of drivers and challenges in 2024 and 2029
- Exhibits136: Overview on criticality of inputs and factors of differentiation
- Exhibits137: Overview on factors of disruption
- Exhibits138: Impact of key risks on business
- Exhibits139: Companies covered
- Exhibits140: Company ranking index
- Exhibits141: Matrix on companies position and classification
- Exhibits142: Acuity Brands Inc. - Overview
- Exhibits143: Acuity Brands Inc. - Business segments
- Exhibits144: Acuity Brands Inc. - Key offerings
- Exhibits145: Acuity Brands Inc. - Segment focus
- Exhibits146: SWOT
- Exhibits147: ams OSRAM AG - Overview
- Exhibits148: ams OSRAM AG - Business segments
- Exhibits149: ams OSRAM AG - Key news
- Exhibits150: ams OSRAM AG - Key offerings
- Exhibits151: ams OSRAM AG - Segment focus
- Exhibits152: SWOT
- Exhibits153: Bridgelux Inc. - Overview
- Exhibits154: Bridgelux Inc. - Product / Service
- Exhibits155: Bridgelux Inc. - Key offerings
- Exhibits156: SWOT
- Exhibits157: Dialight Plc - Overview
- Exhibits158: Dialight Plc - Business segments
- Exhibits159: Dialight Plc - Key news
- Exhibits160: Dialight Plc - Key offerings
- Exhibits161: Dialight Plc - Segment focus
- Exhibits162: SWOT
- Exhibits163: Digital Lumens Inc. - Overview
- Exhibits164: Digital Lumens Inc. - Product / Service
- Exhibits165: Digital Lumens Inc. - Key offerings
- Exhibits166: SWOT
- Exhibits167: Eaton Corp plc - Overview
- Exhibits168: Eaton Corp plc - Business segments
- Exhibits169: Eaton Corp plc - Key news
- Exhibits170: Eaton Corp plc - Key offerings
- Exhibits171: Eaton Corp plc - Segment focus
- Exhibits172: SWOT
- Exhibits173: Ennostar Inc. - Overview
- Exhibits174: Ennostar Inc. - Business segments
- Exhibits175: Ennostar Inc. - Key news
- Exhibits176: Ennostar Inc. - Key offerings
- Exhibits177: Ennostar Inc. - Segment focus
- Exhibits178: SWOT
- Exhibits179: General Electric Co. - Overview
- Exhibits180: General Electric Co. - Business segments
- Exhibits181: General Electric Co. - Key news
- Exhibits182: General Electric Co. - Key offerings
- Exhibits183: General Electric Co. - Segment focus
- Exhibits184: SWOT
- Exhibits185: Hubbell Inc. - Overview
- Exhibits186: Hubbell Inc. - Business segments
- Exhibits187: Hubbell Inc. - Key news
- Exhibits188: Hubbell Inc. - Key offerings
- Exhibits189: Hubbell Inc. - Segment focus
- Exhibits190: SWOT
- Exhibits191: IDEAL INDUSTRIES Inc. - Overview
- Exhibits192: IDEAL INDUSTRIES Inc. - Product / Service
- Exhibits193: IDEAL INDUSTRIES Inc. - Key offerings
- Exhibits194: SWOT
- Exhibits195: Koninklijke Philips NV - Overview
- Exhibits196: Koninklijke Philips NV - Business segments
- Exhibits197: Koninklijke Philips NV - Key news
- Exhibits198: Koninklijke Philips NV - Key offerings
- Exhibits199: Koninklijke Philips NV - Segment focus
- Exhibits200: SWOT
- Exhibits201: LSI Industries Inc. - Overview
- Exhibits202: LSI Industries Inc. - Business segments
- Exhibits203: LSI Industries Inc. - Key offerings
- Exhibits204: LSI Industries Inc. - Segment focus
- Exhibits205: SWOT
- Exhibits206: Lumileds Holding BV - Overview
- Exhibits207: Lumileds Holding BV - Product / Service
- Exhibits208: Lumileds Holding BV - Key offerings
- Exhibits209: SWOT
- Exhibits210: Panasonic Holdings Corp. - Overview
- Exhibits211: Panasonic Holdings Corp. - Product / Service
- Exhibits212: Panasonic Holdings Corp. - Key news
- Exhibits213: Panasonic Holdings Corp. - Key offerings
- Exhibits214: SWOT
- Exhibits215: SMART Global Holdings Inc. - Overview
- Exhibits216: SMART Global Holdings Inc. - Business segments
- Exhibits217: SMART Global Holdings Inc. - Key offerings
- Exhibits218: SMART Global Holdings Inc. - Segment focus
- Exhibits219: SWOT
- Exhibits220: Inclusions checklist
- Exhibits221: Exclusions checklist
- Exhibits222: Currency conversion rates for US$
- Exhibits223: Research methodology
- Exhibits224: Information sources
- Exhibits225: Data validation
- Exhibits226: Validation techniques employed for market sizing
- Exhibits227: Data synthesis
- Exhibits228: 360 degree market analysis
- Exhibits229: List of abbreviations
Lighting Market 2025-2029
The lighting market is forecasted to grow by USD 62.8 bn during 2024-2029, accelerating at a CAGR of 7.4% during the forecast period. The report on the lighting market provides a holistic analysis, market size and forecast, trends, growth drivers, and challenges, as well as vendor analysis covering around 25 vendors.
The report offers an up-to-date analysis regarding the current market scenario, the latest trends and drivers, and the overall market environment. The market is driven by growing number of developments and lighting product launches, declining manufacturing cost of light-emitting diodes, and stringent regulations on road safety.
| Market Scope | |
|---|---|
| Base Year | 2025 |
| End Year | 2029 |
| Series Year | 2025-2029 |
| Growth Momentum | Accelerate |
| YOY 2025 | 6.4% |
| CAGR | 7.4% |
| Incremental Value | $62.8 bn |
Technavio's lighting market is segmented as below:
By Application
- General lighting
- Automotive lighting
- Backlighting
By Type
- LED technology
- Traditional technology
By Geographical Landscape
- APAC
- Europe
- North America
- Middle East and Africa
- South America
This study identifies the advances in automotive lighting systems as one of the prime reasons driving the lighting market growth during the next few years. Also, growing traction of intelligent lighting systems and emergence of smart cities will lead to sizable demand in the market.
The report on the lighting market covers the following areas:
- Lighting Market sizing
- Lighting Market forecast
- Lighting Market industry analysis
The robust vendor analysis is designed to help clients improve their market position, and in line with this, this report provides a detailed analysis of several leading lighting market vendors that include Acuity Brands Inc., ams OSRAM AG, Bridgelux Inc., Dialight Plc, Digital Lumens Inc., Eaton Corp plc, Ennostar Inc., General Electric Co., GrowRay Lighting Technologies, Havells India Ltd., Hubbell Inc., IDEAL INDUSTRIES Inc., Koninklijke Philips NV, LSI Industries Inc., Lumileds Holding BV, Panasonic Holdings Corp., Sharp Corp., SMART Global Holdings Inc., Syska Led Lights Pvt. Ltd., and Toyoda Gosei Co. Ltd.. Also, the lighting market analysis report includes information on upcoming trends and challenges that will influence market growth. This is to help companies strategize and leverage all forthcoming growth opportunities.
The study was conducted using an objective combination of primary and secondary information including inputs from key participants in the industry. The report contains a comprehensive market and vendor landscape in addition to an analysis of the key vendors.
The publisher presents a detailed picture of the market by the way of study, synthesis, and summation of data from multiple sources by an analysis of key parameters such as profit, pricing, competition, and promotions. It presents various market facets by identifying the key industry influencers. The data presented is comprehensive, reliable, and a result of extensive primary and secondary research. The market research reports provide a complete competitive landscape and an in-depth vendor selection methodology and analysis using qualitative and quantitative research to forecast accurate market growth.
Table of Contents
1 Executive Summary
- 1.1 Market overview
- Executive Summary - Chart on Market Overview
- Executive Summary - Data Table on Market Overview
- Executive Summary - Chart on Global Market Characteristics
- Executive Summary - Chart on Market By Geographical Landscape
- Executive Summary - Chart on Market Segmentation by Application
- Executive Summary - Chart on Market Segmentation by Type
- Executive Summary - Chart on Incremental Growth
- Executive Summary - Data Table on Incremental Growth
- Executive Summary - Chart on Company Market Positioning
2 Technavio Analysis
- 2.1 Analysis of price sensitivity, lifecycle, customer purchase basket, adoption rates, and purchase criteria
- Analysis of price sensitivity, lifecycle, customer purchase basket, adoption rates, and purchase criteria
- 2.2 Criticality of inputs and Factors of differentiation
- Overview on criticality of inputs and factors of differentiation
- 2.3 Factors of disruption
- Overview on factors of disruption
- 2.4 Impact of drivers and challenges
- Impact of drivers and challenges in 2024 and 2029
3 Market Landscape
- 3.1 Market ecosystem
- Parent Market
- Data Table on - Parent Market
- 3.2 Market characteristics
- Market characteristics analysis
- 3.3 Value chain analysis
- Value chain analysis
4 Market Sizing
- 4.1 Market definition
- Offerings of companies included in the market definition
- 4.2 Market segment analysis
- Market segments
- 4.3 Market size 2024
- 4.4 Market outlook: Forecast for 2024-2029
- Chart on Global - Market size and forecast 2024-2029 ($ billion)
- Data Table on Global - Market size and forecast 2024-2029 ($ billion)
- Chart on Global Market: Year-over-year growth 2024-2029 (%)
- Data Table on Global Market: Year-over-year growth 2024-2029 (%)
5 Historic Market Size
- 5.1 Global Lighting Market 2019 - 2023
- Historic Market Size - Data Table on Global Lighting Market 2019 - 2023 ($ billion)
- 5.2 Application segment analysis 2019 - 2023
- Historic Market Size - Application Segment 2019 - 2023 ($ billion)
- 5.3 Type segment analysis 2019 - 2023
- Historic Market Size - Type Segment 2019 - 2023 ($ billion)
- 5.4 Geography segment analysis 2019 - 2023
- Historic Market Size - Geography Segment 2019 - 2023 ($ billion)
- 5.5 Country segment analysis 2019 - 2023
- Historic Market Size - Country Segment 2019 - 2023 ($ billion)
6 Qualitative Analysis
- 6.1 Impact of AI on Global Lighting Market
7 Five Forces Analysis
- 7.1 Five forces summary
- Five forces analysis - Comparison between 2024 and 2029
- 7.2 Bargaining power of buyers
- Bargaining power of buyers - Impact of key factors 2024 and 2029
- 7.3 Bargaining power of suppliers
- Bargaining power of suppliers - Impact of key factors in 2024 and 2029
- 7.4 Threat of new entrants
- Threat of new entrants - Impact of key factors in 2024 and 2029
- 7.5 Threat of substitutes
- Threat of substitutes - Impact of key factors in 2024 and 2029
- 7.6 Threat of rivalry
- Threat of rivalry - Impact of key factors in 2024 and 2029
- 7.7 Market condition
- Chart on Market condition - Five forces 2024 and 2029
8 Market Segmentation by Application
- 8.1 Market segments
- Chart on Application - Market share 2024-2029 (%)
- Data Table on Application - Market share 2024-2029 (%)
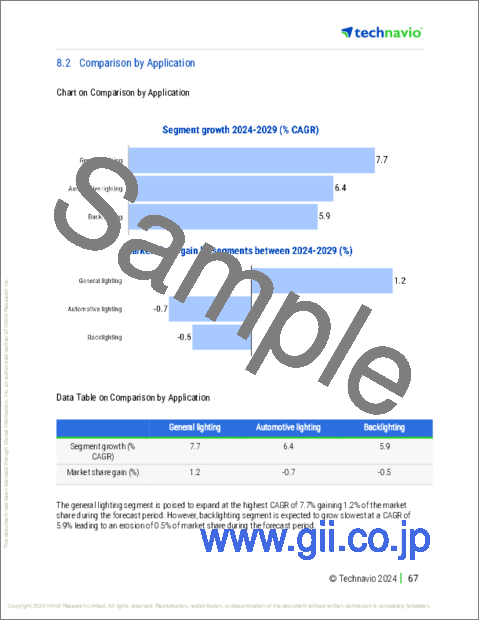
- 8.2 Comparison by Application
- Chart on Comparison by Application
- Data Table on Comparison by Application
- 8.3 General lighting - Market size and forecast 2024-2029
- Chart on General lighting - Market size and forecast 2024-2029 ($ billion)
- Data Table on General lighting - Market size and forecast 2024-2029 ($ billion)
- Chart on General lighting - Year-over-year growth 2024-2029 (%)
- Data Table on General lighting - Year-over-year growth 2024-2029 (%)
- 8.4 Automotive lighting - Market size and forecast 2024-2029
- Chart on Automotive lighting - Market size and forecast 2024-2029 ($ billion)
- Data Table on Automotive lighting - Market size and forecast 2024-2029 ($ billion)
- Chart on Automotive lighting - Year-over-year growth 2024-2029 (%)
- Data Table on Automotive lighting - Year-over-year growth 2024-2029 (%)
- 8.5 Backlighting - Market size and forecast 2024-2029
- Chart on Backlighting - Market size and forecast 2024-2029 ($ billion)
- Data Table on Backlighting - Market size and forecast 2024-2029 ($ billion)
- Chart on Backlighting - Year-over-year growth 2024-2029 (%)
- Data Table on Backlighting - Year-over-year growth 2024-2029 (%)
- 8.6 Market opportunity by Application
- Market opportunity by Application ($ billion)
- Data Table on Market opportunity by Application ($ billion)
9 Market Segmentation by Type
- 9.1 Market segments
- Chart on Type - Market share 2024-2029 (%)
- Data Table on Type - Market share 2024-2029 (%)
- 9.2 Comparison by Type
- Chart on Comparison by Type
- Data Table on Comparison by Type
- 9.3 LED technology - Market size and forecast 2024-2029
- Chart on LED technology - Market size and forecast 2024-2029 ($ billion)
- Data Table on LED technology - Market size and forecast 2024-2029 ($ billion)
- Chart on LED technology - Year-over-year growth 2024-2029 (%)
- Data Table on LED technology - Year-over-year growth 2024-2029 (%)
- 9.4 Traditional technology - Market size and forecast 2024-2029
- Chart on Traditional technology - Market size and forecast 2024-2029 ($ billion)
- Data Table on Traditional technology - Market size and forecast 2024-2029 ($ billion)
- Chart on Traditional technology - Year-over-year growth 2024-2029 (%)
- Data Table on Traditional technology - Year-over-year growth 2024-2029 (%)
- 9.5 Market opportunity by Type
- Market opportunity by Type ($ billion)
- Data Table on Market opportunity by Type ($ billion)
10 Customer Landscape
- 10.1 Customer landscape overview
- Analysis of price sensitivity, lifecycle, customer purchase basket, adoption rates, and purchase criteria
11 Geographic Landscape
- 11.1 Geographic segmentation
- Chart on Market share By Geographical Landscape 2024-2029 (%)
- Data Table on Market share By Geographical Landscape 2024-2029 (%)
- 11.2 Geographic comparison
- Chart on Geographic comparison
- Data Table on Geographic comparison
- 11.3 APAC - Market size and forecast 2024-2029
- Chart on APAC - Market size and forecast 2024-2029 ($ billion)
- Data Table on APAC - Market size and forecast 2024-2029 ($ billion)
- Chart on APAC - Year-over-year growth 2024-2029 (%)
- Data Table on APAC - Year-over-year growth 2024-2029 (%)
- 11.4 Europe - Market size and forecast 2024-2029
- Chart on Europe - Market size and forecast 2024-2029 ($ billion)
- Data Table on Europe - Market size and forecast 2024-2029 ($ billion)
- Chart on Europe - Year-over-year growth 2024-2029 (%)
- Data Table on Europe - Year-over-year growth 2024-2029 (%)
- 11.5 North America - Market size and forecast 2024-2029
- Chart on North America - Market size and forecast 2024-2029 ($ billion)
- Data Table on North America - Market size and forecast 2024-2029 ($ billion)
- Chart on North America - Year-over-year growth 2024-2029 (%)
- Data Table on North America - Year-over-year growth 2024-2029 (%)
- 11.6 Middle East and Africa - Market size and forecast 2024-2029
- Chart on Middle East and Africa - Market size and forecast 2024-2029 ($ billion)
- Data Table on Middle East and Africa - Market size and forecast 2024-2029 ($ billion)
- Chart on Middle East and Africa - Year-over-year growth 2024-2029 (%)
- Data Table on Middle East and Africa - Year-over-year growth 2024-2029 (%)
- 11.7 South America - Market size and forecast 2024-2029
- Chart on South America - Market size and forecast 2024-2029 ($ billion)
- Data Table on South America - Market size and forecast 2024-2029 ($ billion)
- Chart on South America - Year-over-year growth 2024-2029 (%)
- Data Table on South America - Year-over-year growth 2024-2029 (%)
- 11.8 US - Market size and forecast 2024-2029
- Chart on US - Market size and forecast 2024-2029 ($ billion)
- Data Table on US - Market size and forecast 2024-2029 ($ billion)
- Chart on US - Year-over-year growth 2024-2029 (%)
- Data Table on US - Year-over-year growth 2024-2029 (%)
- 11.9 China - Market size and forecast 2024-2029
- Chart on China - Market size and forecast 2024-2029 ($ billion)
- Data Table on China - Market size and forecast 2024-2029 ($ billion)
- Chart on China - Year-over-year growth 2024-2029 (%)
- Data Table on China - Year-over-year growth 2024-2029 (%)
- 11.10 Germany - Market size and forecast 2024-2029
- Chart on Germany - Market size and forecast 2024-2029 ($ billion)
- Data Table on Germany - Market size and forecast 2024-2029 ($ billion)
- Chart on Germany - Year-over-year growth 2024-2029 (%)
- Data Table on Germany - Year-over-year growth 2024-2029 (%)
- 11.11 Japan - Market size and forecast 2024-2029
- Chart on Japan - Market size and forecast 2024-2029 ($ billion)
- Data Table on Japan - Market size and forecast 2024-2029 ($ billion)
- Chart on Japan - Year-over-year growth 2024-2029 (%)
- Data Table on Japan - Year-over-year growth 2024-2029 (%)
- 11.12 UK - Market size and forecast 2024-2029
- Chart on UK - Market size and forecast 2024-2029 ($ billion)
- Data Table on UK - Market size and forecast 2024-2029 ($ billion)
- Chart on UK - Year-over-year growth 2024-2029 (%)
- Data Table on UK - Year-over-year growth 2024-2029 (%)
- 11.13 India - Market size and forecast 2024-2029
- Chart on India - Market size and forecast 2024-2029 ($ billion)
- Data Table on India - Market size and forecast 2024-2029 ($ billion)
- Chart on India - Year-over-year growth 2024-2029 (%)
- Data Table on India - Year-over-year growth 2024-2029 (%)
- 11.14 France - Market size and forecast 2024-2029
- Chart on France - Market size and forecast 2024-2029 ($ billion)
- Data Table on France - Market size and forecast 2024-2029 ($ billion)
- Chart on France - Year-over-year growth 2024-2029 (%)
- Data Table on France - Year-over-year growth 2024-2029 (%)
- 11.15 South Korea - Market size and forecast 2024-2029
- Chart on South Korea - Market size and forecast 2024-2029 ($ billion)
- Data Table on South Korea - Market size and forecast 2024-2029 ($ billion)
- Chart on South Korea - Year-over-year growth 2024-2029 (%)
- Data Table on South Korea - Year-over-year growth 2024-2029 (%)
- 11.16 Canada - Market size and forecast 2024-2029
- Chart on Canada - Market size and forecast 2024-2029 ($ billion)
- Data Table on Canada - Market size and forecast 2024-2029 ($ billion)
- Chart on Canada - Year-over-year growth 2024-2029 (%)
- Data Table on Canada - Year-over-year growth 2024-2029 (%)
- 11.17 Italy - Market size and forecast 2024-2029
- Chart on Italy - Market size and forecast 2024-2029 ($ billion)
- Data Table on Italy - Market size and forecast 2024-2029 ($ billion)
- Chart on Italy - Year-over-year growth 2024-2029 (%)
- Data Table on Italy - Year-over-year growth 2024-2029 (%)
- 11.18 Market opportunity By Geographical Landscape
- Market opportunity By Geographical Landscape ($ billion)
- Data Tables on Market opportunity By Geographical Landscape ($ billion)
12 Drivers, Challenges, and Opportunity/Restraints
- 12.1 Market drivers
- 12.2 Market challenges
- 12.3 Impact of drivers and challenges
- Impact of drivers and challenges in 2024 and 2029
- 12.4 Market opportunities/restraints
13 Competitive Landscape
- 13.1 Overview
- 13.2 Competitive Landscape
- Overview on criticality of inputs and factors of differentiation
- 13.3 Landscape disruption
- Overview on factors of disruption
- 13.4 Industry risks
- Impact of key risks on business
14 Competitive Analysis
- 14.1 Companies profiled
- Companies covered
- 14.2 Company ranking index
- Company ranking index
- 14.3 Market positioning of companies
- Matrix on companies position and classification
- 14.4 Acuity Brands Inc.
- Acuity Brands Inc. - Overview
- Acuity Brands Inc. - Business segments
- Acuity Brands Inc. - Key offerings
- Acuity Brands Inc. - Segment focus
- SWOT
- 14.5 ams OSRAM AG
- ams OSRAM AG - Overview
- ams OSRAM AG - Business segments
- ams OSRAM AG - Key news
- ams OSRAM AG - Key offerings
- ams OSRAM AG - Segment focus
- SWOT
- 14.6 Bridgelux Inc.
- Bridgelux Inc. - Overview
- Bridgelux Inc. - Product / Service
- Bridgelux Inc. - Key offerings
- SWOT
- 14.7 Dialight Plc
- Dialight Plc - Overview
- Dialight Plc - Business segments
- Dialight Plc - Key news
- Dialight Plc - Key offerings
- Dialight Plc - Segment focus
- SWOT
- 14.8 Digital Lumens Inc.
- Digital Lumens Inc. - Overview
- Digital Lumens Inc. - Product / Service
- Digital Lumens Inc. - Key offerings
- SWOT
- 14.9 Eaton Corp plc
- Eaton Corp plc - Overview
- Eaton Corp plc - Business segments
- Eaton Corp plc - Key news
- Eaton Corp plc - Key offerings
- Eaton Corp plc - Segment focus
- SWOT
- 14.10 Ennostar Inc.
- Ennostar Inc. - Overview
- Ennostar Inc. - Business segments
- Ennostar Inc. - Key news
- Ennostar Inc. - Key offerings
- Ennostar Inc. - Segment focus
- SWOT
- 14.11 General Electric Co.
- General Electric Co. - Overview
- General Electric Co. - Business segments
- General Electric Co. - Key news
- General Electric Co. - Key offerings
- General Electric Co. - Segment focus
- SWOT
- 14.12 Hubbell Inc.
- Hubbell Inc. - Overview
- Hubbell Inc. - Business segments
- Hubbell Inc. - Key news
- Hubbell Inc. - Key offerings
- Hubbell Inc. - Segment focus
- SWOT
- 14.13 IDEAL INDUSTRIES Inc.
- IDEAL INDUSTRIES Inc. - Overview
- IDEAL INDUSTRIES Inc. - Product / Service
- IDEAL INDUSTRIES Inc. - Key offerings
- SWOT
- 14.14 Koninklijke Philips NV
- Koninklijke Philips NV - Overview
- Koninklijke Philips NV - Business segments
- Koninklijke Philips NV - Key news
- Koninklijke Philips NV - Key offerings
- Koninklijke Philips NV - Segment focus
- SWOT
- 14.15 LSI Industries Inc.
- LSI Industries Inc. - Overview
- LSI Industries Inc. - Business segments
- LSI Industries Inc. - Key offerings
- LSI Industries Inc. - Segment focus
- SWOT
- 14.16 Lumileds Holding BV
- Lumileds Holding BV - Overview
- Lumileds Holding BV - Product / Service
- Lumileds Holding BV - Key offerings
- SWOT
- 14.17 Panasonic Holdings Corp.
- Panasonic Holdings Corp. - Overview
- Panasonic Holdings Corp. - Product / Service
- Panasonic Holdings Corp. - Key news
- Panasonic Holdings Corp. - Key offerings
- SWOT
- 14.18 SMART Global Holdings Inc.
- SMART Global Holdings Inc. - Overview
- SMART Global Holdings Inc. - Business segments
- SMART Global Holdings Inc. - Key offerings
- SMART Global Holdings Inc. - Segment focus
- SWOT
15 Appendix
- 15.1 Scope of the report
- 15.2 Inclusions and exclusions checklist
- Inclusions checklist
- Exclusions checklist
- 15.3 Currency conversion rates for US$
- Currency conversion rates for US$
- 15.4 Research methodology
- Research methodology
- 15.5 Data procurement
- Information sources
- 15.6 Data validation
- Data validation
- 15.7 Validation techniques employed for market sizing
- Validation techniques employed for market sizing
- 15.8 Data synthesis
- Data synthesis
- 15.9 360 degree market analysis
- 360 degree market analysis
- 15.10 List of abbreviations
- List of abbreviations

