|
|
市場調査レポート
商品コード
1626422
セルフストレージと引越しサービスの世界市場、2025~2029年Global Self-storage and Moving Services Market 2025-2029 |
||||||

|
|||||||
カスタマイズ可能
|
|||||||


| セルフストレージと引越しサービスの世界市場、2025~2029年 |
|
出版日: 2024年12月21日
発行: TechNavio
ページ情報: 英文 199 Pages
納期: 即納可能
|

全表示
- 概要
- 図表
- 目次
セルフストレージと引越しサービス市場、2025~2029年
セルフストレージと引越しサービス市場は2024~2029年に581億2,220万米ドル、予測期間中のCAGRは9.3%で成長すると予測されます。当レポートでは、セルフストレージと引越しサービス市場の全体的な分析、市場規模・予測、動向、成長促進要因、課題、約25のベンダーを網羅したベンダー分析などを掲載しています。
現在の市場シナリオ、最新動向と促進要因、市場環境全体に関する最新分析を提供しています。市場は、世界の不動産投資の拡大、都市部の人口密度増加による住宅スペースの減少、業務の効率化を目的としたセルフストレージソフトウェアの利用増加などが牽引しています。
| 市場範囲 | |
|---|---|
| 基準年 | 2025年 |
| 終了年 | 2029年 |
| 予測期間 | 2025~2029年 |
| 成長モメンタム | 加速 |
| 前年比[2025年] | 7.9% |
| CAGR | 9.3% |
| 増分額 | 581億2,220万米ドル |
本調査では、クラウドベースのセルフストレージと引越しサービスソフトウェアとモバイルアプリケーションの出現が、今後数年間のセルフストレージと引越しサービス市場成長を牽引する主要因の一つであると指摘しています。また、eコマース産業の成長によるセルフストレージシステム需要の増加や、世界のモバイルホーム産業の合併も、市場の大きな需要につながると考えられます。
目次
第1章 エグゼクティブサマリー
- 市場概要
第2章 Technavio分析
- 価格・ライフサイクル・顧客購入バスケット・採用率・購入基準の分析
- インプットの重要性と差別化の要因
- 混乱の要因
- 促進要因と課題の影響
第3章 市場情勢
- 市場エコシステム
- 市場の特徴
- バリューチェーン分析
第4章 市場規模
- 市場の定義
- 市場セグメント分析
- 市場規模 2024年
- 市場の展望 2024~2029年
第5章 市場規模実績
- セルフストレージと引越しサービスの世界市場 2019~2023年
- タイプ別セグメント分析 2019~2023年
- サービス別セグメント分析 2019~2023年
- 地域別セグメント分析 2019~2023年
- 国別セグメント分析 2019~2023年
第6章 定性分析
- AIの影響-セルフストレージと引越しサービスの世界市場
第7章 ファイブフォース分析
- ファイブフォースの要約
- 買い手の交渉力
- 供給企業の交渉力
- 新規参入業者の脅威
- 代替品の脅威
- 競争の脅威
- 市況
第8章 市場セグメンテーション:タイプ別
- 市場セグメント
- 比較:タイプ別
- セルフストレージ:市場規模と予測 2024~2029年
- 引越しサービス:市場規模と予測 2024~2029年
- 市場機会:タイプ別
第9章 市場セグメンテーション:サービス別
- 市場セグメント
- 比較:サービス別
- 温度管理型セルフストレージ:市場規模と予測 2024~2029年
- フルサービスの引越し:市場規模と予測 2024~2029年
- 非空調管理型セルフストレージ:市場規模と予測 2024~2029年
- DIY引越しトラックレンタル:市場規模と予測 2024~2029年
- 市場機会:サービス別
第10章 顧客情勢
- 顧客情勢概要
第11章 地域別情勢
- 地域別セグメンテーション
- 比較:地域別
- 北米:市場規模と予測 2024~2029年
- 欧州:市場規模と予測 2024~2029年
- アジア太平洋:市場規模と予測 2024~2029年
- 南米:市場規模と予測 2024~2029年
- 中東・アフリカ:市場規模と予測 2024~2029年
- 米国:市場規模と予測 2024~2029年
- カナダ:市場規模と予測 2024~2029年
- ドイツ:市場規模と予測 2024~2029年
- 英国:市場規模と予測 2024~2029年
- 中国:市場規模と予測 2024~2029年
- フランス:市場規模と予測 2024~2029年
- 日本:市場規模と予測 2024~2029年
- インド:市場規模と予測 2024~2029年
- スペイン:市場規模と予測 2024~2029年
- 韓国:市場規模と予測 2024~2029年
- 地域情勢による市場機会
第12章 促進要因・課題・機会・抑制要因
- 市場促進要因
- 市場課題
- 促進要因と課題の影響
- 市場機会・抑制要因
第13章 競合情勢
- 概要
- 競合情勢
- 混乱の状況
- 産業のリスク
第14章 競合分析
- 企業プロファイル
- 企業ランキング指数
- 企業の市場ポジショニング
- Big Yellow Group
- CubeSmart LP
- Extra Space Storage Inc.
- Kennards Self Storage
- Life Storage
- Men On The Move
- Mid West Moving and Storage Inc.
- MYMOVE LLC
- National Storage
- PODS Enterprises LLC
- Public Storage
- Ready Steady Store Ltd.
- Safestore Holdings plc
- Schroders plc
- SIRVA Worldwide Inc.
第15章 付録
Exhibits:
- Exhibits1: Executive Summary - Chart on Market Overview
- Exhibits2: Executive Summary - Data Table on Market Overview
- Exhibits3: Executive Summary - Chart on Global Market Characteristics
- Exhibits4: Executive Summary - Chart on Market By Geographical Landscape
- Exhibits5: Executive Summary - Chart on Market Segmentation by Type
- Exhibits6: Executive Summary - Chart on Market Segmentation by Service
- Exhibits7: Executive Summary - Chart on Incremental Growth
- Exhibits8: Executive Summary - Data Table on Incremental Growth
- Exhibits9: Executive Summary - Chart on Company Market Positioning
- Exhibits10: Analysis of price sensitivity, lifecycle, customer purchase basket, adoption rates, and purchase criteria
- Exhibits11: Overview on criticality of inputs and factors of differentiation
- Exhibits12: Overview on factors of disruption
- Exhibits13: Impact of drivers and challenges in 2024 and 2029
- Exhibits14: Parent Market
- Exhibits15: Data Table on - Parent Market
- Exhibits16: Market characteristics analysis
- Exhibits17: Value chain analysis
- Exhibits18: Offerings of companies included in the market definition
- Exhibits19: Market segments
- Exhibits20: Chart on Global - Market size and forecast 2024-2029 ($ million)
- Exhibits21: Data Table on Global - Market size and forecast 2024-2029 ($ million)
- Exhibits22: Chart on Global Market: Year-over-year growth 2024-2029 (%)
- Exhibits23: Data Table on Global Market: Year-over-year growth 2024-2029 (%)
- Exhibits24: Historic Market Size - Data Table on Global Self-Storage And Moving Services Market 2019 - 2023 ($ million)
- Exhibits25: Historic Market Size - Type Segment 2019 - 2023 ($ million)
- Exhibits26: Historic Market Size - Service Segment 2019 - 2023 ($ million)
- Exhibits27: Historic Market Size - Geography Segment 2019 - 2023 ($ million)
- Exhibits28: Historic Market Size - Country Segment 2019 - 2023 ($ million)
- Exhibits29: Five forces analysis - Comparison between 2024 and 2029
- Exhibits30: Bargaining power of buyers - Impact of key factors 2024 and 2029
- Exhibits31: Bargaining power of suppliers - Impact of key factors in 2024 and 2029
- Exhibits32: Threat of new entrants - Impact of key factors in 2024 and 2029
- Exhibits33: Threat of substitutes - Impact of key factors in 2024 and 2029
- Exhibits34: Threat of rivalry - Impact of key factors in 2024 and 2029
- Exhibits35: Chart on Market condition - Five forces 2024 and 2029
- Exhibits36: Chart on Type - Market share 2024-2029 (%)
- Exhibits37: Data Table on Type - Market share 2024-2029 (%)
- Exhibits38: Chart on Comparison by Type
- Exhibits39: Data Table on Comparison by Type
- Exhibits40: Chart on Self-storage - Market size and forecast 2024-2029 ($ million)
- Exhibits41: Data Table on Self-storage - Market size and forecast 2024-2029 ($ million)
- Exhibits42: Chart on Self-storage - Year-over-year growth 2024-2029 (%)
- Exhibits43: Data Table on Self-storage - Year-over-year growth 2024-2029 (%)
- Exhibits44: Chart on Moving services - Market size and forecast 2024-2029 ($ million)
- Exhibits45: Data Table on Moving services - Market size and forecast 2024-2029 ($ million)
- Exhibits46: Chart on Moving services - Year-over-year growth 2024-2029 (%)
- Exhibits47: Data Table on Moving services - Year-over-year growth 2024-2029 (%)
- Exhibits48: Market opportunity by Type ($ million)
- Exhibits49: Data Table on Market opportunity by Type ($ million)
- Exhibits50: Chart on Service - Market share 2024-2029 (%)
- Exhibits51: Data Table on Service - Market share 2024-2029 (%)
- Exhibits52: Chart on Comparison by Service
- Exhibits53: Data Table on Comparison by Service
- Exhibits54: Chart on Climate-controlled self-storage - Market size and forecast 2024-2029 ($ million)
- Exhibits55: Data Table on Climate-controlled self-storage - Market size and forecast 2024-2029 ($ million)
- Exhibits56: Chart on Climate-controlled self-storage - Year-over-year growth 2024-2029 (%)
- Exhibits57: Data Table on Climate-controlled self-storage - Year-over-year growth 2024-2029 (%)
- Exhibits58: Chart on Full-service moving - Market size and forecast 2024-2029 ($ million)
- Exhibits59: Data Table on Full-service moving - Market size and forecast 2024-2029 ($ million)
- Exhibits60: Chart on Full-service moving - Year-over-year growth 2024-2029 (%)
- Exhibits61: Data Table on Full-service moving - Year-over-year growth 2024-2029 (%)
- Exhibits62: Chart on Non-climate controlled self-storage - Market size and forecast 2024-2029 ($ million)
- Exhibits63: Data Table on Non-climate controlled self-storage - Market size and forecast 2024-2029 ($ million)
- Exhibits64: Chart on Non-climate controlled self-storage - Year-over-year growth 2024-2029 (%)
- Exhibits65: Data Table on Non-climate controlled self-storage - Year-over-year growth 2024-2029 (%)
- Exhibits66: Chart on DIY moving truck rental - Market size and forecast 2024-2029 ($ million)
- Exhibits67: Data Table on DIY moving truck rental - Market size and forecast 2024-2029 ($ million)
- Exhibits68: Chart on DIY moving truck rental - Year-over-year growth 2024-2029 (%)
- Exhibits69: Data Table on DIY moving truck rental - Year-over-year growth 2024-2029 (%)
- Exhibits70: Market opportunity by Service ($ million)
- Exhibits71: Data Table on Market opportunity by Service ($ million)
- Exhibits72: Analysis of price sensitivity, lifecycle, customer purchase basket, adoption rates, and purchase criteria
- Exhibits73: Chart on Market share By Geographical Landscape 2024-2029 (%)
- Exhibits74: Data Table on Market share By Geographical Landscape 2024-2029 (%)
- Exhibits75: Chart on Geographic comparison
- Exhibits76: Data Table on Geographic comparison
- Exhibits77: Chart on North America - Market size and forecast 2024-2029 ($ million)
- Exhibits78: Data Table on North America - Market size and forecast 2024-2029 ($ million)
- Exhibits79: Chart on North America - Year-over-year growth 2024-2029 (%)
- Exhibits80: Data Table on North America - Year-over-year growth 2024-2029 (%)
- Exhibits81: Chart on Europe - Market size and forecast 2024-2029 ($ million)
- Exhibits82: Data Table on Europe - Market size and forecast 2024-2029 ($ million)
- Exhibits83: Chart on Europe - Year-over-year growth 2024-2029 (%)
- Exhibits84: Data Table on Europe - Year-over-year growth 2024-2029 (%)
- Exhibits85: Chart on APAC - Market size and forecast 2024-2029 ($ million)
- Exhibits86: Data Table on APAC - Market size and forecast 2024-2029 ($ million)
- Exhibits87: Chart on APAC - Year-over-year growth 2024-2029 (%)
- Exhibits88: Data Table on APAC - Year-over-year growth 2024-2029 (%)
- Exhibits89: Chart on South America - Market size and forecast 2024-2029 ($ million)
- Exhibits90: Data Table on South America - Market size and forecast 2024-2029 ($ million)
- Exhibits91: Chart on South America - Year-over-year growth 2024-2029 (%)
- Exhibits92: Data Table on South America - Year-over-year growth 2024-2029 (%)
- Exhibits93: Chart on Middle East and Africa - Market size and forecast 2024-2029 ($ million)
- Exhibits94: Data Table on Middle East and Africa - Market size and forecast 2024-2029 ($ million)
- Exhibits95: Chart on Middle East and Africa - Year-over-year growth 2024-2029 (%)
- Exhibits96: Data Table on Middle East and Africa - Year-over-year growth 2024-2029 (%)
- Exhibits97: Chart on US - Market size and forecast 2024-2029 ($ million)
- Exhibits98: Data Table on US - Market size and forecast 2024-2029 ($ million)
- Exhibits99: Chart on US - Year-over-year growth 2024-2029 (%)
- Exhibits100: Data Table on US - Year-over-year growth 2024-2029 (%)
- Exhibits101: Chart on Canada - Market size and forecast 2024-2029 ($ million)
- Exhibits102: Data Table on Canada - Market size and forecast 2024-2029 ($ million)
- Exhibits103: Chart on Canada - Year-over-year growth 2024-2029 (%)
- Exhibits104: Data Table on Canada - Year-over-year growth 2024-2029 (%)
- Exhibits105: Chart on Germany - Market size and forecast 2024-2029 ($ million)
- Exhibits106: Data Table on Germany - Market size and forecast 2024-2029 ($ million)
- Exhibits107: Chart on Germany - Year-over-year growth 2024-2029 (%)
- Exhibits108: Data Table on Germany - Year-over-year growth 2024-2029 (%)
- Exhibits109: Chart on UK - Market size and forecast 2024-2029 ($ million)
- Exhibits110: Data Table on UK - Market size and forecast 2024-2029 ($ million)
- Exhibits111: Chart on UK - Year-over-year growth 2024-2029 (%)
- Exhibits112: Data Table on UK - Year-over-year growth 2024-2029 (%)
- Exhibits113: Chart on China - Market size and forecast 2024-2029 ($ million)
- Exhibits114: Data Table on China - Market size and forecast 2024-2029 ($ million)
- Exhibits115: Chart on China - Year-over-year growth 2024-2029 (%)
- Exhibits116: Data Table on China - Year-over-year growth 2024-2029 (%)
- Exhibits117: Chart on France - Market size and forecast 2024-2029 ($ million)
- Exhibits118: Data Table on France - Market size and forecast 2024-2029 ($ million)
- Exhibits119: Chart on France - Year-over-year growth 2024-2029 (%)
- Exhibits120: Data Table on France - Year-over-year growth 2024-2029 (%)
- Exhibits121: Chart on Japan - Market size and forecast 2024-2029 ($ million)
- Exhibits122: Data Table on Japan - Market size and forecast 2024-2029 ($ million)
- Exhibits123: Chart on Japan - Year-over-year growth 2024-2029 (%)
- Exhibits124: Data Table on Japan - Year-over-year growth 2024-2029 (%)
- Exhibits125: Chart on India - Market size and forecast 2024-2029 ($ million)
- Exhibits126: Data Table on India - Market size and forecast 2024-2029 ($ million)
- Exhibits127: Chart on India - Year-over-year growth 2024-2029 (%)
- Exhibits128: Data Table on India - Year-over-year growth 2024-2029 (%)
- Exhibits129: Chart on Spain - Market size and forecast 2024-2029 ($ million)
- Exhibits130: Data Table on Spain - Market size and forecast 2024-2029 ($ million)
- Exhibits131: Chart on Spain - Year-over-year growth 2024-2029 (%)
- Exhibits132: Data Table on Spain - Year-over-year growth 2024-2029 (%)
- Exhibits133: Chart on South Korea - Market size and forecast 2024-2029 ($ million)
- Exhibits134: Data Table on South Korea - Market size and forecast 2024-2029 ($ million)
- Exhibits135: Chart on South Korea - Year-over-year growth 2024-2029 (%)
- Exhibits136: Data Table on South Korea - Year-over-year growth 2024-2029 (%)
- Exhibits137: Market opportunity By Geographical Landscape ($ million)
- Exhibits138: Data Tables on Market opportunity By Geographical Landscape ($ million)
- Exhibits139: Impact of drivers and challenges in 2024 and 2029
- Exhibits140: Overview on criticality of inputs and factors of differentiation
- Exhibits141: Overview on factors of disruption
- Exhibits142: Impact of key risks on business
- Exhibits143: Companies covered
- Exhibits144: Company ranking index
- Exhibits145: Matrix on companies position and classification
- Exhibits146: Big Yellow Group - Overview
- Exhibits147: Big Yellow Group - Product / Service
- Exhibits148: Big Yellow Group - Key offerings
- Exhibits149: SWOT
- Exhibits150: CubeSmart LP - Overview
- Exhibits151: CubeSmart LP - Product / Service
- Exhibits152: CubeSmart LP - Key offerings
- Exhibits153: SWOT
- Exhibits154: Extra Space Storage Inc. - Overview
- Exhibits155: Extra Space Storage Inc. - Product / Service
- Exhibits156: Extra Space Storage Inc. - Key offerings
- Exhibits157: SWOT
- Exhibits158: Kennards Self Storage - Overview
- Exhibits159: Kennards Self Storage - Product / Service
- Exhibits160: Kennards Self Storage - Key offerings
- Exhibits161: SWOT
- Exhibits162: Life Storage - Overview
- Exhibits163: Life Storage - Product / Service
- Exhibits164: Life Storage - Key offerings
- Exhibits165: SWOT
- Exhibits166: Men On The Move - Overview
- Exhibits167: Men On The Move - Product / Service
- Exhibits168: Men On The Move - Key offerings
- Exhibits169: SWOT
- Exhibits170: Mid West Moving and Storage Inc. - Overview
- Exhibits171: Mid West Moving and Storage Inc. - Product / Service
- Exhibits172: Mid West Moving and Storage Inc. - Key offerings
- Exhibits173: SWOT
- Exhibits174: MYMOVE LLC - Overview
- Exhibits175: MYMOVE LLC - Product / Service
- Exhibits176: MYMOVE LLC - Key offerings
- Exhibits177: SWOT
- Exhibits178: National Storage - Overview
- Exhibits179: National Storage - Product / Service
- Exhibits180: National Storage - Key offerings
- Exhibits181: SWOT
- Exhibits182: PODS Enterprises LLC - Overview
- Exhibits183: PODS Enterprises LLC - Product / Service
- Exhibits184: PODS Enterprises LLC - Key offerings
- Exhibits185: SWOT
- Exhibits186: Public Storage - Overview
- Exhibits187: Public Storage - Business segments
- Exhibits188: Public Storage - Key offerings
- Exhibits189: Public Storage - Segment focus
- Exhibits190: SWOT
- Exhibits191: Ready Steady Store Ltd. - Overview
- Exhibits192: Ready Steady Store Ltd. - Product / Service
- Exhibits193: Ready Steady Store Ltd. - Key offerings
- Exhibits194: SWOT
- Exhibits195: Safestore Holdings plc - Overview
- Exhibits196: Safestore Holdings plc - Business segments
- Exhibits197: Safestore Holdings plc - Key offerings
- Exhibits198: Safestore Holdings plc - Segment focus
- Exhibits199: SWOT
- Exhibits200: Schroders plc - Overview
- Exhibits201: Schroders plc - Product / Service
- Exhibits202: Schroders plc - Key offerings
- Exhibits203: SWOT
- Exhibits204: SIRVA Worldwide Inc. - Overview
- Exhibits205: SIRVA Worldwide Inc. - Product / Service
- Exhibits206: SIRVA Worldwide Inc. - Key offerings
- Exhibits207: SWOT
- Exhibits208: Inclusions checklist
- Exhibits209: Exclusions checklist
- Exhibits210: Currency conversion rates for US$
- Exhibits211: Research methodology
- Exhibits212: Information sources
- Exhibits213: Data validation
- Exhibits214: Validation techniques employed for market sizing
- Exhibits215: Data synthesis
- Exhibits216: 360 degree market analysis
- Exhibits217: List of abbreviations
Self-Storage And Moving Services Market 2025-2029
The self-storage and moving services market is forecasted to grow by USD 58122.2 mn during 2024-2029, accelerating at a CAGR of 9.3% during the forecast period. The report on the self-storage and moving services market provides a holistic analysis, market size and forecast, trends, growth drivers, and challenges, as well as vendor analysis covering around 25 vendors.
The report offers an up-to-date analysis regarding the current market scenario, the latest trends and drivers, and the overall market environment. The market is driven by growing real-estate investments globally, reduced housing space due to increasing urban population density, and rising use of self-storage software to increase efficiency of operations.
| Market Scope | |
|---|---|
| Base Year | 2025 |
| End Year | 2029 |
| Series Year | 2025-2029 |
| Growth Momentum | Accelerate |
| YOY 2025 | 7.9% |
| CAGR | 9.3% |
| Incremental Value | $58122.2 mn |
Technavio's self-storage and moving services market is segmented as below:
By Type
- Self-storage
- Moving services
By Service
- Climate-controlled self-storage
- Full-service moving
- Non-climate controlled self-storage
- DIY moving truck rental
By Geographical Landscape
- North America
- Europe
- APAC
- South America
- Middle East and Africa
This study identifies the emergence of cloud-based self-storage and moving services software and mobile applications as one of the prime reasons driving the self-storage and moving services market growth during the next few years. Also, growing e-commerce industry increasing demand for self-storage systems and merging global mobile homes industry will lead to sizable demand in the market.
The report on the self-storage and moving services market covers the following areas:
- Self-Storage And Moving Services Market sizing
- Self-Storage And Moving Services Market forecast
- Self-Storage And Moving Services Market industry analysis
The robust vendor analysis is designed to help clients improve their market position, and in line with this, this report provides a detailed analysis of several leading self-storage and moving services market vendors that include Big Yellow Group, CubeSmart LP, Extra Space Storage Inc., Kennards Self Storage, Life Storage, Men On The Move, Mid West Moving and Storage Inc., MYMOVE LLC, National Storage, PODS Enterprises LLC, Public Storage, Ready Steady Store Ltd., Safestore Holdings plc, Schroders plc, SIRVA Worldwide Inc., Spacer, The Box, and U Haul International Inc.. Also, the self-storage and moving services market analysis report includes information on upcoming trends and challenges that will influence market growth. This is to help companies strategize and leverage all forthcoming growth opportunities.
The study was conducted using an objective combination of primary and secondary information including inputs from key participants in the industry. The report contains a comprehensive market and vendor landscape in addition to an analysis of the key vendors.
The publisher presents a detailed picture of the market by the way of study, synthesis, and summation of data from multiple sources by an analysis of key parameters such as profit, pricing, competition, and promotions. It presents various market facets by identifying the key industry influencers. The data presented is comprehensive, reliable, and a result of extensive primary and secondary research. The market research reports provide a complete competitive landscape and an in-depth vendor selection methodology and analysis using qualitative and quantitative research to forecast accurate market growth.
Table of Contents
1 Executive Summary
- 1.1 Market overview
- Executive Summary - Chart on Market Overview
- Executive Summary - Data Table on Market Overview
- Executive Summary - Chart on Global Market Characteristics
- Executive Summary - Chart on Market By Geographical Landscape
- Executive Summary - Chart on Market Segmentation by Type
- Executive Summary - Chart on Market Segmentation by Service
- Executive Summary - Chart on Incremental Growth
- Executive Summary - Data Table on Incremental Growth
- Executive Summary - Chart on Company Market Positioning
2 Technavio Analysis
- 2.1 Analysis of price sensitivity, lifecycle, customer purchase basket, adoption rates, and purchase criteria
- Analysis of price sensitivity, lifecycle, customer purchase basket, adoption rates, and purchase criteria
- 2.2 Criticality of inputs and Factors of differentiation
- Overview on criticality of inputs and factors of differentiation
- 2.3 Factors of disruption
- Overview on factors of disruption
- 2.4 Impact of drivers and challenges
- Impact of drivers and challenges in 2024 and 2029
3 Market Landscape
- 3.1 Market ecosystem
- Parent Market
- Data Table on - Parent Market
- 3.2 Market characteristics
- Market characteristics analysis
- 3.3 Value chain analysis
- Value chain analysis
4 Market Sizing
- 4.1 Market definition
- Offerings of companies included in the market definition
- 4.2 Market segment analysis
- Market segments
- 4.3 Market size 2024
- 4.4 Market outlook: Forecast for 2024-2029
- Chart on Global - Market size and forecast 2024-2029 ($ million)
- Data Table on Global - Market size and forecast 2024-2029 ($ million)
- Chart on Global Market: Year-over-year growth 2024-2029 (%)
- Data Table on Global Market: Year-over-year growth 2024-2029 (%)
5 Historic Market Size
- 5.1 Global Self-Storage And Moving Services Market 2019 - 2023
- Historic Market Size - Data Table on Global Self-Storage And Moving Services Market 2019 - 2023 ($ million)
- 5.2 Type segment analysis 2019 - 2023
- Historic Market Size - Type Segment 2019 - 2023 ($ million)
- 5.3 Service segment analysis 2019 - 2023
- Historic Market Size - Service Segment 2019 - 2023 ($ million)
- 5.4 Geography segment analysis 2019 - 2023
- Historic Market Size - Geography Segment 2019 - 2023 ($ million)
- 5.5 Country segment analysis 2019 - 2023
- Historic Market Size - Country Segment 2019 - 2023 ($ million)
6 Qualitative Analysis
- 6.1 Impact of AI on Global Self-Storage and Moving Services Market
7 Five Forces Analysis
- 7.1 Five forces summary
- Five forces analysis - Comparison between 2024 and 2029
- 7.2 Bargaining power of buyers
- Bargaining power of buyers - Impact of key factors 2024 and 2029
- 7.3 Bargaining power of suppliers
- Bargaining power of suppliers - Impact of key factors in 2024 and 2029
- 7.4 Threat of new entrants
- Threat of new entrants - Impact of key factors in 2024 and 2029
- 7.5 Threat of substitutes
- Threat of substitutes - Impact of key factors in 2024 and 2029
- 7.6 Threat of rivalry
- Threat of rivalry - Impact of key factors in 2024 and 2029
- 7.7 Market condition
- Chart on Market condition - Five forces 2024 and 2029
8 Market Segmentation by Type
- 8.1 Market segments
- Chart on Type - Market share 2024-2029 (%)
- Data Table on Type - Market share 2024-2029 (%)
- 8.2 Comparison by Type
- Chart on Comparison by Type
- Data Table on Comparison by Type
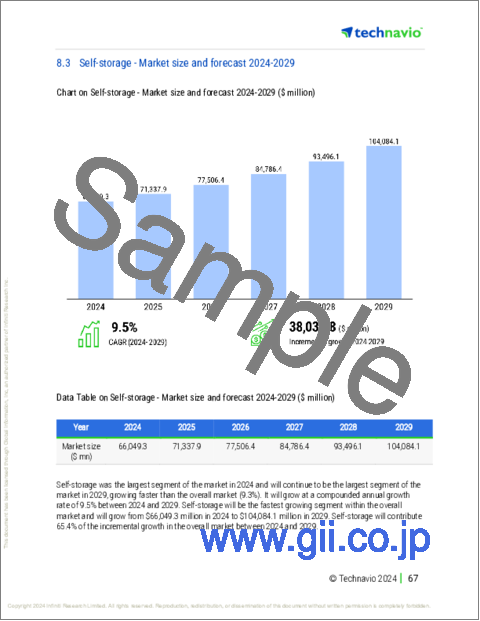
- 8.3 Self-storage - Market size and forecast 2024-2029
- Chart on Self-storage - Market size and forecast 2024-2029 ($ million)
- Data Table on Self-storage - Market size and forecast 2024-2029 ($ million)
- Chart on Self-storage - Year-over-year growth 2024-2029 (%)
- Data Table on Self-storage - Year-over-year growth 2024-2029 (%)
- 8.4 Moving services - Market size and forecast 2024-2029
- Chart on Moving services - Market size and forecast 2024-2029 ($ million)
- Data Table on Moving services - Market size and forecast 2024-2029 ($ million)
- Chart on Moving services - Year-over-year growth 2024-2029 (%)
- Data Table on Moving services - Year-over-year growth 2024-2029 (%)
- 8.5 Market opportunity by Type
- Market opportunity by Type ($ million)
- Data Table on Market opportunity by Type ($ million)
9 Market Segmentation by Service
- 9.1 Market segments
- Chart on Service - Market share 2024-2029 (%)
- Data Table on Service - Market share 2024-2029 (%)
- 9.2 Comparison by Service
- Chart on Comparison by Service
- Data Table on Comparison by Service
- 9.3 Climate-controlled self-storage - Market size and forecast 2024-2029
- Chart on Climate-controlled self-storage - Market size and forecast 2024-2029 ($ million)
- Data Table on Climate-controlled self-storage - Market size and forecast 2024-2029 ($ million)
- Chart on Climate-controlled self-storage - Year-over-year growth 2024-2029 (%)
- Data Table on Climate-controlled self-storage - Year-over-year growth 2024-2029 (%)
- 9.4 Full-service moving - Market size and forecast 2024-2029
- Chart on Full-service moving - Market size and forecast 2024-2029 ($ million)
- Data Table on Full-service moving - Market size and forecast 2024-2029 ($ million)
- Chart on Full-service moving - Year-over-year growth 2024-2029 (%)
- Data Table on Full-service moving - Year-over-year growth 2024-2029 (%)
- 9.5 Non-climate controlled self-storage - Market size and forecast 2024-2029
- Chart on Non-climate controlled self-storage - Market size and forecast 2024-2029 ($ million)
- Data Table on Non-climate controlled self-storage - Market size and forecast 2024-2029 ($ million)
- Chart on Non-climate controlled self-storage - Year-over-year growth 2024-2029 (%)
- Data Table on Non-climate controlled self-storage - Year-over-year growth 2024-2029 (%)
- 9.6 DIY moving truck rental - Market size and forecast 2024-2029
- Chart on DIY moving truck rental - Market size and forecast 2024-2029 ($ million)
- Data Table on DIY moving truck rental - Market size and forecast 2024-2029 ($ million)
- Chart on DIY moving truck rental - Year-over-year growth 2024-2029 (%)
- Data Table on DIY moving truck rental - Year-over-year growth 2024-2029 (%)
- 9.7 Market opportunity by Service
- Market opportunity by Service ($ million)
- Data Table on Market opportunity by Service ($ million)
10 Customer Landscape
- 10.1 Customer landscape overview
- Analysis of price sensitivity, lifecycle, customer purchase basket, adoption rates, and purchase criteria
11 Geographic Landscape
- 11.1 Geographic segmentation
- Chart on Market share By Geographical Landscape 2024-2029 (%)
- Data Table on Market share By Geographical Landscape 2024-2029 (%)
- 11.2 Geographic comparison
- Chart on Geographic comparison
- Data Table on Geographic comparison
- 11.3 North America - Market size and forecast 2024-2029
- Chart on North America - Market size and forecast 2024-2029 ($ million)
- Data Table on North America - Market size and forecast 2024-2029 ($ million)
- Chart on North America - Year-over-year growth 2024-2029 (%)
- Data Table on North America - Year-over-year growth 2024-2029 (%)
- 11.4 Europe - Market size and forecast 2024-2029
- Chart on Europe - Market size and forecast 2024-2029 ($ million)
- Data Table on Europe - Market size and forecast 2024-2029 ($ million)
- Chart on Europe - Year-over-year growth 2024-2029 (%)
- Data Table on Europe - Year-over-year growth 2024-2029 (%)
- 11.5 APAC - Market size and forecast 2024-2029
- Chart on APAC - Market size and forecast 2024-2029 ($ million)
- Data Table on APAC - Market size and forecast 2024-2029 ($ million)
- Chart on APAC - Year-over-year growth 2024-2029 (%)
- Data Table on APAC - Year-over-year growth 2024-2029 (%)
- 11.6 South America - Market size and forecast 2024-2029
- Chart on South America - Market size and forecast 2024-2029 ($ million)
- Data Table on South America - Market size and forecast 2024-2029 ($ million)
- Chart on South America - Year-over-year growth 2024-2029 (%)
- Data Table on South America - Year-over-year growth 2024-2029 (%)
- 11.7 Middle East and Africa - Market size and forecast 2024-2029
- Chart on Middle East and Africa - Market size and forecast 2024-2029 ($ million)
- Data Table on Middle East and Africa - Market size and forecast 2024-2029 ($ million)
- Chart on Middle East and Africa - Year-over-year growth 2024-2029 (%)
- Data Table on Middle East and Africa - Year-over-year growth 2024-2029 (%)
- 11.8 US - Market size and forecast 2024-2029
- Chart on US - Market size and forecast 2024-2029 ($ million)
- Data Table on US - Market size and forecast 2024-2029 ($ million)
- Chart on US - Year-over-year growth 2024-2029 (%)
- Data Table on US - Year-over-year growth 2024-2029 (%)
- 11.9 Canada - Market size and forecast 2024-2029
- Chart on Canada - Market size and forecast 2024-2029 ($ million)
- Data Table on Canada - Market size and forecast 2024-2029 ($ million)
- Chart on Canada - Year-over-year growth 2024-2029 (%)
- Data Table on Canada - Year-over-year growth 2024-2029 (%)
- 11.10 Germany - Market size and forecast 2024-2029
- Chart on Germany - Market size and forecast 2024-2029 ($ million)
- Data Table on Germany - Market size and forecast 2024-2029 ($ million)
- Chart on Germany - Year-over-year growth 2024-2029 (%)
- Data Table on Germany - Year-over-year growth 2024-2029 (%)
- 11.11 UK - Market size and forecast 2024-2029
- Chart on UK - Market size and forecast 2024-2029 ($ million)
- Data Table on UK - Market size and forecast 2024-2029 ($ million)
- Chart on UK - Year-over-year growth 2024-2029 (%)
- Data Table on UK - Year-over-year growth 2024-2029 (%)
- 11.12 China - Market size and forecast 2024-2029
- Chart on China - Market size and forecast 2024-2029 ($ million)
- Data Table on China - Market size and forecast 2024-2029 ($ million)
- Chart on China - Year-over-year growth 2024-2029 (%)
- Data Table on China - Year-over-year growth 2024-2029 (%)
- 11.13 France - Market size and forecast 2024-2029
- Chart on France - Market size and forecast 2024-2029 ($ million)
- Data Table on France - Market size and forecast 2024-2029 ($ million)
- Chart on France - Year-over-year growth 2024-2029 (%)
- Data Table on France - Year-over-year growth 2024-2029 (%)
- 11.14 Japan - Market size and forecast 2024-2029
- Chart on Japan - Market size and forecast 2024-2029 ($ million)
- Data Table on Japan - Market size and forecast 2024-2029 ($ million)
- Chart on Japan - Year-over-year growth 2024-2029 (%)
- Data Table on Japan - Year-over-year growth 2024-2029 (%)
- 11.15 India - Market size and forecast 2024-2029
- Chart on India - Market size and forecast 2024-2029 ($ million)
- Data Table on India - Market size and forecast 2024-2029 ($ million)
- Chart on India - Year-over-year growth 2024-2029 (%)
- Data Table on India - Year-over-year growth 2024-2029 (%)
- 11.16 Spain - Market size and forecast 2024-2029
- Chart on Spain - Market size and forecast 2024-2029 ($ million)
- Data Table on Spain - Market size and forecast 2024-2029 ($ million)
- Chart on Spain - Year-over-year growth 2024-2029 (%)
- Data Table on Spain - Year-over-year growth 2024-2029 (%)
- 11.17 South Korea - Market size and forecast 2024-2029
- Chart on South Korea - Market size and forecast 2024-2029 ($ million)
- Data Table on South Korea - Market size and forecast 2024-2029 ($ million)
- Chart on South Korea - Year-over-year growth 2024-2029 (%)
- Data Table on South Korea - Year-over-year growth 2024-2029 (%)
- 11.18 Market opportunity By Geographical Landscape
- Market opportunity By Geographical Landscape ($ million)
- Data Tables on Market opportunity By Geographical Landscape ($ million)
12 Drivers, Challenges, and Opportunity/Restraints
- 12.1 Market drivers
- 12.2 Market challenges
- 12.3 Impact of drivers and challenges
- Impact of drivers and challenges in 2024 and 2029
- 12.4 Market opportunities/restraints
13 Competitive Landscape
- 13.1 Overview
- 13.2 Competitive Landscape
- Overview on criticality of inputs and factors of differentiation
- 13.3 Landscape disruption
- Overview on factors of disruption
- 13.4 Industry risks
- Impact of key risks on business
14 Competitive Analysis
- 14.1 Companies profiled
- Companies covered
- 14.2 Company ranking index
- Company ranking index
- 14.3 Market positioning of companies
- Matrix on companies position and classification
- 14.4 Big Yellow Group
- Big Yellow Group - Overview
- Big Yellow Group - Product / Service
- Big Yellow Group - Key offerings
- SWOT
- 14.5 CubeSmart LP
- CubeSmart LP - Overview
- CubeSmart LP - Product / Service
- CubeSmart LP - Key offerings
- SWOT
- 14.6 Extra Space Storage Inc.
- Extra Space Storage Inc. - Overview
- Extra Space Storage Inc. - Product / Service
- Extra Space Storage Inc. - Key offerings
- SWOT
- 14.7 Kennards Self Storage
- Kennards Self Storage - Overview
- Kennards Self Storage - Product / Service
- Kennards Self Storage - Key offerings
- SWOT
- 14.8 Life Storage
- Life Storage - Overview
- Life Storage - Product / Service
- Life Storage - Key offerings
- SWOT
- 14.9 Men On The Move
- Men On The Move - Overview
- Men On The Move - Product / Service
- Men On The Move - Key offerings
- SWOT
- 14.10 Mid West Moving and Storage Inc.
- Mid West Moving and Storage Inc. - Overview
- Mid West Moving and Storage Inc. - Product / Service
- Mid West Moving and Storage Inc. - Key offerings
- SWOT
- 14.11 MYMOVE LLC
- MYMOVE LLC - Overview
- MYMOVE LLC - Product / Service
- MYMOVE LLC - Key offerings
- SWOT
- 14.12 National Storage
- National Storage - Overview
- National Storage - Product / Service
- National Storage - Key offerings
- SWOT
- 14.13 PODS Enterprises LLC
- PODS Enterprises LLC - Overview
- PODS Enterprises LLC - Product / Service
- PODS Enterprises LLC - Key offerings
- SWOT
- 14.14 Public Storage
- Public Storage - Overview
- Public Storage - Business segments
- Public Storage - Key offerings
- Public Storage - Segment focus
- SWOT
- 14.15 Ready Steady Store Ltd.
- Ready Steady Store Ltd. - Overview
- Ready Steady Store Ltd. - Product / Service
- Ready Steady Store Ltd. - Key offerings
- SWOT
- 14.16 Safestore Holdings plc
- Safestore Holdings plc - Overview
- Safestore Holdings plc - Business segments
- Safestore Holdings plc - Key offerings
- Safestore Holdings plc - Segment focus
- SWOT
- 14.17 Schroders plc
- Schroders plc - Overview
- Schroders plc - Product / Service
- Schroders plc - Key offerings
- SWOT
- 14.18 SIRVA Worldwide Inc.
- SIRVA Worldwide Inc. - Overview
- SIRVA Worldwide Inc. - Product / Service
- SIRVA Worldwide Inc. - Key offerings
- SWOT
15 Appendix
- 15.1 Scope of the report
- 15.2 Inclusions and exclusions checklist
- Inclusions checklist
- Exclusions checklist
- 15.3 Currency conversion rates for US$
- Currency conversion rates for US$
- 15.4 Research methodology
- Research methodology
- 15.5 Data procurement
- Information sources
- 15.6 Data validation
- Data validation
- 15.7 Validation techniques employed for market sizing
- Validation techniques employed for market sizing
- 15.8 Data synthesis
- Data synthesis
- 15.9 360 degree market analysis
- 360 degree market analysis
- 15.10 List of abbreviations
- List of abbreviations
