|
|
市場調査レポート
商品コード
1626241
救急車の世界市場 2025-2029年Global Emergency Ambulance Vehicles Market 2025-2029 |
||||||

|
|||||||
カスタマイズ可能
|
|||||||


| 救急車の世界市場 2025-2029年 |
|
出版日: 2024年12月21日
発行: TechNavio
ページ情報: 英文 196 Pages
納期: 即納可能
|

全表示
- 概要
- 図表
- 目次
救急車市場 2025-2029年
救急車市場は2024-2029年に37億3,480万米ドル、予測期間中のCAGRは4.3%で成長すると予測されます。当レポートでは、救急車市場の全体的な分析、市場規模・予測、動向、成長促進要因、課題、約25のベンダーを網羅したベンダー分析などを掲載しています。
現在の市場シナリオ、最新動向と促進要因、市場環境全体に関する最新分析を提供しています。ヘルスケア需要の高まり、交通事故発生件数の増加、高齢化人口の増加などが市場を牽引しています。
| 市場範囲 | |
|---|---|
| 基準年 | 2025 |
| 終了年 | 2029 |
| 予測期間 | 2025-2029 |
| 成長モメンタム | 加速 |
| 前年比2025年 | 2.9% |
| CAGR | 4.3% |
| 増分額 | 37億3,480万米ドル |
本調査では、今後数年間の救急車市場の成長を促進する主な要因の1つとして、ベンダーによる新製品の発売を挙げています。また、電動救急車への移行、カスタマイズや専門化が市場の大きな需要につながります。
目次
第1章 エグゼクティブサマリー
- 市場概要
第2章 Technavio別分析
- 価格・ライフサイクル・顧客購入バスケット・採用率・購入基準の分析
- インプットの重要性と差別化の要因
- 混乱の要因
- 促進要因と課題の影響
第3章 市場情勢
- 市場エコシステム
- 市場の特徴
- バリューチェーン分析
第4章 市場規模
- 市場の定義
- 市場セグメント分析
- 市場規模 2024
- 市場の見通し 2024-2029
第5章 市場規模実績
- 救急車の世界市場 2019-2023
- 車両タイプ別セグメント分析 2019-2023
- タイプ別セグメント分析 2019-2023
- 地域別セグメント分析 2019-2023
- 国別セグメント分析 2019-2023
第6章 定性分析
- AIの影響救急車の世界市場
第7章 ファイブフォース分析
- ファイブフォースの要約
- 買い手の交渉力
- 供給企業の交渉力
- 新規参入業者の脅威
- 代替品の脅威
- 競争の脅威
- 市況
第8章 市場セグメンテーション:車両タイプ別
- 市場セグメント
- 比較:車両タイプ別
- 一次救命処置(BLS):市場規模と予測 2024-2029
- 二次救命処置(ALS):市場規模と予測 2024-2029
- 市場機会:車両タイプ別
第9章 市場セグメンテーション:タイプ別
- 市場セグメント
- 比較:タイプ別
- モジュラーデザイン:市場規模と予測 2024-2029
- モノコックデザイン:市場規模と予測 2024-2029
- 市場機会:タイプ別
第10章 顧客情勢
- 顧客情勢の概要
第11章 地域別情勢
- 地域別セグメンテーション
- 地域別:比較
- 北米:市場規模と予測 2024-2029
- アジア太平洋:市場規模と予測 2024-2029
- 欧州:市場規模と予測 2024-2029
- 中東・アフリカ:市場規模と予測 2024-2029
- 南米:市場規模と予測 2024-2029
- 米国:市場規模と予測 2024-2029
- 中国:市場規模と予測 2024-2029
- ドイツ:市場規模と予測 2024-2029
- インド:市場規模と予測 2024-2029
- 英国:市場規模と予測 2024-2029
- 日本:市場規模と予測 2024-2029
- カナダ:市場規模と予測 2024-2029
- フランス:市場規模と予測 2024-2029
- オーストラリア:市場規模と予測 2024-2029
- ブラジル:市場規模と予測 2024-2029
- 市場機会:地域情勢別
第12章 促進要因・課題・機会・抑制要因
- 市場促進要因
- 市場の課題
- 促進要因と課題の影響
- 市場の機会・抑制要因
第13章 競合情勢
- 概要
- 競合情勢
- 混乱の状況
- 業界のリスク
第14章 競合分析
- 企業プロファイル
- 企業ランキング指数
- 企業の市場ポジショニング
- AmbulanceMed
- Ashok Leyland Ltd.
- Demers Ambulances
- Excellance Inc
- Frazer Ltd
- Infinity Chassis Units
- Lenco Industries Inc.
- Mahindra and Mahindra Ltd.
- Medix Specialty Vehicles LLC
- Mobile Hospital Designers and Developers India Pvt Ltd
- Osage Industries Inc
- REV Group Inc.
- Tata Motors Ltd.
- Wietmarscher Ambulanz und Sonderfahrzeug GmbH
第15章 付録
Exhibits:
- Exhibits1: Executive Summary - Chart on Market Overview
- Exhibits2: Executive Summary - Data Table on Market Overview
- Exhibits3: Executive Summary - Chart on Global Market Characteristics
- Exhibits4: Executive Summary - Chart on Market By Geographical Landscape
- Exhibits5: Executive Summary - Chart on Market Segmentation by Vehicle Type
- Exhibits6: Executive Summary - Chart on Market Segmentation by Type
- Exhibits7: Executive Summary - Chart on Incremental Growth
- Exhibits8: Executive Summary - Data Table on Incremental Growth
- Exhibits9: Executive Summary - Chart on Company Market Positioning
- Exhibits10: Analysis of price sensitivity, lifecycle, customer purchase basket, adoption rates, and purchase criteria
- Exhibits11: Overview on criticality of inputs and factors of differentiation
- Exhibits12: Overview on factors of disruption
- Exhibits13: Impact of drivers and challenges in 2024 and 2029
- Exhibits14: Parent Market
- Exhibits15: Data Table on - Parent Market
- Exhibits16: Market characteristics analysis
- Exhibits17: Value chain analysis
- Exhibits18: Offerings of companies included in the market definition
- Exhibits19: Market segments
- Exhibits20: Chart on Global - Market size and forecast 2024-2029 ($ million)
- Exhibits21: Data Table on Global - Market size and forecast 2024-2029 ($ million)
- Exhibits22: Chart on Global Market: Year-over-year growth 2024-2029 (%)
- Exhibits23: Data Table on Global Market: Year-over-year growth 2024-2029 (%)
- Exhibits24: Historic Market Size - Data Table on Global Emergency Ambulance Vehicles Market 2019 - 2023 ($ million)
- Exhibits25: Historic Market Size - Vehicle Type Segment 2019 - 2023 ($ million)
- Exhibits26: Historic Market Size - Type Segment 2019 - 2023 ($ million)
- Exhibits27: Historic Market Size - Geography Segment 2019 - 2023 ($ million)
- Exhibits28: Historic Market Size - Country Segment 2019 - 2023 ($ million)
- Exhibits29: Five forces analysis - Comparison between 2024 and 2029
- Exhibits30: Bargaining power of buyers - Impact of key factors 2024 and 2029
- Exhibits31: Bargaining power of suppliers - Impact of key factors in 2024 and 2029
- Exhibits32: Threat of new entrants - Impact of key factors in 2024 and 2029
- Exhibits33: Threat of substitutes - Impact of key factors in 2024 and 2029
- Exhibits34: Threat of rivalry - Impact of key factors in 2024 and 2029
- Exhibits35: Chart on Market condition - Five forces 2024 and 2029
- Exhibits36: Chart on Vehicle Type - Market share 2024-2029 (%)
- Exhibits37: Data Table on Vehicle Type - Market share 2024-2029 (%)
- Exhibits38: Chart on Comparison by Vehicle Type
- Exhibits39: Data Table on Comparison by Vehicle Type
- Exhibits40: Chart on Basic life support (BLS) - Market size and forecast 2024-2029 ($ million)
- Exhibits41: Data Table on Basic life support (BLS) - Market size and forecast 2024-2029 ($ million)
- Exhibits42: Chart on Basic life support (BLS) - Year-over-year growth 2024-2029 (%)
- Exhibits43: Data Table on Basic life support (BLS) - Year-over-year growth 2024-2029 (%)
- Exhibits44: Chart on Advanced life support (ALS) - Market size and forecast 2024-2029 ($ million)
- Exhibits45: Data Table on Advanced life support (ALS) - Market size and forecast 2024-2029 ($ million)
- Exhibits46: Chart on Advanced life support (ALS) - Year-over-year growth 2024-2029 (%)
- Exhibits47: Data Table on Advanced life support (ALS) - Year-over-year growth 2024-2029 (%)
- Exhibits48: Market opportunity by Vehicle Type ($ million)
- Exhibits49: Data Table on Market opportunity by Vehicle Type ($ million)
- Exhibits50: Chart on Type - Market share 2024-2029 (%)
- Exhibits51: Data Table on Type - Market share 2024-2029 (%)
- Exhibits52: Chart on Comparison by Type
- Exhibits53: Data Table on Comparison by Type
- Exhibits54: Chart on Modular design - Market size and forecast 2024-2029 ($ million)
- Exhibits55: Data Table on Modular design - Market size and forecast 2024-2029 ($ million)
- Exhibits56: Chart on Modular design - Year-over-year growth 2024-2029 (%)
- Exhibits57: Data Table on Modular design - Year-over-year growth 2024-2029 (%)
- Exhibits58: Chart on Monocoque design - Market size and forecast 2024-2029 ($ million)
- Exhibits59: Data Table on Monocoque design - Market size and forecast 2024-2029 ($ million)
- Exhibits60: Chart on Monocoque design - Year-over-year growth 2024-2029 (%)
- Exhibits61: Data Table on Monocoque design - Year-over-year growth 2024-2029 (%)
- Exhibits62: Market opportunity by Type ($ million)
- Exhibits63: Data Table on Market opportunity by Type ($ million)
- Exhibits64: Analysis of price sensitivity, lifecycle, customer purchase basket, adoption rates, and purchase criteria
- Exhibits65: Chart on Market share By Geographical Landscape 2024-2029 (%)
- Exhibits66: Data Table on Market share By Geographical Landscape 2024-2029 (%)
- Exhibits67: Chart on Geographic comparison
- Exhibits68: Data Table on Geographic comparison
- Exhibits69: Chart on North America - Market size and forecast 2024-2029 ($ million)
- Exhibits70: Data Table on North America - Market size and forecast 2024-2029 ($ million)
- Exhibits71: Chart on North America - Year-over-year growth 2024-2029 (%)
- Exhibits72: Data Table on North America - Year-over-year growth 2024-2029 (%)
- Exhibits73: Chart on APAC - Market size and forecast 2024-2029 ($ million)
- Exhibits74: Data Table on APAC - Market size and forecast 2024-2029 ($ million)
- Exhibits75: Chart on APAC - Year-over-year growth 2024-2029 (%)
- Exhibits76: Data Table on APAC - Year-over-year growth 2024-2029 (%)
- Exhibits77: Chart on Europe - Market size and forecast 2024-2029 ($ million)
- Exhibits78: Data Table on Europe - Market size and forecast 2024-2029 ($ million)
- Exhibits79: Chart on Europe - Year-over-year growth 2024-2029 (%)
- Exhibits80: Data Table on Europe - Year-over-year growth 2024-2029 (%)
- Exhibits81: Chart on Middle East and Africa - Market size and forecast 2024-2029 ($ million)
- Exhibits82: Data Table on Middle East and Africa - Market size and forecast 2024-2029 ($ million)
- Exhibits83: Chart on Middle East and Africa - Year-over-year growth 2024-2029 (%)
- Exhibits84: Data Table on Middle East and Africa - Year-over-year growth 2024-2029 (%)
- Exhibits85: Chart on South America - Market size and forecast 2024-2029 ($ million)
- Exhibits86: Data Table on South America - Market size and forecast 2024-2029 ($ million)
- Exhibits87: Chart on South America - Year-over-year growth 2024-2029 (%)
- Exhibits88: Data Table on South America - Year-over-year growth 2024-2029 (%)
- Exhibits89: Chart on US - Market size and forecast 2024-2029 ($ million)
- Exhibits90: Data Table on US - Market size and forecast 2024-2029 ($ million)
- Exhibits91: Chart on US - Year-over-year growth 2024-2029 (%)
- Exhibits92: Data Table on US - Year-over-year growth 2024-2029 (%)
- Exhibits93: Chart on China - Market size and forecast 2024-2029 ($ million)
- Exhibits94: Data Table on China - Market size and forecast 2024-2029 ($ million)
- Exhibits95: Chart on China - Year-over-year growth 2024-2029 (%)
- Exhibits96: Data Table on China - Year-over-year growth 2024-2029 (%)
- Exhibits97: Chart on Germany - Market size and forecast 2024-2029 ($ million)
- Exhibits98: Data Table on Germany - Market size and forecast 2024-2029 ($ million)
- Exhibits99: Chart on Germany - Year-over-year growth 2024-2029 (%)
- Exhibits100: Data Table on Germany - Year-over-year growth 2024-2029 (%)
- Exhibits101: Chart on India - Market size and forecast 2024-2029 ($ million)
- Exhibits102: Data Table on India - Market size and forecast 2024-2029 ($ million)
- Exhibits103: Chart on India - Year-over-year growth 2024-2029 (%)
- Exhibits104: Data Table on India - Year-over-year growth 2024-2029 (%)
- Exhibits105: Chart on UK - Market size and forecast 2024-2029 ($ million)
- Exhibits106: Data Table on UK - Market size and forecast 2024-2029 ($ million)
- Exhibits107: Chart on UK - Year-over-year growth 2024-2029 (%)
- Exhibits108: Data Table on UK - Year-over-year growth 2024-2029 (%)
- Exhibits109: Chart on Japan - Market size and forecast 2024-2029 ($ million)
- Exhibits110: Data Table on Japan - Market size and forecast 2024-2029 ($ million)
- Exhibits111: Chart on Japan - Year-over-year growth 2024-2029 (%)
- Exhibits112: Data Table on Japan - Year-over-year growth 2024-2029 (%)
- Exhibits113: Chart on Canada - Market size and forecast 2024-2029 ($ million)
- Exhibits114: Data Table on Canada - Market size and forecast 2024-2029 ($ million)
- Exhibits115: Chart on Canada - Year-over-year growth 2024-2029 (%)
- Exhibits116: Data Table on Canada - Year-over-year growth 2024-2029 (%)
- Exhibits117: Chart on France - Market size and forecast 2024-2029 ($ million)
- Exhibits118: Data Table on France - Market size and forecast 2024-2029 ($ million)
- Exhibits119: Chart on France - Year-over-year growth 2024-2029 (%)
- Exhibits120: Data Table on France - Year-over-year growth 2024-2029 (%)
- Exhibits121: Chart on Australia - Market size and forecast 2024-2029 ($ million)
- Exhibits122: Data Table on Australia - Market size and forecast 2024-2029 ($ million)
- Exhibits123: Chart on Australia - Year-over-year growth 2024-2029 (%)
- Exhibits124: Data Table on Australia - Year-over-year growth 2024-2029 (%)
- Exhibits125: Chart on Brazil - Market size and forecast 2024-2029 ($ million)
- Exhibits126: Data Table on Brazil - Market size and forecast 2024-2029 ($ million)
- Exhibits127: Chart on Brazil - Year-over-year growth 2024-2029 (%)
- Exhibits128: Data Table on Brazil - Year-over-year growth 2024-2029 (%)
- Exhibits129: Market opportunity By Geographical Landscape ($ million)
- Exhibits130: Data Tables on Market opportunity By Geographical Landscape ($ million)
- Exhibits131: Impact of drivers and challenges in 2024 and 2029
- Exhibits132: Overview on criticality of inputs and factors of differentiation
- Exhibits133: Overview on factors of disruption
- Exhibits134: Impact of key risks on business
- Exhibits135: Companies covered
- Exhibits136: Company ranking index
- Exhibits137: Matrix on companies position and classification
- Exhibits138: AmbulanceMed - Overview
- Exhibits139: AmbulanceMed - Product / Service
- Exhibits140: AmbulanceMed - Key offerings
- Exhibits141: SWOT
- Exhibits142: Ashok Leyland Ltd. - Overview
- Exhibits143: Ashok Leyland Ltd. - Product / Service
- Exhibits144: Ashok Leyland Ltd. - Key offerings
- Exhibits145: SWOT
- Exhibits146: Demers Ambulances - Overview
- Exhibits147: Demers Ambulances - Product / Service
- Exhibits148: Demers Ambulances - Key offerings
- Exhibits149: SWOT
- Exhibits150: Excellance Inc - Overview
- Exhibits151: Excellance Inc - Product / Service
- Exhibits152: Excellance Inc - Key offerings
- Exhibits153: SWOT
- Exhibits154: Frazer Ltd - Overview
- Exhibits155: Frazer Ltd - Product / Service
- Exhibits156: Frazer Ltd - Key offerings
- Exhibits157: SWOT
- Exhibits158: Infinity Chassis Units - Overview
- Exhibits159: Infinity Chassis Units - Product / Service
- Exhibits160: Infinity Chassis Units - Key offerings
- Exhibits161: SWOT
- Exhibits162: Lenco Industries Inc. - Overview
- Exhibits163: Lenco Industries Inc. - Product / Service
- Exhibits164: Lenco Industries Inc. - Key offerings
- Exhibits165: SWOT
- Exhibits166: Mahindra and Mahindra Ltd. - Overview
- Exhibits167: Mahindra and Mahindra Ltd. - Business segments
- Exhibits168: Mahindra and Mahindra Ltd. - Key news
- Exhibits169: Mahindra and Mahindra Ltd. - Key offerings
- Exhibits170: Mahindra and Mahindra Ltd. - Segment focus
- Exhibits171: SWOT
- Exhibits172: Medix Specialty Vehicles LLC - Overview
- Exhibits173: Medix Specialty Vehicles LLC - Product / Service
- Exhibits174: Medix Specialty Vehicles LLC - Key offerings
- Exhibits175: SWOT
- Exhibits176: Mobile Hospital Designers and Developers India Pvt Ltd - Overview
- Exhibits177: Mobile Hospital Designers and Developers India Pvt Ltd - Product / Service
- Exhibits178: Mobile Hospital Designers and Developers India Pvt Ltd - Key offerings
- Exhibits179: SWOT
- Exhibits180: Osage Industries Inc - Overview
- Exhibits181: Osage Industries Inc - Product / Service
- Exhibits182: Osage Industries Inc - Key offerings
- Exhibits183: SWOT
- Exhibits184: REV Group Inc. - Overview
- Exhibits185: REV Group Inc. - Business segments
- Exhibits186: REV Group Inc. - Key offerings
- Exhibits187: REV Group Inc. - Segment focus
- Exhibits188: SWOT
- Exhibits189: Tata Motors Ltd. - Overview
- Exhibits190: Tata Motors Ltd. - Business segments
- Exhibits191: Tata Motors Ltd. - Key news
- Exhibits192: Tata Motors Ltd. - Key offerings
- Exhibits193: Tata Motors Ltd. - Segment focus
- Exhibits194: SWOT
- Exhibits195: Wietmarscher Ambulanz und Sonderfahrzeug GmbH - Overview
- Exhibits196: Wietmarscher Ambulanz und Sonderfahrzeug GmbH - Product / Service
- Exhibits197: Wietmarscher Ambulanz und Sonderfahrzeug GmbH - Key offerings
- Exhibits198: SWOT
- Exhibits199: Inclusions checklist
- Exhibits200: Exclusions checklist
- Exhibits201: Currency conversion rates for US$
- Exhibits202: Research methodology
- Exhibits203: Information sources
- Exhibits204: Data validation
- Exhibits205: Validation techniques employed for market sizing
- Exhibits206: Data synthesis
- Exhibits207: 360 degree market analysis
- Exhibits208: List of abbreviations
Emergency Ambulance Vehicles Market 2025-2029
The emergency ambulance vehicles market is forecasted to grow by USD 3734.8 mn during 2024-2029, accelerating at a CAGR of 4.3% during the forecast period. The report on the emergency ambulance vehicles market provides a holistic analysis, market size and forecast, trends, growth drivers, and challenges, as well as vendor analysis covering around 25 vendors.
The report offers an up-to-date analysis regarding the current market scenario, the latest trends and drivers, and the overall market environment. The market is driven by rising healthcare demands, increase in road accident incidents, and growth in aging population.
| Market Scope | |
|---|---|
| Base Year | 2025 |
| End Year | 2029 |
| Series Year | 2025-2029 |
| Growth Momentum | Accelerate |
| YOY 2025 | 2.9% |
| CAGR | 4.3% |
| Incremental Value | $3734.8 mn |
Technavio's emergency ambulance vehicles market is segmented as below:
By Vehicle Type
- Basic life support (BLS)
- Advanced life support (ALS)
By Type
- Modular design
- Monocoque design
By Geographical Landscape
- North America
- APAC
- Europe
- Middle East and Africa
- South America
This study identifies the new product launches by vendors as one of the prime reasons driving the emergency ambulance vehicles market growth during the next few years. Also, transition to electric ambulances and customization and specialization will lead to sizable demand in the market.
The report on the emergency ambulance vehicles market covers the following areas:
- Emergency Ambulance Vehicles Market sizing
- Emergency Ambulance Vehicles Market forecast
- Emergency Ambulance Vehicles Market industry analysis
The robust vendor analysis is designed to help clients improve their market position, and in line with this, this report provides a detailed analysis of several leading emergency ambulance vehicles market vendors that include AmbulanceMed, Ashok Leyland Ltd., Demers Ambulances, Excellance Inc, Frazer Ltd, Infinity Chassis Units, Lenco Industries Inc., Mahindra and Mahindra Ltd., Medix Specialty Vehicles LLC, Mobile Hospital Designers and Developers India Pvt Ltd, Osage Industries Inc, REV Group Inc., Tata Motors Ltd., and Wietmarscher Ambulanz und Sonderfahrzeug GmbH. Also, the emergency ambulance vehicles market analysis report includes information on upcoming trends and challenges that will influence market growth. This is to help companies strategize and leverage all forthcoming growth opportunities.
The study was conducted using an objective combination of primary and secondary information including inputs from key participants in the industry. The report contains a comprehensive market and vendor landscape in addition to an analysis of the key vendors.
The publisher presents a detailed picture of the market by the way of study, synthesis, and summation of data from multiple sources by an analysis of key parameters such as profit, pricing, competition, and promotions. It presents various market facets by identifying the key industry influencers. The data presented is comprehensive, reliable, and a result of extensive primary and secondary research. The market research reports provide a complete competitive landscape and an in-depth vendor selection methodology and analysis using qualitative and quantitative research to forecast accurate market growth.
Table of Contents
1 Executive Summary
- 1.1 Market overview
- Executive Summary - Chart on Market Overview
- Executive Summary - Data Table on Market Overview
- Executive Summary - Chart on Global Market Characteristics
- Executive Summary - Chart on Market By Geographical Landscape
- Executive Summary - Chart on Market Segmentation by Vehicle Type
- Executive Summary - Chart on Market Segmentation by Type
- Executive Summary - Chart on Incremental Growth
- Executive Summary - Data Table on Incremental Growth
- Executive Summary - Chart on Company Market Positioning
2 Technavio Analysis
- 2.1 Analysis of price sensitivity, lifecycle, customer purchase basket, adoption rates, and purchase criteria
- Analysis of price sensitivity, lifecycle, customer purchase basket, adoption rates, and purchase criteria
- 2.2 Criticality of inputs and Factors of differentiation
- Overview on criticality of inputs and factors of differentiation
- 2.3 Factors of disruption
- Overview on factors of disruption
- 2.4 Impact of drivers and challenges
- Impact of drivers and challenges in 2024 and 2029
3 Market Landscape
- 3.1 Market ecosystem
- Parent Market
- Data Table on - Parent Market
- 3.2 Market characteristics
- Market characteristics analysis
- 3.3 Value chain analysis
- Value chain analysis
4 Market Sizing
- 4.1 Market definition
- Offerings of companies included in the market definition
- 4.2 Market segment analysis
- Market segments
- 4.3 Market size 2024
- 4.4 Market outlook: Forecast for 2024-2029
- Chart on Global - Market size and forecast 2024-2029 ($ million)
- Data Table on Global - Market size and forecast 2024-2029 ($ million)
- Chart on Global Market: Year-over-year growth 2024-2029 (%)
- Data Table on Global Market: Year-over-year growth 2024-2029 (%)
5 Historic Market Size
- 5.1 Global Emergency Ambulance Vehicles Market 2019 - 2023
- Historic Market Size - Data Table on Global Emergency Ambulance Vehicles Market 2019 - 2023 ($ million)
- 5.2 Vehicle Type segment analysis 2019 - 2023
- Historic Market Size - Vehicle Type Segment 2019 - 2023 ($ million)
- 5.3 Type segment analysis 2019 - 2023
- Historic Market Size - Type Segment 2019 - 2023 ($ million)
- 5.4 Geography segment analysis 2019 - 2023
- Historic Market Size - Geography Segment 2019 - 2023 ($ million)
- 5.5 Country segment analysis 2019 - 2023
- Historic Market Size - Country Segment 2019 - 2023 ($ million)
6 Qualitative Analysis
- 6.1 Impact of AI in the Global Emergency Ambulance Vehicles Market
7 Five Forces Analysis
- 7.1 Five forces summary
- Five forces analysis - Comparison between 2024 and 2029
- 7.2 Bargaining power of buyers
- Bargaining power of buyers - Impact of key factors 2024 and 2029
- 7.3 Bargaining power of suppliers
- Bargaining power of suppliers - Impact of key factors in 2024 and 2029
- 7.4 Threat of new entrants
- Threat of new entrants - Impact of key factors in 2024 and 2029
- 7.5 Threat of substitutes
- Threat of substitutes - Impact of key factors in 2024 and 2029
- 7.6 Threat of rivalry
- Threat of rivalry - Impact of key factors in 2024 and 2029
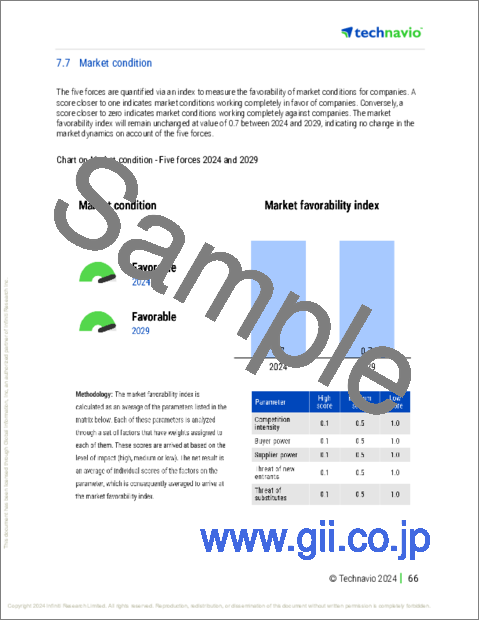
- 7.7 Market condition
- Chart on Market condition - Five forces 2024 and 2029
8 Market Segmentation by Vehicle Type
- 8.1 Market segments
- Chart on Vehicle Type - Market share 2024-2029 (%)
- Data Table on Vehicle Type - Market share 2024-2029 (%)
- 8.2 Comparison by Vehicle Type
- Chart on Comparison by Vehicle Type
- Data Table on Comparison by Vehicle Type
- 8.3 Basic life support (BLS) - Market size and forecast 2024-2029
- Chart on Basic life support (BLS) - Market size and forecast 2024-2029 ($ million)
- Data Table on Basic life support (BLS) - Market size and forecast 2024-2029 ($ million)
- Chart on Basic life support (BLS) - Year-over-year growth 2024-2029 (%)
- Data Table on Basic life support (BLS) - Year-over-year growth 2024-2029 (%)
- 8.4 Advanced life support (ALS) - Market size and forecast 2024-2029
- Chart on Advanced life support (ALS) - Market size and forecast 2024-2029 ($ million)
- Data Table on Advanced life support (ALS) - Market size and forecast 2024-2029 ($ million)
- Chart on Advanced life support (ALS) - Year-over-year growth 2024-2029 (%)
- Data Table on Advanced life support (ALS) - Year-over-year growth 2024-2029 (%)
- 8.5 Market opportunity by Vehicle Type
- Market opportunity by Vehicle Type ($ million)
- Data Table on Market opportunity by Vehicle Type ($ million)
9 Market Segmentation by Type
- 9.1 Market segments
- Chart on Type - Market share 2024-2029 (%)
- Data Table on Type - Market share 2024-2029 (%)
- 9.2 Comparison by Type
- Chart on Comparison by Type
- Data Table on Comparison by Type
- 9.3 Modular design - Market size and forecast 2024-2029
- Chart on Modular design - Market size and forecast 2024-2029 ($ million)
- Data Table on Modular design - Market size and forecast 2024-2029 ($ million)
- Chart on Modular design - Year-over-year growth 2024-2029 (%)
- Data Table on Modular design - Year-over-year growth 2024-2029 (%)
- 9.4 Monocoque design - Market size and forecast 2024-2029
- Chart on Monocoque design - Market size and forecast 2024-2029 ($ million)
- Data Table on Monocoque design - Market size and forecast 2024-2029 ($ million)
- Chart on Monocoque design - Year-over-year growth 2024-2029 (%)
- Data Table on Monocoque design - Year-over-year growth 2024-2029 (%)
- 9.5 Market opportunity by Type
- Market opportunity by Type ($ million)
- Data Table on Market opportunity by Type ($ million)
10 Customer Landscape
- 10.1 Customer landscape overview
- Analysis of price sensitivity, lifecycle, customer purchase basket, adoption rates, and purchase criteria
11 Geographic Landscape
- 11.1 Geographic segmentation
- Chart on Market share By Geographical Landscape 2024-2029 (%)
- Data Table on Market share By Geographical Landscape 2024-2029 (%)
- 11.2 Geographic comparison
- Chart on Geographic comparison
- Data Table on Geographic comparison
- 11.3 North America - Market size and forecast 2024-2029
- Chart on North America - Market size and forecast 2024-2029 ($ million)
- Data Table on North America - Market size and forecast 2024-2029 ($ million)
- Chart on North America - Year-over-year growth 2024-2029 (%)
- Data Table on North America - Year-over-year growth 2024-2029 (%)
- 11.4 APAC - Market size and forecast 2024-2029
- Chart on APAC - Market size and forecast 2024-2029 ($ million)
- Data Table on APAC - Market size and forecast 2024-2029 ($ million)
- Chart on APAC - Year-over-year growth 2024-2029 (%)
- Data Table on APAC - Year-over-year growth 2024-2029 (%)
- 11.5 Europe - Market size and forecast 2024-2029
- Chart on Europe - Market size and forecast 2024-2029 ($ million)
- Data Table on Europe - Market size and forecast 2024-2029 ($ million)
- Chart on Europe - Year-over-year growth 2024-2029 (%)
- Data Table on Europe - Year-over-year growth 2024-2029 (%)
- 11.6 Middle East and Africa - Market size and forecast 2024-2029
- Chart on Middle East and Africa - Market size and forecast 2024-2029 ($ million)
- Data Table on Middle East and Africa - Market size and forecast 2024-2029 ($ million)
- Chart on Middle East and Africa - Year-over-year growth 2024-2029 (%)
- Data Table on Middle East and Africa - Year-over-year growth 2024-2029 (%)
- 11.7 South America - Market size and forecast 2024-2029
- Chart on South America - Market size and forecast 2024-2029 ($ million)
- Data Table on South America - Market size and forecast 2024-2029 ($ million)
- Chart on South America - Year-over-year growth 2024-2029 (%)
- Data Table on South America - Year-over-year growth 2024-2029 (%)
- 11.8 US - Market size and forecast 2024-2029
- Chart on US - Market size and forecast 2024-2029 ($ million)
- Data Table on US - Market size and forecast 2024-2029 ($ million)
- Chart on US - Year-over-year growth 2024-2029 (%)
- Data Table on US - Year-over-year growth 2024-2029 (%)
- 11.9 China - Market size and forecast 2024-2029
- Chart on China - Market size and forecast 2024-2029 ($ million)
- Data Table on China - Market size and forecast 2024-2029 ($ million)
- Chart on China - Year-over-year growth 2024-2029 (%)
- Data Table on China - Year-over-year growth 2024-2029 (%)
- 11.10 Germany - Market size and forecast 2024-2029
- Chart on Germany - Market size and forecast 2024-2029 ($ million)
- Data Table on Germany - Market size and forecast 2024-2029 ($ million)
- Chart on Germany - Year-over-year growth 2024-2029 (%)
- Data Table on Germany - Year-over-year growth 2024-2029 (%)
- 11.11 India - Market size and forecast 2024-2029
- Chart on India - Market size and forecast 2024-2029 ($ million)
- Data Table on India - Market size and forecast 2024-2029 ($ million)
- Chart on India - Year-over-year growth 2024-2029 (%)
- Data Table on India - Year-over-year growth 2024-2029 (%)
- 11.12 UK - Market size and forecast 2024-2029
- Chart on UK - Market size and forecast 2024-2029 ($ million)
- Data Table on UK - Market size and forecast 2024-2029 ($ million)
- Chart on UK - Year-over-year growth 2024-2029 (%)
- Data Table on UK - Year-over-year growth 2024-2029 (%)
- 11.13 Japan - Market size and forecast 2024-2029
- Chart on Japan - Market size and forecast 2024-2029 ($ million)
- Data Table on Japan - Market size and forecast 2024-2029 ($ million)
- Chart on Japan - Year-over-year growth 2024-2029 (%)
- Data Table on Japan - Year-over-year growth 2024-2029 (%)
- 11.14 Canada - Market size and forecast 2024-2029
- Chart on Canada - Market size and forecast 2024-2029 ($ million)
- Data Table on Canada - Market size and forecast 2024-2029 ($ million)
- Chart on Canada - Year-over-year growth 2024-2029 (%)
- Data Table on Canada - Year-over-year growth 2024-2029 (%)
- 11.15 France - Market size and forecast 2024-2029
- Chart on France - Market size and forecast 2024-2029 ($ million)
- Data Table on France - Market size and forecast 2024-2029 ($ million)
- Chart on France - Year-over-year growth 2024-2029 (%)
- Data Table on France - Year-over-year growth 2024-2029 (%)
- 11.16 Australia - Market size and forecast 2024-2029
- Chart on Australia - Market size and forecast 2024-2029 ($ million)
- Data Table on Australia - Market size and forecast 2024-2029 ($ million)
- Chart on Australia - Year-over-year growth 2024-2029 (%)
- Data Table on Australia - Year-over-year growth 2024-2029 (%)
- 11.17 Brazil - Market size and forecast 2024-2029
- Chart on Brazil - Market size and forecast 2024-2029 ($ million)
- Data Table on Brazil - Market size and forecast 2024-2029 ($ million)
- Chart on Brazil - Year-over-year growth 2024-2029 (%)
- Data Table on Brazil - Year-over-year growth 2024-2029 (%)
- 11.18 Market opportunity By Geographical Landscape
- Market opportunity By Geographical Landscape ($ million)
- Data Tables on Market opportunity By Geographical Landscape ($ million)
12 Drivers, Challenges, and Opportunity/Restraints
- 12.1 Market drivers
- 12.2 Market challenges
- 12.3 Impact of drivers and challenges
- Impact of drivers and challenges in 2024 and 2029
- 12.4 Market opportunities/restraints
13 Competitive Landscape
- 13.1 Overview
- 13.2 Competitive Landscape
- Overview on criticality of inputs and factors of differentiation
- 13.3 Landscape disruption
- Overview on factors of disruption
- 13.4 Industry risks
- Impact of key risks on business
14 Competitive Analysis
- 14.1 Companies profiled
- Companies covered
- 14.2 Company ranking index
- Company ranking index
- 14.3 Market positioning of companies
- Matrix on companies position and classification
- 14.4 AmbulanceMed
- AmbulanceMed - Overview
- AmbulanceMed - Product / Service
- AmbulanceMed - Key offerings
- SWOT
- 14.5 Ashok Leyland Ltd.
- Ashok Leyland Ltd. - Overview
- Ashok Leyland Ltd. - Product / Service
- Ashok Leyland Ltd. - Key offerings
- SWOT
- 14.6 Demers Ambulances
- Demers Ambulances - Overview
- Demers Ambulances - Product / Service
- Demers Ambulances - Key offerings
- SWOT
- 14.7 Excellance Inc
- Excellance Inc - Overview
- Excellance Inc - Product / Service
- Excellance Inc - Key offerings
- SWOT
- 14.8 Frazer Ltd
- Frazer Ltd - Overview
- Frazer Ltd - Product / Service
- Frazer Ltd - Key offerings
- SWOT
- 14.9 Infinity Chassis Units
- Infinity Chassis Units - Overview
- Infinity Chassis Units - Product / Service
- Infinity Chassis Units - Key offerings
- SWOT
- 14.10 Lenco Industries Inc.
- Lenco Industries Inc. - Overview
- Lenco Industries Inc. - Product / Service
- Lenco Industries Inc. - Key offerings
- SWOT
- 14.11 Mahindra and Mahindra Ltd.
- Mahindra and Mahindra Ltd. - Overview
- Mahindra and Mahindra Ltd. - Business segments
- Mahindra and Mahindra Ltd. - Key news
- Mahindra and Mahindra Ltd. - Key offerings
- Mahindra and Mahindra Ltd. - Segment focus
- SWOT
- 14.12 Medix Specialty Vehicles LLC
- Medix Specialty Vehicles LLC - Overview
- Medix Specialty Vehicles LLC - Product / Service
- Medix Specialty Vehicles LLC - Key offerings
- SWOT
- 14.13 Mobile Hospital Designers and Developers India Pvt Ltd
- Mobile Hospital Designers and Developers India Pvt Ltd - Overview
- Mobile Hospital Designers and Developers India Pvt Ltd - Product / Service
- Mobile Hospital Designers and Developers India Pvt Ltd - Key offerings
- SWOT
- 14.14 Osage Industries Inc
- Osage Industries Inc - Overview
- Osage Industries Inc - Product / Service
- Osage Industries Inc - Key offerings
- SWOT
- 14.15 REV Group Inc.
- REV Group Inc. - Overview
- REV Group Inc. - Business segments
- REV Group Inc. - Key offerings
- REV Group Inc. - Segment focus
- SWOT
- 14.16 Tata Motors Ltd.
- Tata Motors Ltd. - Overview
- Tata Motors Ltd. - Business segments
- Tata Motors Ltd. - Key news
- Tata Motors Ltd. - Key offerings
- Tata Motors Ltd. - Segment focus
- SWOT
- 14.17 Wietmarscher Ambulanz und Sonderfahrzeug GmbH
- Wietmarscher Ambulanz und Sonderfahrzeug GmbH - Overview
- Wietmarscher Ambulanz und Sonderfahrzeug GmbH - Product / Service
- Wietmarscher Ambulanz und Sonderfahrzeug GmbH - Key offerings
- SWOT
15 Appendix
- 15.1 Scope of the report
- 15.2 Inclusions and exclusions checklist
- Inclusions checklist
- Exclusions checklist
- 15.3 Currency conversion rates for US$
- Currency conversion rates for US$
- 15.4 Research methodology
- Research methodology
- 15.5 Data procurement
- Information sources
- 15.6 Data validation
- Data validation
- 15.7 Validation techniques employed for market sizing
- Validation techniques employed for market sizing
- 15.8 Data synthesis
- Data synthesis
- 15.9 360 degree market analysis
- 360 degree market analysis
- 15.10 List of abbreviations
- List of abbreviations
- o Wide variety of products
- o Efficient operational processes
- o Scope for greater market penetration
- o Strong market position
- o Stable market performance
- o Strong infrastructure base
- o Growing demand for the market
- o Efficient operational processes
- o Stable market performance
- o Strong infrastructure base
- o Wide variety of products
- o Growing demand for the market
- o Efficient operational processes
- o Stable market performance
- o Enhancement of alliances and partnerships
- o Strong market position
- o Enhancement of alliances and partnerships
- o Strong market position
- o Growing demand for the market
- o Efficient operational processes
