|
|
市場調査レポート
商品コード
1625966
自閉スペクトラム症の世界市場 (2025~2029年)Global Autism Spectrum Disorder Market 2025-2029 |
||||||

|
|||||||
カスタマイズ可能
|
|||||||


| 自閉スペクトラム症の世界市場 (2025~2029年) |
|
出版日: 2024年11月28日
発行: TechNavio
ページ情報: 英文 192 Pages
納期: 即納可能
|

全表示
- 概要
- 図表
- 目次
自閉スペクトラム症市場 (2025~2029年)
自閉スペクトラム症市場は2024年から2029年に34億3,600万米ドル分拡大し、予測期間中に7.6%のCAGRで成長すると予測されます。当レポートでは、自閉スペクトラム症市場の全体的な分析、市場規模・予測、動向、成長促進要因、課題、約25社のベンダーを網羅したベンダー分析などを掲載しています。
当レポートでは、現在の市場シナリオ、最新動向と促進要因、市場環境全体に関する最新分析を提供しています。この市場は、自閉症の増加、企業合併・買収 (M&A)、政府の取り組みによって牽引されています。
| 市場範囲 | |
|---|---|
| 基準年 | 2025年 |
| 終了年 | 2029年 |
| 予測期間 | 2025~2029年 |
| 成長モメンタム | 加速 |
| 前年比 (2025年) | 7.3% |
| CAGR | 7.6% |
| 増分額 | 34億3,600万米ドル |
当レポートでは、今後数年間における自閉スペクトラム症市場の成長を促進する主な理由の1つとして、パートナーシップとコラボレーションを挙げています。また、ASD治療における資金調達の増加や新技術の統合は、市場の大きな需要につながります。
目次
第1章 エグゼクティブサマリー
- 市場概要
第2章 Technavioによる分析
- 価格感応度・ライフサイクル・顧客購入バスケット・採用率・購入基準の分析
- インプットの重要性と差別化の要因
- 混乱の要因
- 促進要因と課題の影響
第3章 市場情勢
- 市場エコシステム
- 市場の特徴
- バリューチェーン分析
第4章 市場規模の評価
- 市場の定義
- 市場セグメント分析
- 市場規模 (2024年)
- 市場の見通し (2024~2029年)
第5章 市場規模実績
- 世界の自閉スペクトラム症市場 (2019~2023年)
- 種類別分析 (2019~2023年)
- 年齢層別分析 (2019~2023年)
- 地域別分析 (2019~2023年)
- 国別分析 (2019~2023年)
第6章 定性分析
- AIの影響:世界の自閉スペクトラム症市場
第7章 ファイブフォース分析
- ファイブフォースの要約
- 買い手の交渉力
- 供給企業の交渉力
- 新規参入業者の脅威
- 代替品の脅威
- 競争の脅威
- 市況
第8章 市場区分:種類別
- 市場区分
- 比較:種類別
- 非薬物療法:市場規模と予測 (2024~2029年)
- 薬物療法:市場規模と予測 (2024~2029年)
- 市場機会:種類別
第9章 市場区分:年齢層別
- 市場区分
- 比較:年齢層別
- 小児:市場規模と予測 (2024~2029年)
- 成人:市場規模と予測 (2024~2029年)
- 市場機会:年齢層別
第10章 顧客情勢
- 顧客情勢の概要
第11章 地域別情勢
- 地域別区分
- 地域別比較
- 北米:市場規模と予測 (2024~2029年)
- 欧州:市場規模と予測 (2024~2029年)
- アジア:市場規模と予測 (2024~2029年)
- 世界のその他の地域:市場規模と予測 (2024~2029年)
- 米国:市場規模と予測 (2024~2029年)
- 英国:市場規模と予測 (2024~2029年)
- ドイツ:市場規模と予測 (2024~2029年)
- フランス:市場規模と予測 (2024~2029年)
- 中国:市場規模と予測 (2024~2029年)
- カナダ:市場規模と予測 (2024~2029年)
- インド:市場規模と予測 (2024~2029年)
- 日本:市場規模と予測 (2024~2029年)
- イタリア:市場規模と予測 (2024~2029年)
- オーストラリア:市場規模と予測 (2024~2029年)
- 市場機会:地域別
第12章 促進要因・課題・機会・抑制要因
- 市場促進要因
- 市場の課題
- 促進要因と課題の影響
- 市場の機会・抑制要因
第13章 競合情勢
- 概要
- 競合情勢
- 混乱の状況
- 業界のリスク
第14章 競合分析
- 企業プロファイル
- 企業ランキング指数
- 企業の市場ポジショニング
- Autism Services Inc.
- AUTISM SPECTRUM CONSULTANTS INC.
- Autism Spectrum Therapies
- Behavior Frontiers
- BlueSprig
- Cadabams Hospitals
- Center for Autism and Related Disorders
- FFL Partners LLC
- Hopebridge LLC
- Ihear
- Johnson and Johnson Inc.
- Magnet ABA Therapy
- Max Healthcare Institute Ltd
- Merck and Co. Inc.
- Novartis AG
第15章 付録
Exhibits:
- Exhibits1: Executive Summary - Chart on Market Overview
- Exhibits2: Executive Summary - Data Table on Market Overview
- Exhibits3: Executive Summary - Chart on Global Market Characteristics
- Exhibits4: Executive Summary - Chart on Market By Geographical Landscape
- Exhibits5: Executive Summary - Chart on Market Segmentation by Type
- Exhibits6: Executive Summary - Chart on Market Segmentation by Age Group
- Exhibits7: Executive Summary - Chart on Incremental Growth
- Exhibits8: Executive Summary - Data Table on Incremental Growth
- Exhibits9: Executive Summary - Chart on Company Market Positioning
- Exhibits10: Analysis of price sensitivity, lifecycle, customer purchase basket, adoption rates, and purchase criteria
- Exhibits11: Overview on criticality of inputs and factors of differentiation
- Exhibits12: Overview on factors of disruption
- Exhibits13: Impact of drivers and challenges in 2024 and 2029
- Exhibits14: Parent Market
- Exhibits15: Data Table on - Parent Market
- Exhibits16: Market characteristics analysis
- Exhibits17: Value chain analysis
- Exhibits18: Offerings of companies included in the market definition
- Exhibits19: Market segments
- Exhibits20: Chart on Global - Market size and forecast 2024-2029 ($ million)
- Exhibits21: Data Table on Global - Market size and forecast 2024-2029 ($ million)
- Exhibits22: Chart on Global Market: Year-over-year growth 2024-2029 (%)
- Exhibits23: Data Table on Global Market: Year-over-year growth 2024-2029 (%)
- Exhibits24: Historic Market Size - Data Table on Global Autism Spectrum Disorder Market 2019 - 2023 ($ million)
- Exhibits25: Historic Market Size - Type Segment 2019 - 2023 ($ million)
- Exhibits26: Historic Market Size - Age Group Segment 2019 - 2023 ($ million)
- Exhibits27: Historic Market Size - Geography Segment 2019 - 2023 ($ million)
- Exhibits28: Historic Market Size - Country Segment 2019 - 2023 ($ million)
- Exhibits29: Five forces analysis - Comparison between 2024 and 2029
- Exhibits30: Bargaining power of buyers - Impact of key factors 2024 and 2029
- Exhibits31: Bargaining power of suppliers - Impact of key factors in 2024 and 2029
- Exhibits32: Threat of new entrants - Impact of key factors in 2024 and 2029
- Exhibits33: Threat of substitutes - Impact of key factors in 2024 and 2029
- Exhibits34: Threat of rivalry - Impact of key factors in 2024 and 2029
- Exhibits35: Chart on Market condition - Five forces 2024 and 2029
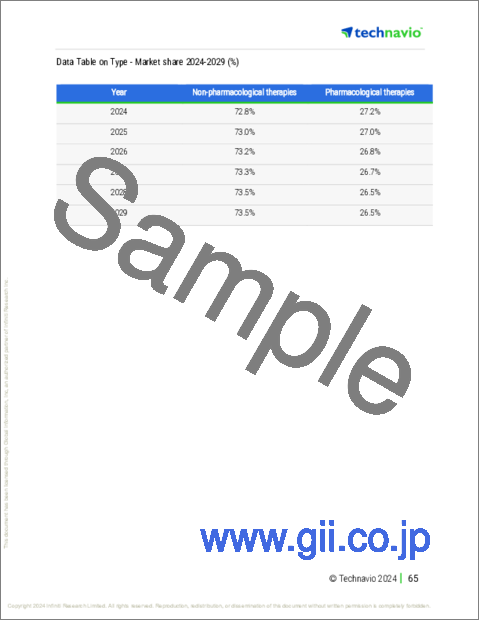
- Exhibits36: Chart on Type - Market share 2024-2029 (%)
- Exhibits37: Data Table on Type - Market share 2024-2029 (%)
- Exhibits38: Chart on Comparison by Type
- Exhibits39: Data Table on Comparison by Type
- Exhibits40: Chart on Non-pharmacological therapies - Market size and forecast 2024-2029 ($ million)
- Exhibits41: Data Table on Non-pharmacological therapies - Market size and forecast 2024-2029 ($ million)
- Exhibits42: Chart on Non-pharmacological therapies - Year-over-year growth 2024-2029 (%)
- Exhibits43: Data Table on Non-pharmacological therapies - Year-over-year growth 2024-2029 (%)
- Exhibits44: Chart on Pharmacological therapies - Market size and forecast 2024-2029 ($ million)
- Exhibits45: Data Table on Pharmacological therapies - Market size and forecast 2024-2029 ($ million)
- Exhibits46: Chart on Pharmacological therapies - Year-over-year growth 2024-2029 (%)
- Exhibits47: Data Table on Pharmacological therapies - Year-over-year growth 2024-2029 (%)
- Exhibits48: Market opportunity by Type ($ million)
- Exhibits49: Data Table on Market opportunity by Type ($ million)
- Exhibits50: Chart on Age Group - Market share 2024-2029 (%)
- Exhibits51: Data Table on Age Group - Market share 2024-2029 (%)
- Exhibits52: Chart on Comparison by Age Group
- Exhibits53: Data Table on Comparison by Age Group
- Exhibits54: Chart on Pediatric - Market size and forecast 2024-2029 ($ million)
- Exhibits55: Data Table on Pediatric - Market size and forecast 2024-2029 ($ million)
- Exhibits56: Chart on Pediatric - Year-over-year growth 2024-2029 (%)
- Exhibits57: Data Table on Pediatric - Year-over-year growth 2024-2029 (%)
- Exhibits58: Chart on Adult - Market size and forecast 2024-2029 ($ million)
- Exhibits59: Data Table on Adult - Market size and forecast 2024-2029 ($ million)
- Exhibits60: Chart on Adult - Year-over-year growth 2024-2029 (%)
- Exhibits61: Data Table on Adult - Year-over-year growth 2024-2029 (%)
- Exhibits62: Market opportunity by Age Group ($ million)
- Exhibits63: Data Table on Market opportunity by Age Group ($ million)
- Exhibits64: Analysis of price sensitivity, lifecycle, customer purchase basket, adoption rates, and purchase criteria
- Exhibits65: Chart on Market share By Geographical Landscape 2024-2029 (%)
- Exhibits66: Data Table on Market share By Geographical Landscape 2024-2029 (%)
- Exhibits67: Chart on Geographic comparison
- Exhibits68: Data Table on Geographic comparison
- Exhibits69: Chart on North America - Market size and forecast 2024-2029 ($ million)
- Exhibits70: Data Table on North America - Market size and forecast 2024-2029 ($ million)
- Exhibits71: Chart on North America - Year-over-year growth 2024-2029 (%)
- Exhibits72: Data Table on North America - Year-over-year growth 2024-2029 (%)
- Exhibits73: Chart on Europe - Market size and forecast 2024-2029 ($ million)
- Exhibits74: Data Table on Europe - Market size and forecast 2024-2029 ($ million)
- Exhibits75: Chart on Europe - Year-over-year growth 2024-2029 (%)
- Exhibits76: Data Table on Europe - Year-over-year growth 2024-2029 (%)
- Exhibits77: Chart on Asia - Market size and forecast 2024-2029 ($ million)
- Exhibits78: Data Table on Asia - Market size and forecast 2024-2029 ($ million)
- Exhibits79: Chart on Asia - Year-over-year growth 2024-2029 (%)
- Exhibits80: Data Table on Asia - Year-over-year growth 2024-2029 (%)
- Exhibits81: Chart on Rest of World (ROW) - Market size and forecast 2024-2029 ($ million)
- Exhibits82: Data Table on Rest of World (ROW) - Market size and forecast 2024-2029 ($ million)
- Exhibits83: Chart on Rest of World (ROW) - Year-over-year growth 2024-2029 (%)
- Exhibits84: Data Table on Rest of World (ROW) - Year-over-year growth 2024-2029 (%)
- Exhibits85: Chart on US - Market size and forecast 2024-2029 ($ million)
- Exhibits86: Data Table on US - Market size and forecast 2024-2029 ($ million)
- Exhibits87: Chart on US - Year-over-year growth 2024-2029 (%)
- Exhibits88: Data Table on US - Year-over-year growth 2024-2029 (%)
- Exhibits89: Chart on UK - Market size and forecast 2024-2029 ($ million)
- Exhibits90: Data Table on UK - Market size and forecast 2024-2029 ($ million)
- Exhibits91: Chart on UK - Year-over-year growth 2024-2029 (%)
- Exhibits92: Data Table on UK - Year-over-year growth 2024-2029 (%)
- Exhibits93: Chart on Germany - Market size and forecast 2024-2029 ($ million)
- Exhibits94: Data Table on Germany - Market size and forecast 2024-2029 ($ million)
- Exhibits95: Chart on Germany - Year-over-year growth 2024-2029 (%)
- Exhibits96: Data Table on Germany - Year-over-year growth 2024-2029 (%)
- Exhibits97: Chart on France - Market size and forecast 2024-2029 ($ million)
- Exhibits98: Data Table on France - Market size and forecast 2024-2029 ($ million)
- Exhibits99: Chart on France - Year-over-year growth 2024-2029 (%)
- Exhibits100: Data Table on France - Year-over-year growth 2024-2029 (%)
- Exhibits101: Chart on China - Market size and forecast 2024-2029 ($ million)
- Exhibits102: Data Table on China - Market size and forecast 2024-2029 ($ million)
- Exhibits103: Chart on China - Year-over-year growth 2024-2029 (%)
- Exhibits104: Data Table on China - Year-over-year growth 2024-2029 (%)
- Exhibits105: Chart on Canada - Market size and forecast 2024-2029 ($ million)
- Exhibits106: Data Table on Canada - Market size and forecast 2024-2029 ($ million)
- Exhibits107: Chart on Canada - Year-over-year growth 2024-2029 (%)
- Exhibits108: Data Table on Canada - Year-over-year growth 2024-2029 (%)
- Exhibits109: Chart on India - Market size and forecast 2024-2029 ($ million)
- Exhibits110: Data Table on India - Market size and forecast 2024-2029 ($ million)
- Exhibits111: Chart on India - Year-over-year growth 2024-2029 (%)
- Exhibits112: Data Table on India - Year-over-year growth 2024-2029 (%)
- Exhibits113: Chart on Japan - Market size and forecast 2024-2029 ($ million)
- Exhibits114: Data Table on Japan - Market size and forecast 2024-2029 ($ million)
- Exhibits115: Chart on Japan - Year-over-year growth 2024-2029 (%)
- Exhibits116: Data Table on Japan - Year-over-year growth 2024-2029 (%)
- Exhibits117: Chart on Italy - Market size and forecast 2024-2029 ($ million)
- Exhibits118: Data Table on Italy - Market size and forecast 2024-2029 ($ million)
- Exhibits119: Chart on Italy - Year-over-year growth 2024-2029 (%)
- Exhibits120: Data Table on Italy - Year-over-year growth 2024-2029 (%)
- Exhibits121: Chart on Australia - Market size and forecast 2024-2029 ($ million)
- Exhibits122: Data Table on Australia - Market size and forecast 2024-2029 ($ million)
- Exhibits123: Chart on Australia - Year-over-year growth 2024-2029 (%)
- Exhibits124: Data Table on Australia - Year-over-year growth 2024-2029 (%)
- Exhibits125: Market opportunity By Geographical Landscape ($ million)
- Exhibits126: Data Tables on Market opportunity By Geographical Landscape ($ million)
- Exhibits127: Impact of drivers and challenges in 2024 and 2029
- Exhibits128: Overview on criticality of inputs and factors of differentiation
- Exhibits129: Overview on factors of disruption
- Exhibits130: Impact of key risks on business
- Exhibits131: Companies covered
- Exhibits132: Company ranking index
- Exhibits133: Matrix on companies position and classification
- Exhibits134: Autism Services Inc. - Overview
- Exhibits135: Autism Services Inc. - Product / Service
- Exhibits136: Autism Services Inc. - Key offerings
- Exhibits137: SWOT
- Exhibits138: AUTISM SPECTRUM CONSULTANTS INC. - Overview
- Exhibits139: AUTISM SPECTRUM CONSULTANTS INC. - Product / Service
- Exhibits140: AUTISM SPECTRUM CONSULTANTS INC. - Key offerings
- Exhibits141: SWOT
- Exhibits142: Autism Spectrum Therapies - Overview
- Exhibits143: Autism Spectrum Therapies - Product / Service
- Exhibits144: Autism Spectrum Therapies - Key offerings
- Exhibits145: SWOT
- Exhibits146: Behavior Frontiers - Overview
- Exhibits147: Behavior Frontiers - Product / Service
- Exhibits148: Behavior Frontiers - Key offerings
- Exhibits149: SWOT
- Exhibits150: BlueSprig - Overview
- Exhibits151: BlueSprig - Product / Service
- Exhibits152: BlueSprig - Key offerings
- Exhibits153: SWOT
- Exhibits154: Cadabams Hospitals - Overview
- Exhibits155: Cadabams Hospitals - Product / Service
- Exhibits156: Cadabams Hospitals - Key offerings
- Exhibits157: SWOT
- Exhibits158: Center for Autism and Related Disorders - Overview
- Exhibits159: Center for Autism and Related Disorders - Product / Service
- Exhibits160: Center for Autism and Related Disorders - Key offerings
- Exhibits161: SWOT
- Exhibits162: FFL Partners LLC - Overview
- Exhibits163: FFL Partners LLC - Product / Service
- Exhibits164: FFL Partners LLC - Key offerings
- Exhibits165: SWOT
- Exhibits166: Hopebridge LLC - Overview
- Exhibits167: Hopebridge LLC - Product / Service
- Exhibits168: Hopebridge LLC - Key offerings
- Exhibits169: SWOT
- Exhibits170: Ihear - Overview
- Exhibits171: Ihear - Product / Service
- Exhibits172: Ihear - Key offerings
- Exhibits173: SWOT
- Exhibits174: Johnson and Johnson Inc. - Overview
- Exhibits175: Johnson and Johnson Inc. - Business segments
- Exhibits176: Johnson and Johnson Inc. - Key news
- Exhibits177: Johnson and Johnson Inc. - Key offerings
- Exhibits178: Johnson and Johnson Inc. - Segment focus
- Exhibits179: SWOT
- Exhibits180: Magnet ABA Therapy - Overview
- Exhibits181: Magnet ABA Therapy - Product / Service
- Exhibits182: Magnet ABA Therapy - Key offerings
- Exhibits183: SWOT
- Exhibits184: Max Healthcare Institute Ltd - Overview
- Exhibits185: Max Healthcare Institute Ltd - Product / Service
- Exhibits186: Max Healthcare Institute Ltd - Key offerings
- Exhibits187: SWOT
- Exhibits188: Merck and Co. Inc. - Overview
- Exhibits189: Merck and Co. Inc. - Business segments
- Exhibits190: Merck and Co. Inc. - Key news
- Exhibits191: Merck and Co. Inc. - Key offerings
- Exhibits192: Merck and Co. Inc. - Segment focus
- Exhibits193: SWOT
- Exhibits194: Novartis AG - Overview
- Exhibits195: Novartis AG - Business segments
- Exhibits196: Novartis AG - Key news
- Exhibits197: Novartis AG - Key offerings
- Exhibits198: Novartis AG - Segment focus
- Exhibits199: SWOT
- Exhibits200: Inclusions checklist
- Exhibits201: Exclusions checklist
- Exhibits202: Currency conversion rates for US$
- Exhibits203: Research methodology
- Exhibits204: Information sources
- Exhibits205: Data validation
- Exhibits206: Validation techniques employed for market sizing
- Exhibits207: Data synthesis
- Exhibits208: 360 degree market analysis
- Exhibits209: List of abbreviations
Autism Spectrum Disorder Market 2025-2029
The autism spectrum disorder market is forecasted to grow by USD 3436 mn during 2024-2029, accelerating at a CAGR of 7.6% during the forecast period. The report on the autism spectrum disorder market provides a holistic analysis, market size and forecast, trends, growth drivers, and challenges, as well as vendor analysis covering around 25 vendors.
The report offers an up-to-date analysis regarding the current market scenario, the latest trends and drivers, and the overall market environment. The market is driven by increasing prevalence of autism, mergers and acquisitions, and government initiatives.
| Market Scope | |
|---|---|
| Base Year | 2025 |
| End Year | 2029 |
| Series Year | 2025-2029 |
| Growth Momentum | Accelerate |
| YOY 2025 | 7.3% |
| CAGR | 7.6% |
| Incremental Value | $3436 mn |
Technavio's autism spectrum disorder market is segmented as below:
By Type
- Non-pharmacological therapies
- Pharmacological therapies
By Age Group
- Pediatric
- Adult
By Geographical Landscape
- North America
- Europe
- Asia
- Rest of World (ROW)
This study identifies the partnerships and collaborations as one of the prime reasons driving the autism spectrum disorder market growth during the next few years. Also, rise in funding and integration of new technology in asd treatment will lead to sizable demand in the market.
The report on the autism spectrum disorder market covers the following areas:
- Autism Spectrum Disorder Market sizing
- Autism Spectrum Disorder Market forecast
- Autism Spectrum Disorder Market industry analysis
The robust vendor analysis is designed to help clients improve their market position, and in line with this, this report provides a detailed analysis of several leading autism spectrum disorder market vendors that include Autism Services Inc., AUTISM SPECTRUM CONSULTANTS INC., Autism Spectrum Therapies, Behavior Frontiers, BlueSprig, Bristol Myers Squibb Co., Cadabams Hospitals, Center for Autism and Related Disorders, CureMark LLC, FFL Partners LLC, Hopebridge LLC, Ihear, Johnson and Johnson Inc., Magnet ABA Therapy, Max Healthcare Institute Ltd, Merck and Co. Inc., Novartis AG, Otsuka Holdings Co. Ltd., Wellness Hub, and Yamo Pharmaceuticals LLC. Also, the autism spectrum disorder market analysis report includes information on upcoming trends and challenges that will influence market growth. This is to help companies strategize and leverage all forthcoming growth opportunities.
The study was conducted using an objective combination of primary and secondary information including inputs from key participants in the industry. The report contains a comprehensive market and vendor landscape in addition to an analysis of the key vendors.
The publisher presents a detailed picture of the market by the way of study, synthesis, and summation of data from multiple sources by an analysis of key parameters such as profit, pricing, competition, and promotions. It presents various market facets by identifying the key industry influencers. The data presented is comprehensive, reliable, and a result of extensive primary and secondary research. The market research reports provide a complete competitive landscape and an in-depth vendor selection methodology and analysis using qualitative and quantitative research to forecast accurate market growth.
Table of Contents
1 Executive Summary
- 1.1 Market overview
- Executive Summary - Chart on Market Overview
- Executive Summary - Data Table on Market Overview
- Executive Summary - Chart on Global Market Characteristics
- Executive Summary - Chart on Market By Geographical Landscape
- Executive Summary - Chart on Market Segmentation by Type
- Executive Summary - Chart on Market Segmentation by Age Group
- Executive Summary - Chart on Incremental Growth
- Executive Summary - Data Table on Incremental Growth
- Executive Summary - Chart on Company Market Positioning
2 Technavio Analysis
- 2.1 Analysis of price sensitivity, lifecycle, customer purchase basket, adoption rates, and purchase criteria
- Analysis of price sensitivity, lifecycle, customer purchase basket, adoption rates, and purchase criteria
- 2.2 Criticality of inputs and Factors of differentiation
- Overview on criticality of inputs and factors of differentiation
- 2.3 Factors of disruption
- Overview on factors of disruption
- 2.4 Impact of drivers and challenges
- Impact of drivers and challenges in 2024 and 2029
3 Market Landscape
- 3.1 Market ecosystem
- Parent Market
- Data Table on - Parent Market
- 3.2 Market characteristics
- Market characteristics analysis
- 3.3 Value chain analysis
- Value chain analysis
4 Market Sizing
- 4.1 Market definition
- Offerings of companies included in the market definition
- 4.2 Market segment analysis
- Market segments
- 4.3 Market size 2024
- 4.4 Market outlook: Forecast for 2024-2029
- Chart on Global - Market size and forecast 2024-2029 ($ million)
- Data Table on Global - Market size and forecast 2024-2029 ($ million)
- Chart on Global Market: Year-over-year growth 2024-2029 (%)
- Data Table on Global Market: Year-over-year growth 2024-2029 (%)
5 Historic Market Size
- 5.1 Global Autism Spectrum Disorder Market 2019 - 2023
- Historic Market Size - Data Table on Global Autism Spectrum Disorder Market 2019 - 2023 ($ million)
- 5.2 Type segment analysis 2019 - 2023
- Historic Market Size - Type Segment 2019 - 2023 ($ million)
- 5.3 Age Group segment analysis 2019 - 2023
- Historic Market Size - Age Group Segment 2019 - 2023 ($ million)
- 5.4 Geography segment analysis 2019 - 2023
- Historic Market Size - Geography Segment 2019 - 2023 ($ million)
- 5.5 Country segment analysis 2019 - 2023
- Historic Market Size - Country Segment 2019 - 2023 ($ million)
6 Qualitative Analysis
- 6.1 Impact of AI on the global autism spectrum disorder market
7 Five Forces Analysis
- 7.1 Five forces summary
- Five forces analysis - Comparison between 2024 and 2029
- 7.2 Bargaining power of buyers
- Bargaining power of buyers - Impact of key factors 2024 and 2029
- 7.3 Bargaining power of suppliers
- Bargaining power of suppliers - Impact of key factors in 2024 and 2029
- 7.4 Threat of new entrants
- Threat of new entrants - Impact of key factors in 2024 and 2029
- 7.5 Threat of substitutes
- Threat of substitutes - Impact of key factors in 2024 and 2029
- 7.6 Threat of rivalry
- Threat of rivalry - Impact of key factors in 2024 and 2029
- 7.7 Market condition
- Chart on Market condition - Five forces 2024 and 2029
8 Market Segmentation by Type
- 8.1 Market segments
- Chart on Type - Market share 2024-2029 (%)
- Data Table on Type - Market share 2024-2029 (%)
- 8.2 Comparison by Type
- Chart on Comparison by Type
- Data Table on Comparison by Type
- 8.3 Non-pharmacological therapies - Market size and forecast 2024-2029
- Chart on Non-pharmacological therapies - Market size and forecast 2024-2029 ($ million)
- Data Table on Non-pharmacological therapies - Market size and forecast 2024-2029 ($ million)
- Chart on Non-pharmacological therapies - Year-over-year growth 2024-2029 (%)
- Data Table on Non-pharmacological therapies - Year-over-year growth 2024-2029 (%)
- 8.4 Pharmacological therapies - Market size and forecast 2024-2029
- Chart on Pharmacological therapies - Market size and forecast 2024-2029 ($ million)
- Data Table on Pharmacological therapies - Market size and forecast 2024-2029 ($ million)
- Chart on Pharmacological therapies - Year-over-year growth 2024-2029 (%)
- Data Table on Pharmacological therapies - Year-over-year growth 2024-2029 (%)
- 8.5 Market opportunity by Type
- Market opportunity by Type ($ million)
- Data Table on Market opportunity by Type ($ million)
9 Market Segmentation by Age Group
- 9.1 Market segments
- Chart on Age Group - Market share 2024-2029 (%)
- Data Table on Age Group - Market share 2024-2029 (%)
- 9.2 Comparison by Age Group
- Chart on Comparison by Age Group
- Data Table on Comparison by Age Group
- 9.3 Pediatric - Market size and forecast 2024-2029
- Chart on Pediatric - Market size and forecast 2024-2029 ($ million)
- Data Table on Pediatric - Market size and forecast 2024-2029 ($ million)
- Chart on Pediatric - Year-over-year growth 2024-2029 (%)
- Data Table on Pediatric - Year-over-year growth 2024-2029 (%)
- 9.4 Adult - Market size and forecast 2024-2029
- Chart on Adult - Market size and forecast 2024-2029 ($ million)
- Data Table on Adult - Market size and forecast 2024-2029 ($ million)
- Chart on Adult - Year-over-year growth 2024-2029 (%)
- Data Table on Adult - Year-over-year growth 2024-2029 (%)
- 9.5 Market opportunity by Age Group
- Market opportunity by Age Group ($ million)
- Data Table on Market opportunity by Age Group ($ million)
10 Customer Landscape
- 10.1 Customer landscape overview
- Analysis of price sensitivity, lifecycle, customer purchase basket, adoption rates, and purchase criteria
11 Geographic Landscape
- 11.1 Geographic segmentation
- Chart on Market share By Geographical Landscape 2024-2029 (%)
- Data Table on Market share By Geographical Landscape 2024-2029 (%)
- 11.2 Geographic comparison
- Chart on Geographic comparison
- Data Table on Geographic comparison
- 11.3 North America - Market size and forecast 2024-2029
- Chart on North America - Market size and forecast 2024-2029 ($ million)
- Data Table on North America - Market size and forecast 2024-2029 ($ million)
- Chart on North America - Year-over-year growth 2024-2029 (%)
- Data Table on North America - Year-over-year growth 2024-2029 (%)
- 11.4 Europe - Market size and forecast 2024-2029
- Chart on Europe - Market size and forecast 2024-2029 ($ million)
- Data Table on Europe - Market size and forecast 2024-2029 ($ million)
- Chart on Europe - Year-over-year growth 2024-2029 (%)
- Data Table on Europe - Year-over-year growth 2024-2029 (%)
- 11.5 Asia - Market size and forecast 2024-2029
- Chart on Asia - Market size and forecast 2024-2029 ($ million)
- Data Table on Asia - Market size and forecast 2024-2029 ($ million)
- Chart on Asia - Year-over-year growth 2024-2029 (%)
- Data Table on Asia - Year-over-year growth 2024-2029 (%)
- 11.6 Rest of World (ROW) - Market size and forecast 2024-2029
- Chart on Rest of World (ROW) - Market size and forecast 2024-2029 ($ million)
- Data Table on Rest of World (ROW) - Market size and forecast 2024-2029 ($ million)
- Chart on Rest of World (ROW) - Year-over-year growth 2024-2029 (%)
- Data Table on Rest of World (ROW) - Year-over-year growth 2024-2029 (%)
- 11.7 US - Market size and forecast 2024-2029
- Chart on US - Market size and forecast 2024-2029 ($ million)
- Data Table on US - Market size and forecast 2024-2029 ($ million)
- Chart on US - Year-over-year growth 2024-2029 (%)
- Data Table on US - Year-over-year growth 2024-2029 (%)
- 11.8 UK - Market size and forecast 2024-2029
- Chart on UK - Market size and forecast 2024-2029 ($ million)
- Data Table on UK - Market size and forecast 2024-2029 ($ million)
- Chart on UK - Year-over-year growth 2024-2029 (%)
- Data Table on UK - Year-over-year growth 2024-2029 (%)
- 11.9 Germany - Market size and forecast 2024-2029
- Chart on Germany - Market size and forecast 2024-2029 ($ million)
- Data Table on Germany - Market size and forecast 2024-2029 ($ million)
- Chart on Germany - Year-over-year growth 2024-2029 (%)
- Data Table on Germany - Year-over-year growth 2024-2029 (%)
- 11.10 France - Market size and forecast 2024-2029
- Chart on France - Market size and forecast 2024-2029 ($ million)
- Data Table on France - Market size and forecast 2024-2029 ($ million)
- Chart on France - Year-over-year growth 2024-2029 (%)
- Data Table on France - Year-over-year growth 2024-2029 (%)
- 11.11 China - Market size and forecast 2024-2029
- Chart on China - Market size and forecast 2024-2029 ($ million)
- Data Table on China - Market size and forecast 2024-2029 ($ million)
- Chart on China - Year-over-year growth 2024-2029 (%)
- Data Table on China - Year-over-year growth 2024-2029 (%)
- 11.12 Canada - Market size and forecast 2024-2029
- Chart on Canada - Market size and forecast 2024-2029 ($ million)
- Data Table on Canada - Market size and forecast 2024-2029 ($ million)
- Chart on Canada - Year-over-year growth 2024-2029 (%)
- Data Table on Canada - Year-over-year growth 2024-2029 (%)
- 11.13 India - Market size and forecast 2024-2029
- Chart on India - Market size and forecast 2024-2029 ($ million)
- Data Table on India - Market size and forecast 2024-2029 ($ million)
- Chart on India - Year-over-year growth 2024-2029 (%)
- Data Table on India - Year-over-year growth 2024-2029 (%)
- 11.14 Japan - Market size and forecast 2024-2029
- Chart on Japan - Market size and forecast 2024-2029 ($ million)
- Data Table on Japan - Market size and forecast 2024-2029 ($ million)
- Chart on Japan - Year-over-year growth 2024-2029 (%)
- Data Table on Japan - Year-over-year growth 2024-2029 (%)
- 11.15 Italy - Market size and forecast 2024-2029
- Chart on Italy - Market size and forecast 2024-2029 ($ million)
- Data Table on Italy - Market size and forecast 2024-2029 ($ million)
- Chart on Italy - Year-over-year growth 2024-2029 (%)
- Data Table on Italy - Year-over-year growth 2024-2029 (%)
- 11.16 Australia - Market size and forecast 2024-2029
- Chart on Australia - Market size and forecast 2024-2029 ($ million)
- Data Table on Australia - Market size and forecast 2024-2029 ($ million)
- Chart on Australia - Year-over-year growth 2024-2029 (%)
- Data Table on Australia - Year-over-year growth 2024-2029 (%)
- 11.17 Market opportunity By Geographical Landscape
- Market opportunity By Geographical Landscape ($ million)
- Data Tables on Market opportunity By Geographical Landscape ($ million)
12 Drivers, Challenges, and Opportunity/Restraints
- 12.1 Market drivers
- 12.2 Market challenges
- 12.3 Impact of drivers and challenges
- Impact of drivers and challenges in 2024 and 2029
- 12.4 Market opportunities/restraints
13 Competitive Landscape
- 13.1 Overview
- 13.2 Competitive Landscape
- Overview on criticality of inputs and factors of differentiation
- 13.3 Landscape disruption
- Overview on factors of disruption
- 13.4 Industry risks
- Impact of key risks on business
14 Competitive Analysis
- 14.1 Companies profiled
- Companies covered
- 14.2 Company ranking index
- Company ranking index
- 14.3 Market positioning of companies
- Matrix on companies position and classification
- 14.4 Autism Services Inc.
- Autism Services Inc. - Overview
- Autism Services Inc. - Product / Service
- Autism Services Inc. - Key offerings
- SWOT
- 14.5 AUTISM SPECTRUM CONSULTANTS INC.
- AUTISM SPECTRUM CONSULTANTS INC. - Overview
- AUTISM SPECTRUM CONSULTANTS INC. - Product / Service
- AUTISM SPECTRUM CONSULTANTS INC. - Key offerings
- SWOT
- 14.6 Autism Spectrum Therapies
- Autism Spectrum Therapies - Overview
- Autism Spectrum Therapies - Product / Service
- Autism Spectrum Therapies - Key offerings
- SWOT
- 14.7 Behavior Frontiers
- Behavior Frontiers - Overview
- Behavior Frontiers - Product / Service
- Behavior Frontiers - Key offerings
- SWOT
- 14.8 BlueSprig
- BlueSprig - Overview
- BlueSprig - Product / Service
- BlueSprig - Key offerings
- SWOT
- 14.9 Cadabams Hospitals
- Cadabams Hospitals - Overview
- Cadabams Hospitals - Product / Service
- Cadabams Hospitals - Key offerings
- SWOT
- 14.10 Center for Autism and Related Disorders
- Center for Autism and Related Disorders - Overview
- Center for Autism and Related Disorders - Product / Service
- Center for Autism and Related Disorders - Key offerings
- SWOT
- 14.11 FFL Partners LLC
- FFL Partners LLC - Overview
- FFL Partners LLC - Product / Service
- FFL Partners LLC - Key offerings
- SWOT
- 14.12 Hopebridge LLC
- Hopebridge LLC - Overview
- Hopebridge LLC - Product / Service
- Hopebridge LLC - Key offerings
- SWOT
- 14.13 Ihear
- Ihear - Overview
- Ihear - Product / Service
- Ihear - Key offerings
- SWOT
- 14.14 Johnson and Johnson Inc.
- Johnson and Johnson Inc. - Overview
- Johnson and Johnson Inc. - Business segments
- Johnson and Johnson Inc. - Key news
- Johnson and Johnson Inc. - Key offerings
- Johnson and Johnson Inc. - Segment focus
- SWOT
- 14.15 Magnet ABA Therapy
- Magnet ABA Therapy - Overview
- Magnet ABA Therapy - Product / Service
- Magnet ABA Therapy - Key offerings
- SWOT
- 14.16 Max Healthcare Institute Ltd
- Max Healthcare Institute Ltd - Overview
- Max Healthcare Institute Ltd - Product / Service
- Max Healthcare Institute Ltd - Key offerings
- SWOT
- 14.17 Merck and Co. Inc.
- Merck and Co. Inc. - Overview
- Merck and Co. Inc. - Business segments
- Merck and Co. Inc. - Key news
- Merck and Co. Inc. - Key offerings
- Merck and Co. Inc. - Segment focus
- SWOT
- 14.18 Novartis AG
- Novartis AG - Overview
- Novartis AG - Business segments
- Novartis AG - Key news
- Novartis AG - Key offerings
- Novartis AG - Segment focus
- SWOT
15 Appendix
- 15.1 Scope of the report
- 15.2 Inclusions and exclusions checklist
- Inclusions checklist
- Exclusions checklist
- 15.3 Currency conversion rates for US$
- Currency conversion rates for US$
- 15.4 Research methodology
- Research methodology
- 15.5 Data procurement
- Information sources
- 15.6 Data validation
- Data validation
- 15.7 Validation techniques employed for market sizing
- Validation techniques employed for market sizing
- 15.8 Data synthesis
- Data synthesis
- 15.9 360 degree market analysis
- 360 degree market analysis
- 15.10 List of abbreviations
- List of abbreviations
- o Efficient operational processes
- o Strong market position
- o Strong market position
- o Efficient operational processes
- o Strong operational management
- o Stable market performance
- o Efficient operational processes
- o Strong operational management
- o Efficient operational processes
- o Strong infrastructure
- o Strong market position
