|
|
市場調査レポート
商品コード
1603924
酵素の世界市場、2024~2028年Global Enzymes Market 2024-2028 |
||||||

|
|||||||
カスタマイズ可能
|
|||||||


| 酵素の世界市場、2024~2028年 |
|
出版日: 2024年10月25日
発行: TechNavio
ページ情報: 英文 149 Pages
納期: 即納可能
|

全表示
- 概要
- 図表
- 目次
酵素市場、2024~2028年
酵素市場は2023~2028年に24億800万米ドル、予測期間中のCAGRは4.8%で成長すると予測されます。当レポートでは、酵素市場の全体的な分析、市場規模・予測、動向、成長促進要因、課題、約25のベンダーを網羅したベンダー分析などを掲載しています。
現在の市場シナリオ、最新動向と促進要因、市場環境全体に関する最新分析を提供しています。市場は、バイオ燃料の生産量の急増、各産業における酵素の幅広い用途、製パンセグメントで数多くの酵素の運用を生み出すバイオテクノロジーの急速な発展によって牽引されています。
| 市場範囲 | |
|---|---|
| 基準年 | 2024年 |
| 終了年 | 2028年 |
| 予測期間 | 2024~2028年 |
| 成長モメンタム | 加速 |
| 前年比[2024年] | 4.5% |
| CAGR | 4.8% |
| 増分額 | 24億800万米ドル |
本調査では、今後数年間の酵素市場の成長を促進する主要理由の1つとして、食品加工用途からの需要の増加を挙げています。また、最近の酵素技術の進歩や消化器系疾患の有病率の増加は、市場の大きな需要につながります。
目次
第1章 エグゼクティブサマリー
- 市場概要
第2章 市場情勢
- 市場エコシステム
- 市場の特徴
- バリューチェーン分析
第3章 市場規模
- 市場の定義
- 市場セグメント分析
- 市場規模 2023年
- 市場の展望 2023~2028年
第4章 市場規模実績
- 酵素の世界市場 2018~2022年
- 用途別セグメント分析 2018~2022年
- 地域別セグメント分析 2018~2022年
- 国別セグメント分析 2018~2022年
第5章 ファイブフォース分析
- ファイブフォースの要約
- 買い手の交渉力
- 供給企業の交渉力
- 新規参入業者の脅威
- 代替品の脅威
- 競争の脅威
- 市況
第6章 市場セグメンテーション:用途別
- 市場セグメント
- 比較:用途別
- 飲食品:市場規模と予測 2023~2028年
- 家庭用:市場規模と予測 2023~2028年
- バイオエネルギー:市場規模と予測 2023~2028年
- 飼料:市場規模と予測 2023~2028年
- その他:市場規模と予測 2023~2028年
- 市場機会:用途別
第7章 顧客情勢
- 顧客情勢概要
第8章 地域別情勢
- 地域別セグメンテーション
- 比較:地域別
- 北米:市場規模と予測 2023~2028年
- 欧州:市場規模と予測 2023~2028年
- アジア太平洋:市場規模と予測 2023~2028年
- 南米:市場規模と予測 2023~2028年
- 中東・アフリカ:市場規模と予測 2023~2028年
- 米国:市場規模と予測 2023~2028年
- 中国:市場規模と予測 2023~2028年
- ドイツ:市場規模と予測 2023~2028年
- カナダ:市場規模と予測 2023~2028年
- ブラジル:市場規模と予測 2023~2028年
- 地域情勢による市場機会
第9章 促進要因・課題・機会・抑制要因
- 市場促進要因
- 市場課題
- 促進要因と課題の影響
- 市場機会・抑制要因
第10章 競合情勢
- 概要
- 競合情勢
- 混乱の状況
- 産業のリスク
第11章 競合分析
- 企業プロファイル
- 企業の市場ポジショニング
- Advanced Enzyme Technologies Ltd.
- Amano Enzyme Inc.
- Associated British Foods Plc
- BASF SE
- Codexis Inc
- DuPont
- F. Hoffmann La Roche Ltd.
- Koninklijke DSM NV
- Lonza Group Ltd.
- Novo Holdings AS
第12章 付録
Exhibits:
- Exhibits1: Executive Summary - Chart on Market Overview
- Exhibits2: Executive Summary - Data Table on Market Overview
- Exhibits3: Executive Summary - Chart on Global Market Characteristics
- Exhibits4: Executive Summary - Chart on Market By Geographical Landscape
- Exhibits5: Executive Summary - Chart on Market Segmentation by Application
- Exhibits6: Executive Summary - Chart on Incremental Growth
- Exhibits7: Executive Summary - Data Table on Incremental Growth
- Exhibits8: Executive Summary - Chart on Company Market Positioning
- Exhibits9: Parent Market
- Exhibits10: Data Table on - Parent Market
- Exhibits11: Market characteristics analysis
- Exhibits12: Value Chain Analysis
- Exhibits13: Offerings of companies included in the market definition
- Exhibits14: Market segments
- Exhibits15: Chart on Global - Market size and forecast 2023-2028 ($ million)
- Exhibits16: Data Table on Global - Market size and forecast 2023-2028 ($ million)
- Exhibits17: Chart on Global Market: Year-over-year growth 2023-2028 (%)
- Exhibits18: Data Table on Global Market: Year-over-year growth 2023-2028 (%)
- Exhibits19: Historic Market Size - Data Table on Global Enzymes Market 2018 - 2022 ($ million)
- Exhibits20: Historic Market Size - Application Segment 2018 - 2022 ($ million)
- Exhibits21: Historic Market Size - Geography Segment 2018 - 2022 ($ million)
- Exhibits22: Historic Market Size - Country Segment 2018 - 2022 ($ million)
- Exhibits23: Five forces analysis - Comparison between 2023 and 2028
- Exhibits24: Bargaining power of buyers - Impact of key factors 2023 and 2028
- Exhibits25: Bargaining power of suppliers - Impact of key factors in 2023 and 2028
- Exhibits26: Threat of new entrants - Impact of key factors in 2023 and 2028
- Exhibits27: Threat of substitutes - Impact of key factors in 2023 and 2028
- Exhibits28: Threat of rivalry - Impact of key factors in 2023 and 2028
- Exhibits29: Chart on Market condition - Five forces 2023 and 2028
- Exhibits30: Chart on Application - Market share 2023-2028 (%)
- Exhibits31: Data Table on Application - Market share 2023-2028 (%)
- Exhibits32: Chart on Comparison by Application
- Exhibits33: Data Table on Comparison by Application
- Exhibits34: Chart on Food and beverages - Market size and forecast 2023-2028 ($ million)
- Exhibits35: Data Table on Food and beverages - Market size and forecast 2023-2028 ($ million)
- Exhibits36: Chart on Food and beverages - Year-over-year growth 2023-2028 (%)
- Exhibits37: Data Table on Food and beverages - Year-over-year growth 2023-2028 (%)
- Exhibits38: Chart on Household - Market size and forecast 2023-2028 ($ million)
- Exhibits39: Data Table on Household - Market size and forecast 2023-2028 ($ million)
- Exhibits40: Chart on Household - Year-over-year growth 2023-2028 (%)
- Exhibits41: Data Table on Household - Year-over-year growth 2023-2028 (%)
- Exhibits42: Chart on Bioenergy - Market size and forecast 2023-2028 ($ million)
- Exhibits43: Data Table on Bioenergy - Market size and forecast 2023-2028 ($ million)
- Exhibits44: Chart on Bioenergy - Year-over-year growth 2023-2028 (%)
- Exhibits45: Data Table on Bioenergy - Year-over-year growth 2023-2028 (%)
- Exhibits46: Chart on Feed - Market size and forecast 2023-2028 ($ million)
- Exhibits47: Data Table on Feed - Market size and forecast 2023-2028 ($ million)
- Exhibits48: Chart on Feed - Year-over-year growth 2023-2028 (%)
- Exhibits49: Data Table on Feed - Year-over-year growth 2023-2028 (%)
- Exhibits50: Chart on Others - Market size and forecast 2023-2028 ($ million)
- Exhibits51: Data Table on Others - Market size and forecast 2023-2028 ($ million)
- Exhibits52: Chart on Others - Year-over-year growth 2023-2028 (%)
- Exhibits53: Data Table on Others - Year-over-year growth 2023-2028 (%)
- Exhibits54: Market opportunity by Application ($ million)
- Exhibits55: Data Table on Market opportunity by Application ($ million)
- Exhibits56: Analysis of price sensitivity, lifecycle, customer purchase basket, adoption rates, and purchase criteria
- Exhibits57: Chart on Market share By Geographical Landscape 2023-2028 (%)
- Exhibits58: Data Table on Market share By Geographical Landscape 2023-2028 (%)
- Exhibits59: Chart on Geographic comparison
- Exhibits60: Data Table on Geographic comparison
- Exhibits61: Chart on North America - Market size and forecast 2023-2028 ($ million)
- Exhibits62: Data Table on North America - Market size and forecast 2023-2028 ($ million)
- Exhibits63: Chart on North America - Year-over-year growth 2023-2028 (%)
- Exhibits64: Data Table on North America - Year-over-year growth 2023-2028 (%)
- Exhibits65: Chart on Europe - Market size and forecast 2023-2028 ($ million)
- Exhibits66: Data Table on Europe - Market size and forecast 2023-2028 ($ million)
- Exhibits67: Chart on Europe - Year-over-year growth 2023-2028 (%)
- Exhibits68: Data Table on Europe - Year-over-year growth 2023-2028 (%)
- Exhibits69: Chart on APAC - Market size and forecast 2023-2028 ($ million)
- Exhibits70: Data Table on APAC - Market size and forecast 2023-2028 ($ million)
- Exhibits71: Chart on APAC - Year-over-year growth 2023-2028 (%)
- Exhibits72: Data Table on APAC - Year-over-year growth 2023-2028 (%)
- Exhibits73: Chart on South America - Market size and forecast 2023-2028 ($ million)
- Exhibits74: Data Table on South America - Market size and forecast 2023-2028 ($ million)
- Exhibits75: Chart on South America - Year-over-year growth 2023-2028 (%)
- Exhibits76: Data Table on South America - Year-over-year growth 2023-2028 (%)
- Exhibits77: Chart on Middle East and Africa - Market size and forecast 2023-2028 ($ million)
- Exhibits78: Data Table on Middle East and Africa - Market size and forecast 2023-2028 ($ million)
- Exhibits79: Chart on Middle East and Africa - Year-over-year growth 2023-2028 (%)
- Exhibits80: Data Table on Middle East and Africa - Year-over-year growth 2023-2028 (%)
- Exhibits81: Chart on US - Market size and forecast 2023-2028 ($ million)
- Exhibits82: Data Table on US - Market size and forecast 2023-2028 ($ million)
- Exhibits83: Chart on US - Year-over-year growth 2023-2028 (%)
- Exhibits84: Data Table on US - Year-over-year growth 2023-2028 (%)
- Exhibits85: Chart on China - Market size and forecast 2023-2028 ($ million)
- Exhibits86: Data Table on China - Market size and forecast 2023-2028 ($ million)
- Exhibits87: Chart on China - Year-over-year growth 2023-2028 (%)
- Exhibits88: Data Table on China - Year-over-year growth 2023-2028 (%)
- Exhibits89: Chart on Germany - Market size and forecast 2023-2028 ($ million)
- Exhibits90: Data Table on Germany - Market size and forecast 2023-2028 ($ million)
- Exhibits91: Chart on Germany - Year-over-year growth 2023-2028 (%)
- Exhibits92: Data Table on Germany - Year-over-year growth 2023-2028 (%)
- Exhibits93: Chart on Canada - Market size and forecast 2023-2028 ($ million)
- Exhibits94: Data Table on Canada - Market size and forecast 2023-2028 ($ million)
- Exhibits95: Chart on Canada - Year-over-year growth 2023-2028 (%)
- Exhibits96: Data Table on Canada - Year-over-year growth 2023-2028 (%)
- Exhibits97: Chart on Brazil - Market size and forecast 2023-2028 ($ million)
- Exhibits98: Data Table on Brazil - Market size and forecast 2023-2028 ($ million)
- Exhibits99: Chart on Brazil - Year-over-year growth 2023-2028 (%)
- Exhibits100: Data Table on Brazil - Year-over-year growth 2023-2028 (%)
- Exhibits101: Market opportunity By Geographical Landscape ($ million)
- Exhibits102: Data Tables on Market opportunity By Geographical Landscape ($ million)
- Exhibits103: Impact of drivers and challenges in 2023 and 2028
- Exhibits104: Overview on criticality of inputs and factors of differentiation
- Exhibits105: Overview on factors of disruption
- Exhibits106: Impact of key risks on business
- Exhibits107: Companies covered
- Exhibits108: Matrix on companies position and classification
- Exhibits109: Advanced Enzyme Technologies Ltd. - Overview
- Exhibits110: Advanced Enzyme Technologies Ltd. - Business segments
- Exhibits111: Advanced Enzyme Technologies Ltd. - Key offerings
- Exhibits112: Advanced Enzyme Technologies Ltd. - Segment focus
- Exhibits113: Amano Enzyme Inc. - Overview
- Exhibits114: Amano Enzyme Inc. - Product / Service
- Exhibits115: Amano Enzyme Inc. - Key offerings
- Exhibits116: Associated British Foods Plc - Overview
- Exhibits117: Associated British Foods Plc - Business segments
- Exhibits118: Associated British Foods Plc - Key offerings
- Exhibits119: Associated British Foods Plc - Segment focus
- Exhibits120: BASF SE - Overview
- Exhibits121: BASF SE - Business segments
- Exhibits122: BASF SE - Key news
- Exhibits123: BASF SE - Key offerings
- Exhibits124: BASF SE - Segment focus
- Exhibits125: Codexis Inc - Overview
- Exhibits126: Codexis Inc - Business segments
- Exhibits127: Codexis Inc - Key offerings
- Exhibits128: Codexis Inc - Segment focus
- Exhibits129: DuPont - Overview
- Exhibits130: DuPont - Business segments
- Exhibits131: DuPont - Key news
- Exhibits132: DuPont - Key offerings
- Exhibits133: DuPont - Segment focus
- Exhibits134: F. Hoffmann La Roche Ltd. - Overview
- Exhibits135: F. Hoffmann La Roche Ltd. - Business segments
- Exhibits136: F. Hoffmann La Roche Ltd. - Key news
- Exhibits137: F. Hoffmann La Roche Ltd. - Key offerings
- Exhibits138: F. Hoffmann La Roche Ltd. - Segment focus
- Exhibits139: Koninklijke DSM NV - Overview
- Exhibits140: Koninklijke DSM NV - Business segments
- Exhibits141: Koninklijke DSM NV - Key news
- Exhibits142: Koninklijke DSM NV - Key offerings
- Exhibits143: Koninklijke DSM NV - Segment focus
- Exhibits144: Lonza Group Ltd. - Overview
- Exhibits145: Lonza Group Ltd. - Business segments
- Exhibits146: Lonza Group Ltd. - Key news
- Exhibits147: Lonza Group Ltd. - Key offerings
- Exhibits148: Lonza Group Ltd. - Segment focus
- Exhibits149: Novo Holdings AS - Overview
- Exhibits150: Novo Holdings AS - Product / Service
- Exhibits151: Novo Holdings AS - Key offerings
- Exhibits152: Inclusions checklist
- Exhibits153: Exclusions checklist
- Exhibits154: Currency conversion rates for US$
- Exhibits155: Research methodology
- Exhibits156: Information sources
- Exhibits157: Data validation
- Exhibits158: Validation techniques employed for market sizing
- Exhibits159: Data synthesis
- Exhibits160: 360 degree market analysis
- Exhibits161: List of abbreviations
Enzymes Market 2024-2028
The enzymes market is forecasted to grow by USD 2408 mn during 2023-2028, accelerating at a CAGR of 4.8% during the forecast period. The report on the enzymes market provides a holistic analysis, market size and forecast, trends, growth drivers, and challenges, as well as vendor analysis covering around 25 vendors.
The report offers an up-to-date analysis regarding the current market scenario, the latest trends and drivers, and the overall market environment. The market is driven by surge in production of biofuel, wide applications of enzymes across industries, and rapid developments in biotechnology generating numerous enzymes operational for baking sector.
| Market Scope | |
|---|---|
| Base Year | 2024 |
| End Year | 2028 |
| Series Year | 2024-2028 |
| Growth Momentum | Accelerate |
| YOY 2024 | 4.5% |
| CAGR | 4.8% |
| Incremental Value | $2408 mn |
Technavio's enzymes market is segmented as below:
By Application
- Food and beverages
- Household
- Bioenergy
- Feed
- Others
By Geographical Landscape
- North America
- Europe
- APAC
- South America
- Middle East and Africa
This study identifies the growing demand from food processing applications as one of the prime reasons driving the enzymes market growth during the next few years. Also, recent advances in enzyme technology and higher prevalence of digestive diseases will lead to sizable demand in the market.
The report on the enzymes market covers the following areas:
- Enzymes Market sizing
- Enzymes Market forecast
- Enzymes Market industry analysis
The robust vendor analysis is designed to help clients improve their market position, and in line with this, this report provides a detailed analysis of several leading enzymes market vendors that include Advanced Enzyme Technologies Ltd., Amano Enzyme Inc., Associated British Foods Plc, Aum Enzymes, BASF SE, BBI Solutions OEM Ltd., China National Bluestar Group Co. Ltd., Chr Hansen AS, Codexis Inc, DuPont, Enzyme Development Corp., F. Hoffmann La Roche Ltd., Koninklijke DSM NV, Lesaffre and Cie, Lonza Group Ltd., Mitsui and Co. Ltd., Novo Holdings AS, Puratos Group, Thermo Fisher Scientific Inc., and Wittington Investments Ltd.. Also, the enzymes market analysis report includes information on upcoming trends and challenges that will influence market growth. This is to help companies strategize and leverage all forthcoming growth opportunities.
The study was conducted using an objective combination of primary and secondary information including inputs from key participants in the industry. The report contains a comprehensive market and vendor landscape in addition to an analysis of the key vendors.
The publisher presents a detailed picture of the market by the way of study, synthesis, and summation of data from multiple sources by an analysis of key parameters such as profit, pricing, competition, and promotions. It presents various market facets by identifying the key industry influencers. The data presented is comprehensive, reliable, and a result of extensive primary and secondary research. The market research reports provide a complete competitive landscape and an in-depth vendor selection methodology and analysis using qualitative and quantitative research to forecast accurate market growth.
Table of Contents
1 Executive Summary
- 1.1 Market overview
- Executive Summary - Chart on Market Overview
- Executive Summary - Data Table on Market Overview
- Executive Summary - Chart on Global Market Characteristics
- Executive Summary - Chart on Market By Geographical Landscape
- Executive Summary - Chart on Market Segmentation by Application
- Executive Summary - Chart on Incremental Growth
- Executive Summary - Data Table on Incremental Growth
- Executive Summary - Chart on Company Market Positioning
2 Market Landscape
- 2.1 Market ecosystem
- Parent Market
- Data Table on - Parent Market
- 2.2 Market characteristics
- Market characteristics analysis
- 2.3 Value chain analysis
- Value Chain Analysis
3 Market Sizing
- 3.1 Market definition
- Offerings of companies included in the market definition
- 3.2 Market segment analysis
- Market segments
- 3.3 Market size 2023
- 3.4 Market outlook: Forecast for 2023-2028
- Chart on Global - Market size and forecast 2023-2028 ($ million)
- Data Table on Global - Market size and forecast 2023-2028 ($ million)
- Chart on Global Market: Year-over-year growth 2023-2028 (%)
- Data Table on Global Market: Year-over-year growth 2023-2028 (%)
4 Historic Market Size
- 4.1 Global Enzymes Market 2018 - 2022
- Historic Market Size - Data Table on Global Enzymes Market 2018 - 2022 ($ million)
- 4.2 Application segment analysis 2018 - 2022
- Historic Market Size - Application Segment 2018 - 2022 ($ million)
- 4.3 Geography segment analysis 2018 - 2022
- Historic Market Size - Geography Segment 2018 - 2022 ($ million)
- 4.4 Country segment analysis 2018 - 2022
- Historic Market Size - Country Segment 2018 - 2022 ($ million)
5 Five Forces Analysis
- 5.1 Five forces summary
- Five forces analysis - Comparison between 2023 and 2028
- 5.2 Bargaining power of buyers
- Bargaining power of buyers - Impact of key factors 2023 and 2028
- 5.3 Bargaining power of suppliers
- Bargaining power of suppliers - Impact of key factors in 2023 and 2028
- 5.4 Threat of new entrants
- Threat of new entrants - Impact of key factors in 2023 and 2028
- 5.5 Threat of substitutes
- Threat of substitutes - Impact of key factors in 2023 and 2028
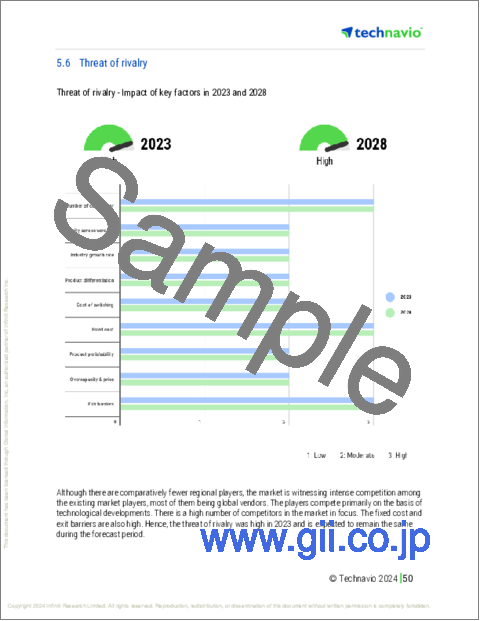
- 5.6 Threat of rivalry
- Threat of rivalry - Impact of key factors in 2023 and 2028
- 5.7 Market condition
- Chart on Market condition - Five forces 2023 and 2028
6 Market Segmentation by Application
- 6.1 Market segments
- Chart on Application - Market share 2023-2028 (%)
- Data Table on Application - Market share 2023-2028 (%)
- 6.2 Comparison by Application
- Chart on Comparison by Application
- Data Table on Comparison by Application
- 6.3 Food and beverages - Market size and forecast 2023-2028
- Chart on Food and beverages - Market size and forecast 2023-2028 ($ million)
- Data Table on Food and beverages - Market size and forecast 2023-2028 ($ million)
- Chart on Food and beverages - Year-over-year growth 2023-2028 (%)
- Data Table on Food and beverages - Year-over-year growth 2023-2028 (%)
- 6.4 Household - Market size and forecast 2023-2028
- Chart on Household - Market size and forecast 2023-2028 ($ million)
- Data Table on Household - Market size and forecast 2023-2028 ($ million)
- Chart on Household - Year-over-year growth 2023-2028 (%)
- Data Table on Household - Year-over-year growth 2023-2028 (%)
- 6.5 Bioenergy - Market size and forecast 2023-2028
- Chart on Bioenergy - Market size and forecast 2023-2028 ($ million)
- Data Table on Bioenergy - Market size and forecast 2023-2028 ($ million)
- Chart on Bioenergy - Year-over-year growth 2023-2028 (%)
- Data Table on Bioenergy - Year-over-year growth 2023-2028 (%)
- 6.6 Feed - Market size and forecast 2023-2028
- Chart on Feed - Market size and forecast 2023-2028 ($ million)
- Data Table on Feed - Market size and forecast 2023-2028 ($ million)
- Chart on Feed - Year-over-year growth 2023-2028 (%)
- Data Table on Feed - Year-over-year growth 2023-2028 (%)
- 6.7 Others - Market size and forecast 2023-2028
- Chart on Others - Market size and forecast 2023-2028 ($ million)
- Data Table on Others - Market size and forecast 2023-2028 ($ million)
- Chart on Others - Year-over-year growth 2023-2028 (%)
- Data Table on Others - Year-over-year growth 2023-2028 (%)
- 6.8 Market opportunity by Application
- Market opportunity by Application ($ million)
- Data Table on Market opportunity by Application ($ million)
7 Customer Landscape
- 7.1 Customer landscape overview
- Analysis of price sensitivity, lifecycle, customer purchase basket, adoption rates, and purchase criteria
8 Geographic Landscape
- 8.1 Geographic segmentation
- Chart on Market share By Geographical Landscape 2023-2028 (%)
- Data Table on Market share By Geographical Landscape 2023-2028 (%)
- 8.2 Geographic comparison
- Chart on Geographic comparison
- Data Table on Geographic comparison
- 8.3 North America - Market size and forecast 2023-2028
- Chart on North America - Market size and forecast 2023-2028 ($ million)
- Data Table on North America - Market size and forecast 2023-2028 ($ million)
- Chart on North America - Year-over-year growth 2023-2028 (%)
- Data Table on North America - Year-over-year growth 2023-2028 (%)
- 8.4 Europe - Market size and forecast 2023-2028
- Chart on Europe - Market size and forecast 2023-2028 ($ million)
- Data Table on Europe - Market size and forecast 2023-2028 ($ million)
- Chart on Europe - Year-over-year growth 2023-2028 (%)
- Data Table on Europe - Year-over-year growth 2023-2028 (%)
- 8.5 APAC - Market size and forecast 2023-2028
- Chart on APAC - Market size and forecast 2023-2028 ($ million)
- Data Table on APAC - Market size and forecast 2023-2028 ($ million)
- Chart on APAC - Year-over-year growth 2023-2028 (%)
- Data Table on APAC - Year-over-year growth 2023-2028 (%)
- 8.6 South America - Market size and forecast 2023-2028
- Chart on South America - Market size and forecast 2023-2028 ($ million)
- Data Table on South America - Market size and forecast 2023-2028 ($ million)
- Chart on South America - Year-over-year growth 2023-2028 (%)
- Data Table on South America - Year-over-year growth 2023-2028 (%)
- 8.7 Middle East and Africa - Market size and forecast 2023-2028
- Chart on Middle East and Africa - Market size and forecast 2023-2028 ($ million)
- Data Table on Middle East and Africa - Market size and forecast 2023-2028 ($ million)
- Chart on Middle East and Africa - Year-over-year growth 2023-2028 (%)
- Data Table on Middle East and Africa - Year-over-year growth 2023-2028 (%)
- 8.8 US - Market size and forecast 2023-2028
- Chart on US - Market size and forecast 2023-2028 ($ million)
- Data Table on US - Market size and forecast 2023-2028 ($ million)
- Chart on US - Year-over-year growth 2023-2028 (%)
- Data Table on US - Year-over-year growth 2023-2028 (%)
- 8.9 China - Market size and forecast 2023-2028
- Chart on China - Market size and forecast 2023-2028 ($ million)
- Data Table on China - Market size and forecast 2023-2028 ($ million)
- Chart on China - Year-over-year growth 2023-2028 (%)
- Data Table on China - Year-over-year growth 2023-2028 (%)
- 8.10 Germany - Market size and forecast 2023-2028
- Chart on Germany - Market size and forecast 2023-2028 ($ million)
- Data Table on Germany - Market size and forecast 2023-2028 ($ million)
- Chart on Germany - Year-over-year growth 2023-2028 (%)
- Data Table on Germany - Year-over-year growth 2023-2028 (%)
- 8.11 Canada - Market size and forecast 2023-2028
- Chart on Canada - Market size and forecast 2023-2028 ($ million)
- Data Table on Canada - Market size and forecast 2023-2028 ($ million)
- Chart on Canada - Year-over-year growth 2023-2028 (%)
- Data Table on Canada - Year-over-year growth 2023-2028 (%)
- 8.12 Brazil - Market size and forecast 2023-2028
- Chart on Brazil - Market size and forecast 2023-2028 ($ million)
- Data Table on Brazil - Market size and forecast 2023-2028 ($ million)
- Chart on Brazil - Year-over-year growth 2023-2028 (%)
- Data Table on Brazil - Year-over-year growth 2023-2028 (%)
- 8.13 Market opportunity By Geographical Landscape
- Market opportunity By Geographical Landscape ($ million)
- Data Tables on Market opportunity By Geographical Landscape ($ million)
9 Drivers, Challenges, and Opportunity/Restraints
- 9.1 Market drivers
- 9.2 Market challenges
- 9.3 Impact of drivers and challenges
- Impact of drivers and challenges in 2023 and 2028
- 9.4 Market opportunities/restraints
10 Competitive Landscape
- 10.1 Overview
- 10.2 Competitive Landscape
- Overview on criticality of inputs and factors of differentiation
- 10.3 Landscape disruption
- Overview on factors of disruption
- 10.4 Industry risks
- Impact of key risks on business
11 Competitive Analysis
- 11.1 Companies profiled
- Companies covered
- 11.2 Market positioning of companies
- Matrix on companies position and classification
- 11.3 Advanced Enzyme Technologies Ltd.
- Advanced Enzyme Technologies Ltd. - Overview
- Advanced Enzyme Technologies Ltd. - Business segments
- Advanced Enzyme Technologies Ltd. - Key offerings
- Advanced Enzyme Technologies Ltd. - Segment focus
- 11.4 Amano Enzyme Inc.
- Amano Enzyme Inc. - Overview
- Amano Enzyme Inc. - Product / Service
- Amano Enzyme Inc. - Key offerings
- 11.5 Associated British Foods Plc
- Associated British Foods Plc - Overview
- Associated British Foods Plc - Business segments
- Associated British Foods Plc - Key offerings
- Associated British Foods Plc - Segment focus
- 11.6 BASF SE
- BASF SE - Overview
- BASF SE - Business segments
- BASF SE - Key news
- BASF SE - Key offerings
- BASF SE - Segment focus
- 11.7 Codexis Inc
- Codexis Inc - Overview
- Codexis Inc - Business segments
- Codexis Inc - Key offerings
- Codexis Inc - Segment focus
- 11.8 DuPont
- DuPont - Overview
- DuPont - Business segments
- DuPont - Key news
- DuPont - Key offerings
- DuPont - Segment focus
- 11.9 F. Hoffmann La Roche Ltd.
- F. Hoffmann La Roche Ltd. - Overview
- F. Hoffmann La Roche Ltd. - Business segments
- F. Hoffmann La Roche Ltd. - Key news
- F. Hoffmann La Roche Ltd. - Key offerings
- F. Hoffmann La Roche Ltd. - Segment focus
- 11.10 Koninklijke DSM NV
- Koninklijke DSM NV - Overview
- Koninklijke DSM NV - Business segments
- Koninklijke DSM NV - Key news
- Koninklijke DSM NV - Key offerings
- Koninklijke DSM NV - Segment focus
- 11.11 Lonza Group Ltd.
- Lonza Group Ltd. - Overview
- Lonza Group Ltd. - Business segments
- Lonza Group Ltd. - Key news
- Lonza Group Ltd. - Key offerings
- Lonza Group Ltd. - Segment focus
- 11.12 Novo Holdings AS
- Novo Holdings AS - Overview
- Novo Holdings AS - Product / Service
- Novo Holdings AS - Key offerings
12 Appendix
- 12.1 Scope of the report
- 12.2 Inclusions and exclusions checklist
- Inclusions checklist
- Exclusions checklist
- 12.3 Currency conversion rates for US$
- Currency conversion rates for US$
- 12.4 Research methodology
- Research methodology
- 12.5 Data procurement
- Information sources
- 12.6 Data validation
- Data validation
- 12.7 Validation techniques employed for market sizing
- Validation techniques employed for market sizing
- 12.8 Data synthesis
- Data synthesis
- 12.9 360 degree market analysis
- 360 degree market analysis
- 12.10 List of abbreviations
- List of abbreviations

