|
|
市場調査レポート
商品コード
1603694
自動車内装用レザーの世界市場 (2024~2028年)Global Automotive Interior Leather Market 2024-2028 |
||||||

|
|||||||
カスタマイズ可能
|
|||||||


| 自動車内装用レザーの世界市場 (2024~2028年) |
|
出版日: 2024年10月29日
発行: TechNavio
ページ情報: 英文 135 Pages
納期: 即納可能
|

全表示
- 概要
- 図表
- 目次
自動車内装用レザー市場 (2024~2028年)
自動車内装用レザー市場は2023-2028年に160億米ドル分拡大し、予測期間中に9.5%のCAGRで成長すると予測されます。当レポートでは、自動車内装用レザー市場の全体的な分析、市場規模・予測、動向、成長促進要因、課題、約25のベンダーを網羅したベンダー分析などを掲載しています。
当レポートでは、現在の市場シナリオ、最新動向と促進要因、市場環境全体に関する最新分析を提供しています。市場は、資金調達の柔軟性による乗用車販売の改善、自動車における快適性と安全性の優先順位の高まり、軽量化のための複合材料の使用などが牽引しています。
| 市場範囲 | |
|---|---|
| 基準年 | 2024年 |
| 終了年 | 2028年 |
| 予測期間 | 2024~2028年 |
| 成長モメンタム | 加速 |
| 前年比 (2024年) | 8.6% |
| CAGR | 9.5% |
| 増分額 | 160億米ドル |
当レポートでは、今後数年間の自動車内装用レザー市場の成長を促進する主な要因の1つとして、軽量素材の技術革新を挙げています。また、一体型自動車内装用レザーの台頭や、自動車内装におけるビーガンレザーの利用拡大も、市場の大きな需要につながると思われます。
目次
第1章 エグゼクティブサマリー
- 市場概要
第2章 市場情勢
- 市場エコシステム
- 市場の特徴
- バリューチェーン分析
第3章 市場規模
- 市場の定義
- 市場セグメント分析
- 市場規模 (2023年)
- 市場の見通し (2023~2028年)
第4章 市場規模実績
- 自動車内装用レザーの世界市場 (2018~2022年)
- 車両別分析 (2018~2022年)
- 地域別分析 (2018~2022年)
- 国別分析 (2018~2022年)
第5章 ファイブフォース分析
- ファイブフォースの要約
- 買い手の交渉力
- 供給企業の交渉力
- 新規参入業者の脅威
- 代替品の脅威
- 競争の脅威
- 市況
第6章 市場セグメンテーション:車種別
- 市場セグメント
- 比較:車種別
- 乗用車:市場規模と予測 (2023~2028年)
- 小型商用車:市場規模と予測 (2023~2028年)
- 大型商用車:市場規模と予測 (2023~2028年)
- 市場機会:車種別
第7章 顧客情勢
- 顧客情勢の概要
第8章 地域別情勢
- 地域別セグメンテーション
- 地域別比較
- 欧州:市場規模と予測 (2023~2028年)
- アジア太平洋:市場規模と予測 (2023~2028年)
- 北米:市場規模と予測 (2023~2028年)
- 南米:市場規模と予測 (2023~2028年)
- 中東・アフリカ:市場規模と予測 (2023~2028年)
- ドイツ:市場規模と予測 (2023~2028年)
- 中国:市場規模と予測 (2023~2028年)
- 米国:市場規模と予測 (2023~2028年)
- フランス:市場規模と予測 (2023~2028年)
- 日本:市場規模と予測 (2023~2028年)
- 市場機会:地域別
第9章 促進要因・課題・機会・抑制要因
- 市場促進要因
- 市場の課題
- 促進要因と課題の影響
- 市場の機会・抑制要因
第10章 競合情勢
- 概要
- 競合情勢
- 混乱の状況
- 業界のリスク
第11章 競合分析
- 企業プロファイル
- 企業の市場ポジショニング
- Adient Plc
- Alfatex Italia Srl
- Ctl Leather Inc.
- Faurecia SA
- Gruppo Mastrotto Spa
- Katzkin Leather Inc.
- Lear Corp.
- Sage Automotive Interiors Inc.
- Toyota Boshoku Corp.
- Wollsdorf Leder Schmidt and Co Ges.mbH
第12章 付録
Exhibits:
- Exhibits1: Executive Summary - Chart on Market Overview
- Exhibits2: Executive Summary - Data Table on Market Overview
- Exhibits3: Executive Summary - Chart on Global Market Characteristics
- Exhibits4: Executive Summary - Chart on Market By Geographical Landscape
- Exhibits5: Executive Summary - Chart on Market Segmentation by Vehicle Type
- Exhibits6: Executive Summary - Chart on Incremental Growth
- Exhibits7: Executive Summary - Data Table on Incremental Growth
- Exhibits8: Executive Summary - Chart on Company Market Positioning
- Exhibits9: Parent Market
- Exhibits10: Data Table on - Parent Market
- Exhibits11: Market characteristics analysis
- Exhibits12: Value Chain Analysis
- Exhibits13: Offerings of companies included in the market definition
- Exhibits14: Market segments
- Exhibits15: Chart on Global - Market size and forecast 2023-2028 ($ billion)
- Exhibits16: Data Table on Global - Market size and forecast 2023-2028 ($ billion)
- Exhibits17: Chart on Global Market: Year-over-year growth 2023-2028 (%)
- Exhibits18: Data Table on Global Market: Year-over-year growth 2023-2028 (%)
- Exhibits19: Historic Market Size - Data Table on Global Automotive Interior Leather Market 2018 - 2022 ($ billion)
- Exhibits20: Historic Market Size - Vehicle Type Segment 2018 - 2022 ($ billion)
- Exhibits21: Historic Market Size - Geography Segment 2018 - 2022 ($ billion)
- Exhibits22: Historic Market Size - Country Segment 2018 - 2022 ($ billion)
- Exhibits23: Five forces analysis - Comparison between 2023 and 2028
- Exhibits24: Bargaining power of buyers - Impact of key factors 2023 and 2028
- Exhibits25: Bargaining power of suppliers - Impact of key factors in 2023 and 2028
- Exhibits26: Threat of new entrants - Impact of key factors in 2023 and 2028
- Exhibits27: Threat of substitutes - Impact of key factors in 2023 and 2028
- Exhibits28: Threat of rivalry - Impact of key factors in 2023 and 2028
- Exhibits29: Chart on Market condition - Five forces 2023 and 2028
- Exhibits30: Chart on Vehicle Type - Market share 2023-2028 (%)
- Exhibits31: Data Table on Vehicle Type - Market share 2023-2028 (%)
- Exhibits32: Chart on Comparison by Vehicle Type
- Exhibits33: Data Table on Comparison by Vehicle Type
- Exhibits34: Chart on Passenger cars - Market size and forecast 2023-2028 ($ billion)
- Exhibits35: Data Table on Passenger cars - Market size and forecast 2023-2028 ($ billion)
- Exhibits36: Chart on Passenger cars - Year-over-year growth 2023-2028 (%)
- Exhibits37: Data Table on Passenger cars - Year-over-year growth 2023-2028 (%)
- Exhibits38: Chart on LCV - Market size and forecast 2023-2028 ($ billion)
- Exhibits39: Data Table on LCV - Market size and forecast 2023-2028 ($ billion)
- Exhibits40: Chart on LCV - Year-over-year growth 2023-2028 (%)
- Exhibits41: Data Table on LCV - Year-over-year growth 2023-2028 (%)
- Exhibits42: Chart on HCV - Market size and forecast 2023-2028 ($ billion)
- Exhibits43: Data Table on HCV - Market size and forecast 2023-2028 ($ billion)
- Exhibits44: Chart on HCV - Year-over-year growth 2023-2028 (%)
- Exhibits45: Data Table on HCV - Year-over-year growth 2023-2028 (%)
- Exhibits46: Market opportunity by Vehicle Type ($ billion)
- Exhibits47: Data Table on Market opportunity by Vehicle Type ($ billion)
- Exhibits48: Analysis of price sensitivity, lifecycle, customer purchase basket, adoption rates, and purchase criteria
- Exhibits49: Chart on Market share By Geographical Landscape 2023-2028 (%)
- Exhibits50: Data Table on Market share By Geographical Landscape 2023-2028 (%)
- Exhibits51: Chart on Geographic comparison
- Exhibits52: Data Table on Geographic comparison
- Exhibits53: Chart on Europe - Market size and forecast 2023-2028 ($ billion)
- Exhibits54: Data Table on Europe - Market size and forecast 2023-2028 ($ billion)
- Exhibits55: Chart on Europe - Year-over-year growth 2023-2028 (%)
- Exhibits56: Data Table on Europe - Year-over-year growth 2023-2028 (%)
- Exhibits57: Chart on APAC - Market size and forecast 2023-2028 ($ billion)
- Exhibits58: Data Table on APAC - Market size and forecast 2023-2028 ($ billion)
- Exhibits59: Chart on APAC - Year-over-year growth 2023-2028 (%)
- Exhibits60: Data Table on APAC - Year-over-year growth 2023-2028 (%)
- Exhibits61: Chart on North America - Market size and forecast 2023-2028 ($ billion)
- Exhibits62: Data Table on North America - Market size and forecast 2023-2028 ($ billion)
- Exhibits63: Chart on North America - Year-over-year growth 2023-2028 (%)
- Exhibits64: Data Table on North America - Year-over-year growth 2023-2028 (%)
- Exhibits65: Chart on South America - Market size and forecast 2023-2028 ($ billion)
- Exhibits66: Data Table on South America - Market size and forecast 2023-2028 ($ billion)
- Exhibits67: Chart on South America - Year-over-year growth 2023-2028 (%)
- Exhibits68: Data Table on South America - Year-over-year growth 2023-2028 (%)
- Exhibits69: Chart on Middle East and Africa - Market size and forecast 2023-2028 ($ billion)
- Exhibits70: Data Table on Middle East and Africa - Market size and forecast 2023-2028 ($ billion)
- Exhibits71: Chart on Middle East and Africa - Year-over-year growth 2023-2028 (%)
- Exhibits72: Data Table on Middle East and Africa - Year-over-year growth 2023-2028 (%)
- Exhibits73: Chart on Germany - Market size and forecast 2023-2028 ($ billion)
- Exhibits74: Data Table on Germany - Market size and forecast 2023-2028 ($ billion)
- Exhibits75: Chart on Germany - Year-over-year growth 2023-2028 (%)
- Exhibits76: Data Table on Germany - Year-over-year growth 2023-2028 (%)
- Exhibits77: Chart on China - Market size and forecast 2023-2028 ($ billion)
- Exhibits78: Data Table on China - Market size and forecast 2023-2028 ($ billion)
- Exhibits79: Chart on China - Year-over-year growth 2023-2028 (%)
- Exhibits80: Data Table on China - Year-over-year growth 2023-2028 (%)
- Exhibits81: Chart on US - Market size and forecast 2023-2028 ($ billion)
- Exhibits82: Data Table on US - Market size and forecast 2023-2028 ($ billion)
- Exhibits83: Chart on US - Year-over-year growth 2023-2028 (%)
- Exhibits84: Data Table on US - Year-over-year growth 2023-2028 (%)
- Exhibits85: Chart on France - Market size and forecast 2023-2028 ($ billion)
- Exhibits86: Data Table on France - Market size and forecast 2023-2028 ($ billion)
- Exhibits87: Chart on France - Year-over-year growth 2023-2028 (%)
- Exhibits88: Data Table on France - Year-over-year growth 2023-2028 (%)
- Exhibits89: Chart on Japan - Market size and forecast 2023-2028 ($ billion)
- Exhibits90: Data Table on Japan - Market size and forecast 2023-2028 ($ billion)
- Exhibits91: Chart on Japan - Year-over-year growth 2023-2028 (%)
- Exhibits92: Data Table on Japan - Year-over-year growth 2023-2028 (%)
- Exhibits93: Market opportunity By Geographical Landscape ($ billion)
- Exhibits94: Data Tables on Market opportunity By Geographical Landscape ($ billion)
- Exhibits95: Impact of drivers and challenges in 2023 and 2028
- Exhibits96: Overview on criticality of inputs and factors of differentiation
- Exhibits97: Overview on factors of disruption
- Exhibits98: Impact of key risks on business
- Exhibits99: Companies covered
- Exhibits100: Matrix on companies position and classification
- Exhibits101: Adient Plc - Overview
- Exhibits102: Adient Plc - Business segments
- Exhibits103: Adient Plc - Key offerings
- Exhibits104: Adient Plc - Segment focus
- Exhibits105: Alfatex Italia Srl - Overview
- Exhibits106: Alfatex Italia Srl - Product / Service
- Exhibits107: Alfatex Italia Srl - Key offerings
- Exhibits108: Ctl Leather Inc. - Overview
- Exhibits109: Ctl Leather Inc. - Product / Service
- Exhibits110: Ctl Leather Inc. - Key offerings
- Exhibits111: Faurecia SA - Overview
- Exhibits112: Faurecia SA - Business segments
- Exhibits113: Faurecia SA - Key offerings
- Exhibits114: Faurecia SA - Segment focus
- Exhibits115: Gruppo Mastrotto Spa - Overview
- Exhibits116: Gruppo Mastrotto Spa - Product / Service
- Exhibits117: Gruppo Mastrotto Spa - Key offerings
- Exhibits118: Katzkin Leather Inc. - Overview
- Exhibits119: Katzkin Leather Inc. - Product / Service
- Exhibits120: Katzkin Leather Inc. - Key offerings
- Exhibits121: Lear Corp. - Overview
- Exhibits122: Lear Corp. - Business segments
- Exhibits123: Lear Corp. - Key offerings
- Exhibits124: Lear Corp. - Segment focus
- Exhibits125: Sage Automotive Interiors Inc. - Overview
- Exhibits126: Sage Automotive Interiors Inc. - Product / Service
- Exhibits127: Sage Automotive Interiors Inc. - Key offerings
- Exhibits128: Toyota Boshoku Corp. - Overview
- Exhibits129: Toyota Boshoku Corp. - Business segments
- Exhibits130: Toyota Boshoku Corp. - Key offerings
- Exhibits131: Toyota Boshoku Corp. - Segment focus
- Exhibits132: Wollsdorf Leder Schmidt and Co Ges.mbH - Overview
- Exhibits133: Wollsdorf Leder Schmidt and Co Ges.mbH - Product / Service
- Exhibits134: Wollsdorf Leder Schmidt and Co Ges.mbH - Key offerings
- Exhibits135: Inclusions checklist
- Exhibits136: Exclusions checklist
- Exhibits137: Currency conversion rates for US$
- Exhibits138: Research methodology
- Exhibits139: Information sources
- Exhibits140: Data validation
- Exhibits141: Validation techniques employed for market sizing
- Exhibits142: Data synthesis
- Exhibits143: 360 degree market analysis
- Exhibits144: List of abbreviations
Automotive Interior Leather Market 2024-2028
The automotive interior leather market is forecasted to grow by USD 16 bn during 2023-2028, accelerating at a CAGR of 9.5% during the forecast period. The report on the automotive interior leather market provides a holistic analysis, market size and forecast, trends, growth drivers, and challenges, as well as vendor analysis covering around 25 vendors.
The report offers an up-to-date analysis regarding the current market scenario, the latest trends and drivers, and the overall market environment. The market is driven by rise in improved passenger car sales due to financing flexibility, growing priority for comfort and safety in automobiles, and use of composite materials for weight reduction.
| Market Scope | |
|---|---|
| Base Year | 2024 |
| End Year | 2028 |
| Series Year | 2024-2028 |
| Growth Momentum | Accelerate |
| YOY 2024 | 8.6% |
| CAGR | 9.5% |
| Incremental Value | $16 bn |
Technavio's automotive interior leather market is segmented as below:
By Vehicle Type
- Passenger cars
- LCV
- HCV
By Geographical Landscape
- Europe
- APAC
- North America
- South America
- Middle East and Africa
This study identifies the innovations in lightweight materials as one of the prime reasons driving the automotive interior leather market growth during the next few years. Also, rise of integrated automotive interior leather and growing application of vegan leather in automotive interior will lead to sizable demand in the market.
The report on the automotive interior leather market covers the following areas:
- Automotive Interior Leather Market sizing
- Automotive Interior Leather Market forecast
- Automotive Interior Leather Market industry analysis
The robust vendor analysis is designed to help clients improve their market position, and in line with this, this report provides a detailed analysis of several leading automotive interior leather market vendors that include Adient Plc, Alfatex Italia Srl, Classic Soft Trim, Ctl Leather Inc., DK Schweizer Leather Sdn Bhd, Eissmann Automotive Deutschland GmbH, Elmo Sweden AB, Faurecia SA, GRUPO ANTOLIN IRAUSA S.A., Gruppo Mastrotto Spa, Katzkin Leather Inc., KURARAY Co. Ltd., Lear Corp., Mayur Uniquoters Ltd., Sage Automotive Interiors Inc., Scottish Leather Group Operations Ltd., SMS Auto Fabrics, Toyoda Gosei Co. Ltd., Toyota Boshoku Corp., and Wollsdorf Leder Schmidt and Co Ges.mbH. Also, the automotive interior leather market analysis report includes information on upcoming trends and challenges that will influence market growth. This is to help companies strategize and leverage all forthcoming growth opportunities.
The study was conducted using an objective combination of primary and secondary information including inputs from key participants in the industry. The report contains a comprehensive market and vendor landscape in addition to an analysis of the key vendors.
The publisher presents a detailed picture of the market by the way of study, synthesis, and summation of data from multiple sources by an analysis of key parameters such as profit, pricing, competition, and promotions. It presents various market facets by identifying the key industry influencers. The data presented is comprehensive, reliable, and a result of extensive primary and secondary research. The market research reports provide a complete competitive landscape and an in-depth vendor selection methodology and analysis using qualitative and quantitative research to forecast accurate market growth.
Table of Contents
1 Executive Summary
- 1.1 Market overview
- Executive Summary - Chart on Market Overview
- Executive Summary - Data Table on Market Overview
- Executive Summary - Chart on Global Market Characteristics
- Executive Summary - Chart on Market By Geographical Landscape
- Executive Summary - Chart on Market Segmentation by Vehicle Type
- Executive Summary - Chart on Incremental Growth
- Executive Summary - Data Table on Incremental Growth
- Executive Summary - Chart on Company Market Positioning
2 Market Landscape
- 2.1 Market ecosystem
- Parent Market
- Data Table on - Parent Market
- 2.2 Market characteristics
- Market characteristics analysis
- 2.3 Value chain analysis
- Value Chain Analysis
3 Market Sizing
- 3.1 Market definition
- Offerings of companies included in the market definition
- 3.2 Market segment analysis
- Market segments
- 3.3 Market size 2023
- 3.4 Market outlook: Forecast for 2023-2028
- Chart on Global - Market size and forecast 2023-2028 ($ billion)
- Data Table on Global - Market size and forecast 2023-2028 ($ billion)
- Chart on Global Market: Year-over-year growth 2023-2028 (%)
- Data Table on Global Market: Year-over-year growth 2023-2028 (%)
4 Historic Market Size
- 4.1 Global Automotive Interior Leather Market 2018 - 2022
- Historic Market Size - Data Table on Global Automotive Interior Leather Market 2018 - 2022 ($ billion)
- 4.2 Vehicle Type segment analysis 2018 - 2022
- Historic Market Size - Vehicle Type Segment 2018 - 2022 ($ billion)
- 4.3 Geography segment analysis 2018 - 2022
- Historic Market Size - Geography Segment 2018 - 2022 ($ billion)
- 4.4 Country segment analysis 2018 - 2022
- Historic Market Size - Country Segment 2018 - 2022 ($ billion)
5 Five Forces Analysis
- 5.1 Five forces summary
- Five forces analysis - Comparison between 2023 and 2028
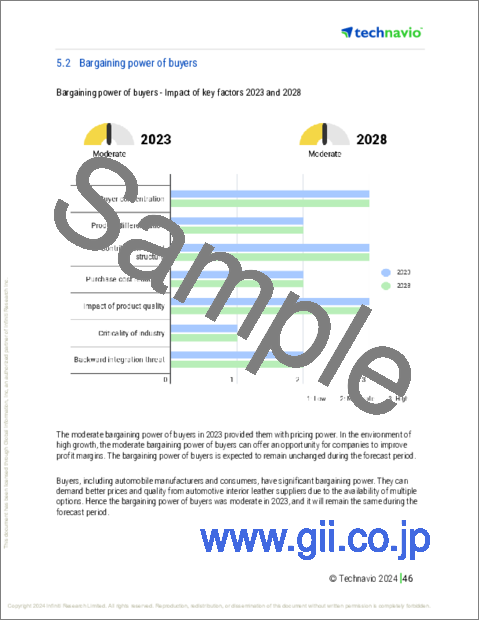
- 5.2 Bargaining power of buyers
- Bargaining power of buyers - Impact of key factors 2023 and 2028
- 5.3 Bargaining power of suppliers
- Bargaining power of suppliers - Impact of key factors in 2023 and 2028
- 5.4 Threat of new entrants
- Threat of new entrants - Impact of key factors in 2023 and 2028
- 5.5 Threat of substitutes
- Threat of substitutes - Impact of key factors in 2023 and 2028
- 5.6 Threat of rivalry
- Threat of rivalry - Impact of key factors in 2023 and 2028
- 5.7 Market condition
- Chart on Market condition - Five forces 2023 and 2028
6 Market Segmentation by Vehicle Type
- 6.1 Market segments
- Chart on Vehicle Type - Market share 2023-2028 (%)
- Data Table on Vehicle Type - Market share 2023-2028 (%)
- 6.2 Comparison by Vehicle Type
- Chart on Comparison by Vehicle Type
- Data Table on Comparison by Vehicle Type
- 6.3 Passenger cars - Market size and forecast 2023-2028
- Chart on Passenger cars - Market size and forecast 2023-2028 ($ billion)
- Data Table on Passenger cars - Market size and forecast 2023-2028 ($ billion)
- Chart on Passenger cars - Year-over-year growth 2023-2028 (%)
- Data Table on Passenger cars - Year-over-year growth 2023-2028 (%)
- 6.4 LCV - Market size and forecast 2023-2028
- Chart on LCV - Market size and forecast 2023-2028 ($ billion)
- Data Table on LCV - Market size and forecast 2023-2028 ($ billion)
- Chart on LCV - Year-over-year growth 2023-2028 (%)
- Data Table on LCV - Year-over-year growth 2023-2028 (%)
- 6.5 HCV - Market size and forecast 2023-2028
- Chart on HCV - Market size and forecast 2023-2028 ($ billion)
- Data Table on HCV - Market size and forecast 2023-2028 ($ billion)
- Chart on HCV - Year-over-year growth 2023-2028 (%)
- Data Table on HCV - Year-over-year growth 2023-2028 (%)
- 6.6 Market opportunity by Vehicle Type
- Market opportunity by Vehicle Type ($ billion)
- Data Table on Market opportunity by Vehicle Type ($ billion)
7 Customer Landscape
- 7.1 Customer landscape overview
- Analysis of price sensitivity, lifecycle, customer purchase basket, adoption rates, and purchase criteria
8 Geographic Landscape
- 8.1 Geographic segmentation
- Chart on Market share By Geographical Landscape 2023-2028 (%)
- Data Table on Market share By Geographical Landscape 2023-2028 (%)
- 8.2 Geographic comparison
- Chart on Geographic comparison
- Data Table on Geographic comparison
- 8.3 Europe - Market size and forecast 2023-2028
- Chart on Europe - Market size and forecast 2023-2028 ($ billion)
- Data Table on Europe - Market size and forecast 2023-2028 ($ billion)
- Chart on Europe - Year-over-year growth 2023-2028 (%)
- Data Table on Europe - Year-over-year growth 2023-2028 (%)
- 8.4 APAC - Market size and forecast 2023-2028
- Chart on APAC - Market size and forecast 2023-2028 ($ billion)
- Data Table on APAC - Market size and forecast 2023-2028 ($ billion)
- Chart on APAC - Year-over-year growth 2023-2028 (%)
- Data Table on APAC - Year-over-year growth 2023-2028 (%)
- 8.5 North America - Market size and forecast 2023-2028
- Chart on North America - Market size and forecast 2023-2028 ($ billion)
- Data Table on North America - Market size and forecast 2023-2028 ($ billion)
- Chart on North America - Year-over-year growth 2023-2028 (%)
- Data Table on North America - Year-over-year growth 2023-2028 (%)
- 8.6 South America - Market size and forecast 2023-2028
- Chart on South America - Market size and forecast 2023-2028 ($ billion)
- Data Table on South America - Market size and forecast 2023-2028 ($ billion)
- Chart on South America - Year-over-year growth 2023-2028 (%)
- Data Table on South America - Year-over-year growth 2023-2028 (%)
- 8.7 Middle East and Africa - Market size and forecast 2023-2028
- Chart on Middle East and Africa - Market size and forecast 2023-2028 ($ billion)
- Data Table on Middle East and Africa - Market size and forecast 2023-2028 ($ billion)
- Chart on Middle East and Africa - Year-over-year growth 2023-2028 (%)
- Data Table on Middle East and Africa - Year-over-year growth 2023-2028 (%)
- 8.8 Germany - Market size and forecast 2023-2028
- Chart on Germany - Market size and forecast 2023-2028 ($ billion)
- Data Table on Germany - Market size and forecast 2023-2028 ($ billion)
- Chart on Germany - Year-over-year growth 2023-2028 (%)
- Data Table on Germany - Year-over-year growth 2023-2028 (%)
- 8.9 China - Market size and forecast 2023-2028
- Chart on China - Market size and forecast 2023-2028 ($ billion)
- Data Table on China - Market size and forecast 2023-2028 ($ billion)
- Chart on China - Year-over-year growth 2023-2028 (%)
- Data Table on China - Year-over-year growth 2023-2028 (%)
- 8.10 US - Market size and forecast 2023-2028
- Chart on US - Market size and forecast 2023-2028 ($ billion)
- Data Table on US - Market size and forecast 2023-2028 ($ billion)
- Chart on US - Year-over-year growth 2023-2028 (%)
- Data Table on US - Year-over-year growth 2023-2028 (%)
- 8.11 France - Market size and forecast 2023-2028
- Chart on France - Market size and forecast 2023-2028 ($ billion)
- Data Table on France - Market size and forecast 2023-2028 ($ billion)
- Chart on France - Year-over-year growth 2023-2028 (%)
- Data Table on France - Year-over-year growth 2023-2028 (%)
- 8.12 Japan - Market size and forecast 2023-2028
- Chart on Japan - Market size and forecast 2023-2028 ($ billion)
- Data Table on Japan - Market size and forecast 2023-2028 ($ billion)
- Chart on Japan - Year-over-year growth 2023-2028 (%)
- Data Table on Japan - Year-over-year growth 2023-2028 (%)
- 8.13 Market opportunity By Geographical Landscape
- Market opportunity By Geographical Landscape ($ billion)
- Data Tables on Market opportunity By Geographical Landscape ($ billion)
9 Drivers, Challenges, and Opportunity/Restraints
- 9.1 Market drivers
- 9.2 Market challenges
- 9.3 Impact of drivers and challenges
- Impact of drivers and challenges in 2023 and 2028
- 9.4 Market opportunities/restraints
10 Competitive Landscape
- 10.1 Overview
- 10.2 Competitive Landscape
- Overview on criticality of inputs and factors of differentiation
- 10.3 Landscape disruption
- Overview on factors of disruption
- 10.4 Industry risks
- Impact of key risks on business
11 Competitive Analysis
- 11.1 Companies profiled
- Companies covered
- 11.2 Market positioning of companies
- Matrix on companies position and classification
- 11.3 Adient Plc
- Adient Plc - Overview
- Adient Plc - Business segments
- Adient Plc - Key offerings
- Adient Plc - Segment focus
- 11.4 Alfatex Italia Srl
- Alfatex Italia Srl - Overview
- Alfatex Italia Srl - Product / Service
- Alfatex Italia Srl - Key offerings
- 11.5 Ctl Leather Inc.
- Ctl Leather Inc. - Overview
- Ctl Leather Inc. - Product / Service
- Ctl Leather Inc. - Key offerings
- 11.6 Faurecia SA
- Faurecia SA - Overview
- Faurecia SA - Business segments
- Faurecia SA - Key offerings
- Faurecia SA - Segment focus
- 11.7 Gruppo Mastrotto Spa
- Gruppo Mastrotto Spa - Overview
- Gruppo Mastrotto Spa - Product / Service
- Gruppo Mastrotto Spa - Key offerings
- 11.8 Katzkin Leather Inc.
- Katzkin Leather Inc. - Overview
- Katzkin Leather Inc. - Product / Service
- Katzkin Leather Inc. - Key offerings
- 11.9 Lear Corp.
- Lear Corp. - Overview
- Lear Corp. - Business segments
- Lear Corp. - Key offerings
- Lear Corp. - Segment focus
- 11.10 Sage Automotive Interiors Inc.
- Sage Automotive Interiors Inc. - Overview
- Sage Automotive Interiors Inc. - Product / Service
- Sage Automotive Interiors Inc. - Key offerings
- 11.11 Toyota Boshoku Corp.
- Toyota Boshoku Corp. - Overview
- Toyota Boshoku Corp. - Business segments
- Toyota Boshoku Corp. - Key offerings
- Toyota Boshoku Corp. - Segment focus
- 11.12 Wollsdorf Leder Schmidt and Co Ges.mbH
- Wollsdorf Leder Schmidt and Co Ges.mbH - Overview
- Wollsdorf Leder Schmidt and Co Ges.mbH - Product / Service
- Wollsdorf Leder Schmidt and Co Ges.mbH - Key offerings
12 Appendix
- 12.1 Scope of the report
- 12.2 Inclusions and exclusions checklist
- Inclusions checklist
- Exclusions checklist
- 12.3 Currency conversion rates for US$
- Currency conversion rates for US$
- 12.4 Research methodology
- Research methodology
- 12.5 Data procurement
- Information sources
- 12.6 Data validation
- Data validation
- 12.7 Validation techniques employed for market sizing
- Validation techniques employed for market sizing
- 12.8 Data synthesis
- Data synthesis
- 12.9 360 degree market analysis
- 360 degree market analysis
- 12.10 List of abbreviations
- List of abbreviations

