|
|
市場調査レポート
商品コード
1777152
コネクテッドカーの世界市場 2025年~2029年Global Connected Car Market 2025-2029 |
||||||

|
|||||||
カスタマイズ可能
|
|||||||


| コネクテッドカーの世界市場 2025年~2029年 |
|
出版日: 2025年07月17日
発行: TechNavio
ページ情報: 英文 222 Pages
納期: 即納可能
|

全表示
- 概要
- 図表
- 目次
コネクテッドカー市場は2024年から2029年に1,389億5,830万米ドルとなり、予測期間中のCAGRは17.1%で成長すると予測されます。
当レポートでは、コネクテッドカー市場の全体的な分析、市場規模・予測、動向、成長促進要因、課題、約25のベンダーを網羅したベンダー分析などを掲載しています。
現在の市場シナリオ、最新動向と促進要因、市場環境全体に関する最新分析を提供しています。インターネット普及率の上昇とそれが世界のコネクテッドカー市場に与える影響、コネクテッドカーにおけるブロックチェーン技術の応用、車載の安全性を高めるための政府規制と安全制御の改善などが市場を牽引しています。
| 市場範囲 | |
|---|---|
| 基準年 | 2025年 |
| 終了年 | 2029年 |
| 予測期間 | 2025年~2029年 |
| 成長モメンタム | 加速 |
| 前年比 | 15.2% |
| CAGR | 17.1% |
| 増分額 | 1,389億5,830万米ドル |
本調査は、業界の主要参加者からのインプットを含め、一次情報と二次情報を客観的に組み合わせて実施しました。レポートには、主要企業の分析に加え、包括的な市場規模データ、地域別分析によるセグメント、ベンダー情勢が含まれています。レポートには過去データと予測データがあります。
本調査では、今後数年間のコネクテッドカー市場の成長を促進する主な要因の1つとして、コネクテッド技術を搭載した自動車の発売台数の増加を挙げています。また、コネクテッドカーが提供する安全性、モビリティ、環境面でのメリットや、コネクテッドカーが提供するビッグデータプラットフォームがさらなる市場開拓を推し進め、市場の大きな需要につながると考えられています。
目次
第1章 エグゼクティブサマリー
- 市場概要
第2章 Technavio分析
- 価格感度・ライフサイクル・顧客購入バスケット・採用率・購入基準の分析
- インプットの重要性と差別化の要因
- 混乱の要因
- 促進要因と課題の影響
第3章 市場情勢
- 市場エコシステム
- 市場の特徴
- バリューチェーン分析
第4章 市場規模
- 市場の定義
- 市場セグメント分析
- 市場規模、2024年
- 市場の見通し、2024年~2029年
第5章 市場規模実績
- コネクテッドカーの世界市場、2019年~2023年
- 接続セグメント分析、2019年~2023年
- エンドユーザーセグメント分析、2019年~2023年
- コミュニケーション技術セグメント分析、2019年~2023年
- 地域別セグメント分析、2019年~2023年
- 国別セグメント分析、2019年~2023年
第6章 定性分析
- AIの影響:コネクテッドカーの世界市場
第7章 ファイブフォース分析
- ファイブフォースの要約
- 買い手の交渉力
- 供給企業の交渉力
- 新規参入業者の脅威
- 代替品の脅威
- 競争の脅威
- 市況
第8章 市場セグメンテーション:接続性別
- 市場セグメント
- 比較:接続性別
- 組み込みソリューション:市場規模と予測、2024年~2029年
- 統合ソリューション:市場規模と予測、2024年~2029年
- テザーソリューション:市場規模と予測、2024年~2029年
- 市場機会:接続性別
第9章 市場セグメンテーション:エンドユーザー別
- 市場セグメント
- 比較:エンドユーザー別
- OEM:市場規模と予測、2024年~2029年
- アフターマーケット:市場規模と予測、2024年~2029年
- 市場機会:エンドユーザー別
第10章 市場セグメンテーション:通信技術別
- 市場セグメント
- 比較:通信技術別
- V2I:市場規模と予測、2024年~2029年
- V2X:市場規模と予測、2024年~2029年
- V2V:市場規模と予測、2024年~2029年
- 市場機会:通信技術別
第11章 顧客情勢
- 顧客情勢の概要
第12章 地域別情勢
- 地域別セグメンテーション
- 地域別比較
- 北米:市場規模と予測、2024年~2029年
- 欧州:市場規模と予測、2024年~2029年
- アジア太平洋:市場規模と予測、2024年~2029年
- 南米:市場規模と予測、2024年~2029年
- 中東・アフリカ:市場規模と予測、2024年~2029年
- 米国:市場規模と予測、2024年~2029年
- 中国:市場規模と予測、2024年~2029年
- 英国:市場規模と予測、2024年~2029年
- カナダ:市場規模と予測、2024年~2029年
- ドイツ:市場規模と予測、2024年~2029年
- インド:市場規模と予測、2024年~2029年
- フランス:市場規模と予測、2024年~2029年
- 日本:市場規模と予測、2024年~2029年
- 韓国:市場規模と予測、2024年~2029年
- イタリア:市場規模と予測、2024年~2029年
- 市場機会:地域情勢別
第13章 促進要因・課題・機会・抑制要因
- 市場促進要因
- 市場の課題
- 促進要因と課題の影響
- 市場の機会・抑制要因
第14章 競合情勢
- 概要
- 競合情勢
- 混乱の状況
- 業界のリスク
第15章 競合分析
- 企業プロファイル
- 企業ランキング指数
- 企業の市場ポジショニング
- Airbiquity Inc.
- Alps Alpine Co. Ltd.
- AT and T Inc.
- Bayerische Motoren Werke AG
- BorgWarner Inc.
- DXC Technology Co.
- Ford Motor Co.
- Information Technologies Institute Intellias LLC
- Mercedes Benz Group AG
- NXP Semiconductors NV
- Schaeffler AG
- Tesla Inc.
- Valeo SA
- Volkswagen AG
- Zubie Inc.
第16章 付録
Exhibits:
- Exhibits1: Executive Summary - Chart on Market Overview
- Exhibits2: Executive Summary - Data Table on Market Overview
- Exhibits3: Executive Summary - Chart on Global Market Characteristics
- Exhibits4: Executive Summary - Chart on Market By Geographical Landscape
- Exhibits5: Executive Summary - Chart on Market Segmentation by Connectivity
- Exhibits6: Executive Summary - Chart on Market Segmentation by End-user
- Exhibits7: Executive Summary - Chart on Market Segmentation by Communication Technology
- Exhibits8: Executive Summary - Chart on Incremental Growth
- Exhibits9: Executive Summary - Data Table on Incremental Growth
- Exhibits10: Executive Summary - Chart on Company Market Positioning
- Exhibits11: Analysis of price sensitivity, lifecycle, customer purchase basket, adoption rates, and purchase criteria
- Exhibits12: Overview on criticality of inputs and factors of differentiation
- Exhibits13: Overview on factors of disruption
- Exhibits14: Impact of drivers and challenges in 2024 and 2029
- Exhibits15: Parent Market
- Exhibits16: Data Table on - Parent Market
- Exhibits17: Market characteristics analysis
- Exhibits18: Value chain analysis
- Exhibits19: Offerings of companies included in the market definition
- Exhibits20: Market segments
- Exhibits21: Chart on Global - Market size and forecast 2024-2029 ($ million)
- Exhibits22: Data Table on Global - Market size and forecast 2024-2029 ($ million)
- Exhibits23: Chart on Global Market: Year-over-year growth 2024-2029 (%)
- Exhibits24: Data Table on Global Market: Year-over-year growth 2024-2029 (%)
- Exhibits25: Historic Market Size - Data Table on Global Connected Car Market 2019 - 2023 ($ million)
- Exhibits26: Historic Market Size - Connectivity Segment 2019 - 2023 ($ million)
- Exhibits27: Historic Market Size - End-user Segment 2019 - 2023 ($ million)
- Exhibits28: Historic Market Size - Communication Technology Segment 2019 - 2023 ($ million)
- Exhibits29: Historic Market Size - Geography Segment 2019 - 2023 ($ million)
- Exhibits30: Historic Market Size - Country Segment 2019 - 2023 ($ million)
- Exhibits31: Five forces analysis - Comparison between 2024 and 2029
- Exhibits32: Bargaining power of buyers - Impact of key factors 2024 and 2029
- Exhibits33: Bargaining power of suppliers - Impact of key factors in 2024 and 2029
- Exhibits34: Threat of new entrants - Impact of key factors in 2024 and 2029
- Exhibits35: Threat of substitutes - Impact of key factors in 2024 and 2029
- Exhibits36: Threat of rivalry - Impact of key factors in 2024 and 2029
- Exhibits37: Chart on Market condition - Five forces 2024 and 2029
- Exhibits38: Chart on Connectivity - Market share 2024-2029 (%)
- Exhibits39: Data Table on Connectivity - Market share 2024-2029 (%)
- Exhibits40: Chart on Comparison by Connectivity
- Exhibits41: Data Table on Comparison by Connectivity
- Exhibits42: Chart on Embedded solutions - Market size and forecast 2024-2029 ($ million)
- Exhibits43: Data Table on Embedded solutions - Market size and forecast 2024-2029 ($ million)
- Exhibits44: Chart on Embedded solutions - Year-over-year growth 2024-2029 (%)
- Exhibits45: Data Table on Embedded solutions - Year-over-year growth 2024-2029 (%)
- Exhibits46: Chart on Integrated solutions - Market size and forecast 2024-2029 ($ million)
- Exhibits47: Data Table on Integrated solutions - Market size and forecast 2024-2029 ($ million)
- Exhibits48: Chart on Integrated solutions - Year-over-year growth 2024-2029 (%)
- Exhibits49: Data Table on Integrated solutions - Year-over-year growth 2024-2029 (%)
- Exhibits50: Chart on Tethered solutions - Market size and forecast 2024-2029 ($ million)
- Exhibits51: Data Table on Tethered solutions - Market size and forecast 2024-2029 ($ million)
- Exhibits52: Chart on Tethered solutions - Year-over-year growth 2024-2029 (%)
- Exhibits53: Data Table on Tethered solutions - Year-over-year growth 2024-2029 (%)
- Exhibits54: Market opportunity by Connectivity ($ million)
- Exhibits55: Data Table on Market opportunity by Connectivity ($ million)
- Exhibits56: Chart on End-user - Market share 2024-2029 (%)
- Exhibits57: Data Table on End-user - Market share 2024-2029 (%)
- Exhibits58: Chart on Comparison by End-user
- Exhibits59: Data Table on Comparison by End-user
- Exhibits60: Chart on OEM - Market size and forecast 2024-2029 ($ million)
- Exhibits61: Data Table on OEM - Market size and forecast 2024-2029 ($ million)
- Exhibits62: Chart on OEM - Year-over-year growth 2024-2029 (%)
- Exhibits63: Data Table on OEM - Year-over-year growth 2024-2029 (%)
- Exhibits64: Chart on Aftermarket - Market size and forecast 2024-2029 ($ million)
- Exhibits65: Data Table on Aftermarket - Market size and forecast 2024-2029 ($ million)
- Exhibits66: Chart on Aftermarket - Year-over-year growth 2024-2029 (%)
- Exhibits67: Data Table on Aftermarket - Year-over-year growth 2024-2029 (%)
- Exhibits68: Market opportunity by End-user ($ million)
- Exhibits69: Data Table on Market opportunity by End-user ($ million)
- Exhibits70: Chart on Communication Technology - Market share 2024-2029 (%)
- Exhibits71: Data Table on Communication Technology - Market share 2024-2029 (%)
- Exhibits72: Chart on Comparison by Communication Technology
- Exhibits73: Data Table on Comparison by Communication Technology
- Exhibits74: Chart on V2I - Market size and forecast 2024-2029 ($ million)
- Exhibits75: Data Table on V2I - Market size and forecast 2024-2029 ($ million)
- Exhibits76: Chart on V2I - Year-over-year growth 2024-2029 (%)
- Exhibits77: Data Table on V2I - Year-over-year growth 2024-2029 (%)
- Exhibits78: Chart on V2X - Market size and forecast 2024-2029 ($ million)
- Exhibits79: Data Table on V2X - Market size and forecast 2024-2029 ($ million)
- Exhibits80: Chart on V2X - Year-over-year growth 2024-2029 (%)
- Exhibits81: Data Table on V2X - Year-over-year growth 2024-2029 (%)
- Exhibits82: Chart on V2V - Market size and forecast 2024-2029 ($ million)
- Exhibits83: Data Table on V2V - Market size and forecast 2024-2029 ($ million)
- Exhibits84: Chart on V2V - Year-over-year growth 2024-2029 (%)
- Exhibits85: Data Table on V2V - Year-over-year growth 2024-2029 (%)
- Exhibits86: Market opportunity by Communication Technology ($ million)
- Exhibits87: Data Table on Market opportunity by Communication Technology ($ million)
- Exhibits88: Analysis of price sensitivity, lifecycle, customer purchase basket, adoption rates, and purchase criteria
- Exhibits89: Chart on Market share By Geographical Landscape 2024-2029 (%)
- Exhibits90: Data Table on Market share By Geographical Landscape 2024-2029 (%)
- Exhibits91: Chart on Geographic comparison
- Exhibits92: Data Table on Geographic comparison
- Exhibits93: Chart on North America - Market size and forecast 2024-2029 ($ million)
- Exhibits94: Data Table on North America - Market size and forecast 2024-2029 ($ million)
- Exhibits95: Chart on North America - Year-over-year growth 2024-2029 (%)
- Exhibits96: Data Table on North America - Year-over-year growth 2024-2029 (%)
- Exhibits97: Chart on Europe - Market size and forecast 2024-2029 ($ million)
- Exhibits98: Data Table on Europe - Market size and forecast 2024-2029 ($ million)
- Exhibits99: Chart on Europe - Year-over-year growth 2024-2029 (%)
- Exhibits100: Data Table on Europe - Year-over-year growth 2024-2029 (%)
- Exhibits101: Chart on APAC - Market size and forecast 2024-2029 ($ million)
- Exhibits102: Data Table on APAC - Market size and forecast 2024-2029 ($ million)
- Exhibits103: Chart on APAC - Year-over-year growth 2024-2029 (%)
- Exhibits104: Data Table on APAC - Year-over-year growth 2024-2029 (%)
- Exhibits105: Chart on South America - Market size and forecast 2024-2029 ($ million)
- Exhibits106: Data Table on South America - Market size and forecast 2024-2029 ($ million)
- Exhibits107: Chart on South America - Year-over-year growth 2024-2029 (%)
- Exhibits108: Data Table on South America - Year-over-year growth 2024-2029 (%)
- Exhibits109: Chart on Middle East and Africa - Market size and forecast 2024-2029 ($ million)
- Exhibits110: Data Table on Middle East and Africa - Market size and forecast 2024-2029 ($ million)
- Exhibits111: Chart on Middle East and Africa - Year-over-year growth 2024-2029 (%)
- Exhibits112: Data Table on Middle East and Africa - Year-over-year growth 2024-2029 (%)
- Exhibits113: Chart on US - Market size and forecast 2024-2029 ($ million)
- Exhibits114: Data Table on US - Market size and forecast 2024-2029 ($ million)
- Exhibits115: Chart on US - Year-over-year growth 2024-2029 (%)
- Exhibits116: Data Table on US - Year-over-year growth 2024-2029 (%)
- Exhibits117: Chart on China - Market size and forecast 2024-2029 ($ million)
- Exhibits118: Data Table on China - Market size and forecast 2024-2029 ($ million)
- Exhibits119: Chart on China - Year-over-year growth 2024-2029 (%)
- Exhibits120: Data Table on China - Year-over-year growth 2024-2029 (%)
- Exhibits121: Chart on UK - Market size and forecast 2024-2029 ($ million)
- Exhibits122: Data Table on UK - Market size and forecast 2024-2029 ($ million)
- Exhibits123: Chart on UK - Year-over-year growth 2024-2029 (%)
- Exhibits124: Data Table on UK - Year-over-year growth 2024-2029 (%)
- Exhibits125: Chart on Canada - Market size and forecast 2024-2029 ($ million)
- Exhibits126: Data Table on Canada - Market size and forecast 2024-2029 ($ million)
- Exhibits127: Chart on Canada - Year-over-year growth 2024-2029 (%)
- Exhibits128: Data Table on Canada - Year-over-year growth 2024-2029 (%)
- Exhibits129: Chart on Germany - Market size and forecast 2024-2029 ($ million)
- Exhibits130: Data Table on Germany - Market size and forecast 2024-2029 ($ million)
- Exhibits131: Chart on Germany - Year-over-year growth 2024-2029 (%)
- Exhibits132: Data Table on Germany - Year-over-year growth 2024-2029 (%)
- Exhibits133: Chart on India - Market size and forecast 2024-2029 ($ million)
- Exhibits134: Data Table on India - Market size and forecast 2024-2029 ($ million)
- Exhibits135: Chart on India - Year-over-year growth 2024-2029 (%)
- Exhibits136: Data Table on India - Year-over-year growth 2024-2029 (%)
- Exhibits137: Chart on France - Market size and forecast 2024-2029 ($ million)
- Exhibits138: Data Table on France - Market size and forecast 2024-2029 ($ million)
- Exhibits139: Chart on France - Year-over-year growth 2024-2029 (%)
- Exhibits140: Data Table on France - Year-over-year growth 2024-2029 (%)
- Exhibits141: Chart on Japan - Market size and forecast 2024-2029 ($ million)
- Exhibits142: Data Table on Japan - Market size and forecast 2024-2029 ($ million)
- Exhibits143: Chart on Japan - Year-over-year growth 2024-2029 (%)
- Exhibits144: Data Table on Japan - Year-over-year growth 2024-2029 (%)
- Exhibits145: Chart on South Korea - Market size and forecast 2024-2029 ($ million)
- Exhibits146: Data Table on South Korea - Market size and forecast 2024-2029 ($ million)
- Exhibits147: Chart on South Korea - Year-over-year growth 2024-2029 (%)
- Exhibits148: Data Table on South Korea - Year-over-year growth 2024-2029 (%)
- Exhibits149: Chart on Italy - Market size and forecast 2024-2029 ($ million)
- Exhibits150: Data Table on Italy - Market size and forecast 2024-2029 ($ million)
- Exhibits151: Chart on Italy - Year-over-year growth 2024-2029 (%)
- Exhibits152: Data Table on Italy - Year-over-year growth 2024-2029 (%)
- Exhibits153: Market opportunity By Geographical Landscape ($ million)
- Exhibits154: Data Tables on Market opportunity By Geographical Landscape ($ million)
- Exhibits155: Impact of drivers and challenges in 2024 and 2029
- Exhibits156: Overview on criticality of inputs and factors of differentiation
- Exhibits157: Overview on factors of disruption
- Exhibits158: Impact of key risks on business
- Exhibits159: Companies covered
- Exhibits160: Company ranking index
- Exhibits161: Matrix on companies position and classification
- Exhibits162: Airbiquity Inc. - Overview
- Exhibits163: Airbiquity Inc. - Product / Service
- Exhibits164: Airbiquity Inc. - Key offerings
- Exhibits165: SWOT
- Exhibits166: Alps Alpine Co. Ltd. - Overview
- Exhibits167: Alps Alpine Co. Ltd. - Business segments
- Exhibits168: Alps Alpine Co. Ltd. - Key news
- Exhibits169: Alps Alpine Co. Ltd. - Key offerings
- Exhibits170: Alps Alpine Co. Ltd. - Segment focus
- Exhibits171: SWOT
- Exhibits172: AT and T Inc. - Overview
- Exhibits173: AT and T Inc. - Business segments
- Exhibits174: AT and T Inc. - Key news
- Exhibits175: AT and T Inc. - Key offerings
- Exhibits176: AT and T Inc. - Segment focus
- Exhibits177: SWOT
- Exhibits178: Bayerische Motoren Werke AG - Overview
- Exhibits179: Bayerische Motoren Werke AG - Business segments
- Exhibits180: Bayerische Motoren Werke AG - Key offerings
- Exhibits181: Bayerische Motoren Werke AG - Segment focus
- Exhibits182: SWOT
- Exhibits183: BorgWarner Inc. - Overview
- Exhibits184: BorgWarner Inc. - Business segments
- Exhibits185: BorgWarner Inc. - Key news
- Exhibits186: BorgWarner Inc. - Key offerings
- Exhibits187: BorgWarner Inc. - Segment focus
- Exhibits188: SWOT
- Exhibits189: DXC Technology Co. - Overview
- Exhibits190: DXC Technology Co. - Business segments
- Exhibits191: DXC Technology Co. - Key news
- Exhibits192: DXC Technology Co. - Key offerings
- Exhibits193: DXC Technology Co. - Segment focus
- Exhibits194: SWOT
- Exhibits195: Ford Motor Co. - Overview
- Exhibits196: Ford Motor Co. - Business segments
- Exhibits197: Ford Motor Co. - Key offerings
- Exhibits198: Ford Motor Co. - Segment focus
- Exhibits199: SWOT
- Exhibits200: Information Technologies Institute Intellias LLC - Overview
- Exhibits201: Information Technologies Institute Intellias LLC - Product / Service
- Exhibits202: Information Technologies Institute Intellias LLC - Key offerings
- Exhibits203: SWOT
- Exhibits204: Mercedes Benz Group AG - Overview
- Exhibits205: Mercedes Benz Group AG - Product / Service
- Exhibits206: Mercedes Benz Group AG - Key offerings
- Exhibits207: SWOT
- Exhibits208: NXP Semiconductors NV - Overview
- Exhibits209: NXP Semiconductors NV - Product / Service
- Exhibits210: NXP Semiconductors NV - Key offerings
- Exhibits211: SWOT
- Exhibits212: Schaeffler AG - Overview
- Exhibits213: Schaeffler AG - Business segments
- Exhibits214: Schaeffler AG - Key news
- Exhibits215: Schaeffler AG - Key offerings
- Exhibits216: Schaeffler AG - Segment focus
- Exhibits217: SWOT
- Exhibits218: Tesla Inc. - Overview
- Exhibits219: Tesla Inc. - Business segments
- Exhibits220: Tesla Inc. - Key news
- Exhibits221: Tesla Inc. - Key offerings
- Exhibits222: Tesla Inc. - Segment focus
- Exhibits223: SWOT
- Exhibits224: Valeo SA - Overview
- Exhibits225: Valeo SA - Business segments
- Exhibits226: Valeo SA - Key news
- Exhibits227: Valeo SA - Key offerings
- Exhibits228: Valeo SA - Segment focus
- Exhibits229: SWOT
- Exhibits230: Volkswagen AG - Overview
- Exhibits231: Volkswagen AG - Business segments
- Exhibits232: Volkswagen AG - Key news
- Exhibits233: Volkswagen AG - Key offerings
- Exhibits234: Volkswagen AG - Segment focus
- Exhibits235: SWOT
- Exhibits236: Zubie Inc. - Overview
- Exhibits237: Zubie Inc. - Product / Service
- Exhibits238: Zubie Inc. - Key offerings
- Exhibits239: SWOT
- Exhibits240: Inclusions checklist
- Exhibits241: Exclusions checklist
- Exhibits242: Currency conversion rates for US$
- Exhibits243: Research methodology
- Exhibits244: Information sources
- Exhibits245: Data validation
- Exhibits246: Validation techniques employed for market sizing
- Exhibits247: Data synthesis
- Exhibits248: 360 degree market analysis
- Exhibits249: List of abbreviations
The connected car market is forecasted to grow by USD 138,958.3 mn during 2024-2029, accelerating at a CAGR of 17.1% during the forecast period. The report on the connected car market provides a holistic analysis, market size and forecast, trends, growth drivers, and challenges, as well as vendor analysis covering around 25 vendors.
The report offers an up-to-date analysis regarding the current market scenario, the latest trends and drivers, and the overall market environment. The market is driven by increasing internet penetration and its impact on global connected car market, applications of blockchain technology in connected cars, and government regulations to increase in-vehicle safety and improvement in safety controls.
| Market Scope | |
|---|---|
| Base Year | 2025 |
| End Year | 2029 |
| Series Year | 2025-2029 |
| Growth Momentum | Accelerate |
| YOY 2025 | 15.2% |
| CAGR | 17.1% |
| Incremental Value | $138,958.3 mn |
The study was conducted using an objective combination of primary and secondary information including inputs from key participants in the industry. The report contains a comprehensive market size data, segment with regional analysis and vendor landscape in addition to an analysis of the key companies. Reports have historic and forecast data.
Technavio's connected car market is segmented as below:
By Connectivity
- Embedded solutions
- Integrated solutions
- Tethered solutions
By End-user
- OEM
- Aftermarket
By Communication Technology
- V2I
- V2X
- V2V
By Geographical Landscape
- North America
- Europe
- APAC
- South America
- Middle East and Africa
This study identifies the increasing number of vehicles launches featuring connected technologies as one of the prime reasons driving the connected car market growth during the next few years. Also, safety, mobility, and environmental benefits offered by connected cars and big data platform provided by connected cars to push further developments will lead to sizable demand in the market.
The report on the connected car market covers the following areas:
- Connected Car Market sizing
- Connected Car Market forecast
- Connected Car Market industry analysis
The robust vendor analysis is designed to help clients improve their market position, and in line with this, this report provides a detailed analysis of several leading connected car market vendors that include Airbiquity Inc., Alps Alpine Co. Ltd., AT and T Inc., Bayerische Motoren Werke AG, BorgWarner Inc., DXC Technology Co., Ford Motor Co., Information Technologies Institute Intellias LLC, Mercedes Benz Group AG, NXP Semiconductors NV, Qualcomm Inc., Robert Bosch GmbH, Samsung Electronics Co. Ltd., Schaeffler AG, Sierra Wireless Inc., Telefonica SA, Tesla Inc., Valeo SA, Volkswagen AG, and Zubie Inc.. Also, the connected car market analysis report includes information on upcoming trends and challenges that will influence market growth. This is to help companies strategize and leverage all forthcoming growth opportunities.
The publisher presents a detailed picture of the market by the way of study, synthesis, and summation of data from multiple sources by an analysis of key parameters such as profit, pricing, competition, and promotions. It presents various market facets by identifying the key industry influencers. The data presented is comprehensive, reliable, and a result of extensive primary and secondary research. The market research reports provide a complete competitive landscape and an in-depth vendor selection methodology and analysis using qualitative and quantitative research to forecast accurate market growth.
Table of Contents
1 Executive Summary
- 1.1 Market overview
- Executive Summary - Chart on Market Overview
- Executive Summary - Data Table on Market Overview
- Executive Summary - Chart on Global Market Characteristics
- Executive Summary - Chart on Market By Geographical Landscape
- Executive Summary - Chart on Market Segmentation by Connectivity
- Executive Summary - Chart on Market Segmentation by End-user
- Executive Summary - Chart on Market Segmentation by Communication Technology
- Executive Summary - Chart on Incremental Growth
- Executive Summary - Data Table on Incremental Growth
- Executive Summary - Chart on Company Market Positioning
2 Technavio Analysis
- 2.1 Analysis of price sensitivity, lifecycle, customer purchase basket, adoption rates, and purchase criteria
- Analysis of price sensitivity, lifecycle, customer purchase basket, adoption rates, and purchase criteria
- 2.2 Criticality of inputs and Factors of differentiation
- Overview on criticality of inputs and factors of differentiation
- 2.3 Factors of disruption
- Overview on factors of disruption
- 2.4 Impact of drivers and challenges
- Impact of drivers and challenges in 2024 and 2029
3 Market Landscape
- 3.1 Market ecosystem
- Parent Market
- Data Table on - Parent Market
- 3.2 Market characteristics
- Market characteristics analysis
- 3.3 Value chain analysis
- Value chain analysis
4 Market Sizing
- 4.1 Market definition
- Offerings of companies included in the market definition
- 4.2 Market segment analysis
- Market segments
- 4.3 Market size 2024
- 4.4 Market outlook: Forecast for 2024-2029
- Chart on Global - Market size and forecast 2024-2029 ($ million)
- Data Table on Global - Market size and forecast 2024-2029 ($ million)
- Chart on Global Market: Year-over-year growth 2024-2029 (%)
- Data Table on Global Market: Year-over-year growth 2024-2029 (%)
5 Historic Market Size
- 5.1 Global Connected Car Market 2019 - 2023
- Historic Market Size - Data Table on Global Connected Car Market 2019 - 2023 ($ million)
- 5.2 Connectivity segment analysis 2019 - 2023
- Historic Market Size - Connectivity Segment 2019 - 2023 ($ million)
- 5.3 End-user segment analysis 2019 - 2023
- Historic Market Size - End-user Segment 2019 - 2023 ($ million)
- 5.4 Communication Technology segment analysis 2019 - 2023
- Historic Market Size - Communication Technology Segment 2019 - 2023 ($ million)
- 5.5 Geography segment analysis 2019 - 2023
- Historic Market Size - Geography Segment 2019 - 2023 ($ million)
- 5.6 Country segment analysis 2019 - 2023
- Historic Market Size - Country Segment 2019 - 2023 ($ million)
6 Qualitative Analysis
- 6.1 The AI impact on Global Connected Car Market
7 Five Forces Analysis
- 7.1 Five forces summary
- Five forces analysis - Comparison between 2024 and 2029
- 7.2 Bargaining power of buyers
- Bargaining power of buyers - Impact of key factors 2024 and 2029
- 7.3 Bargaining power of suppliers
- Bargaining power of suppliers - Impact of key factors in 2024 and 2029
- 7.4 Threat of new entrants
- Threat of new entrants - Impact of key factors in 2024 and 2029
- 7.5 Threat of substitutes
- Threat of substitutes - Impact of key factors in 2024 and 2029
- 7.6 Threat of rivalry
- Threat of rivalry - Impact of key factors in 2024 and 2029
- 7.7 Market condition
- Chart on Market condition - Five forces 2024 and 2029
8 Market Segmentation by Connectivity
- 8.1 Market segments
- Chart on Connectivity - Market share 2024-2029 (%)
- Data Table on Connectivity - Market share 2024-2029 (%)
- 8.2 Comparison by Connectivity
- Chart on Comparison by Connectivity
- Data Table on Comparison by Connectivity
- 8.3 Embedded solutions - Market size and forecast 2024-2029
- Chart on Embedded solutions - Market size and forecast 2024-2029 ($ million)
- Data Table on Embedded solutions - Market size and forecast 2024-2029 ($ million)
- Chart on Embedded solutions - Year-over-year growth 2024-2029 (%)
- Data Table on Embedded solutions - Year-over-year growth 2024-2029 (%)
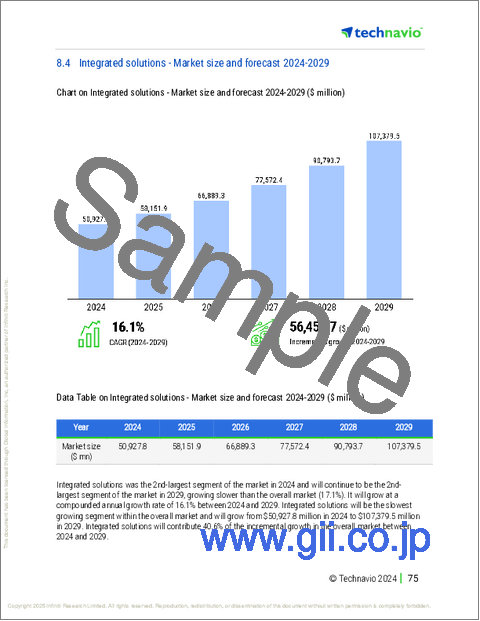
- 8.4 Integrated solutions - Market size and forecast 2024-2029
- Chart on Integrated solutions - Market size and forecast 2024-2029 ($ million)
- Data Table on Integrated solutions - Market size and forecast 2024-2029 ($ million)
- Chart on Integrated solutions - Year-over-year growth 2024-2029 (%)
- Data Table on Integrated solutions - Year-over-year growth 2024-2029 (%)
- 8.5 Tethered solutions - Market size and forecast 2024-2029
- Chart on Tethered solutions - Market size and forecast 2024-2029 ($ million)
- Data Table on Tethered solutions - Market size and forecast 2024-2029 ($ million)
- Chart on Tethered solutions - Year-over-year growth 2024-2029 (%)
- Data Table on Tethered solutions - Year-over-year growth 2024-2029 (%)
- 8.6 Market opportunity by Connectivity
- Market opportunity by Connectivity ($ million)
- Data Table on Market opportunity by Connectivity ($ million)
9 Market Segmentation by End-user
- 9.1 Market segments
- Chart on End-user - Market share 2024-2029 (%)
- Data Table on End-user - Market share 2024-2029 (%)
- 9.2 Comparison by End-user
- Chart on Comparison by End-user
- Data Table on Comparison by End-user
- 9.3 OEM - Market size and forecast 2024-2029
- Chart on OEM - Market size and forecast 2024-2029 ($ million)
- Data Table on OEM - Market size and forecast 2024-2029 ($ million)
- Chart on OEM - Year-over-year growth 2024-2029 (%)
- Data Table on OEM - Year-over-year growth 2024-2029 (%)
- 9.4 Aftermarket - Market size and forecast 2024-2029
- Chart on Aftermarket - Market size and forecast 2024-2029 ($ million)
- Data Table on Aftermarket - Market size and forecast 2024-2029 ($ million)
- Chart on Aftermarket - Year-over-year growth 2024-2029 (%)
- Data Table on Aftermarket - Year-over-year growth 2024-2029 (%)
- 9.5 Market opportunity by End-user
- Market opportunity by End-user ($ million)
- Data Table on Market opportunity by End-user ($ million)
10 Market Segmentation by Communication Technology
- 10.1 Market segments
- Chart on Communication Technology - Market share 2024-2029 (%)
- Data Table on Communication Technology - Market share 2024-2029 (%)
- 10.2 Comparison by Communication Technology
- Chart on Comparison by Communication Technology
- Data Table on Comparison by Communication Technology
- 10.3 V2I - Market size and forecast 2024-2029
- Chart on V2I - Market size and forecast 2024-2029 ($ million)
- Data Table on V2I - Market size and forecast 2024-2029 ($ million)
- Chart on V2I - Year-over-year growth 2024-2029 (%)
- Data Table on V2I - Year-over-year growth 2024-2029 (%)
- 10.4 V2X - Market size and forecast 2024-2029
- Chart on V2X - Market size and forecast 2024-2029 ($ million)
- Data Table on V2X - Market size and forecast 2024-2029 ($ million)
- Chart on V2X - Year-over-year growth 2024-2029 (%)
- Data Table on V2X - Year-over-year growth 2024-2029 (%)
- 10.5 V2V - Market size and forecast 2024-2029
- Chart on V2V - Market size and forecast 2024-2029 ($ million)
- Data Table on V2V - Market size and forecast 2024-2029 ($ million)
- Chart on V2V - Year-over-year growth 2024-2029 (%)
- Data Table on V2V - Year-over-year growth 2024-2029 (%)
- 10.6 Market opportunity by Communication Technology
- Market opportunity by Communication Technology ($ million)
- Data Table on Market opportunity by Communication Technology ($ million)
11 Customer Landscape
- 11.1 Customer landscape overview
- Analysis of price sensitivity, lifecycle, customer purchase basket, adoption rates, and purchase criteria
12 Geographic Landscape
- 12.1 Geographic segmentation
- Chart on Market share By Geographical Landscape 2024-2029 (%)
- Data Table on Market share By Geographical Landscape 2024-2029 (%)
- 12.2 Geographic comparison
- Chart on Geographic comparison
- Data Table on Geographic comparison
- 12.3 North America - Market size and forecast 2024-2029
- Chart on North America - Market size and forecast 2024-2029 ($ million)
- Data Table on North America - Market size and forecast 2024-2029 ($ million)
- Chart on North America - Year-over-year growth 2024-2029 (%)
- Data Table on North America - Year-over-year growth 2024-2029 (%)
- 12.4 Europe - Market size and forecast 2024-2029
- Chart on Europe - Market size and forecast 2024-2029 ($ million)
- Data Table on Europe - Market size and forecast 2024-2029 ($ million)
- Chart on Europe - Year-over-year growth 2024-2029 (%)
- Data Table on Europe - Year-over-year growth 2024-2029 (%)
- 12.5 APAC - Market size and forecast 2024-2029
- Chart on APAC - Market size and forecast 2024-2029 ($ million)
- Data Table on APAC - Market size and forecast 2024-2029 ($ million)
- Chart on APAC - Year-over-year growth 2024-2029 (%)
- Data Table on APAC - Year-over-year growth 2024-2029 (%)
- 12.6 South America - Market size and forecast 2024-2029
- Chart on South America - Market size and forecast 2024-2029 ($ million)
- Data Table on South America - Market size and forecast 2024-2029 ($ million)
- Chart on South America - Year-over-year growth 2024-2029 (%)
- Data Table on South America - Year-over-year growth 2024-2029 (%)
- 12.7 Middle East and Africa - Market size and forecast 2024-2029
- Chart on Middle East and Africa - Market size and forecast 2024-2029 ($ million)
- Data Table on Middle East and Africa - Market size and forecast 2024-2029 ($ million)
- Chart on Middle East and Africa - Year-over-year growth 2024-2029 (%)
- Data Table on Middle East and Africa - Year-over-year growth 2024-2029 (%)
- 12.8 US - Market size and forecast 2024-2029
- Chart on US - Market size and forecast 2024-2029 ($ million)
- Data Table on US - Market size and forecast 2024-2029 ($ million)
- Chart on US - Year-over-year growth 2024-2029 (%)
- Data Table on US - Year-over-year growth 2024-2029 (%)
- 12.9 China - Market size and forecast 2024-2029
- Chart on China - Market size and forecast 2024-2029 ($ million)
- Data Table on China - Market size and forecast 2024-2029 ($ million)
- Chart on China - Year-over-year growth 2024-2029 (%)
- Data Table on China - Year-over-year growth 2024-2029 (%)
- 12.10 UK - Market size and forecast 2024-2029
- Chart on UK - Market size and forecast 2024-2029 ($ million)
- Data Table on UK - Market size and forecast 2024-2029 ($ million)
- Chart on UK - Year-over-year growth 2024-2029 (%)
- Data Table on UK - Year-over-year growth 2024-2029 (%)
- 12.11 Canada - Market size and forecast 2024-2029
- Chart on Canada - Market size and forecast 2024-2029 ($ million)
- Data Table on Canada - Market size and forecast 2024-2029 ($ million)
- Chart on Canada - Year-over-year growth 2024-2029 (%)
- Data Table on Canada - Year-over-year growth 2024-2029 (%)
- 12.12 Germany - Market size and forecast 2024-2029
- Chart on Germany - Market size and forecast 2024-2029 ($ million)
- Data Table on Germany - Market size and forecast 2024-2029 ($ million)
- Chart on Germany - Year-over-year growth 2024-2029 (%)
- Data Table on Germany - Year-over-year growth 2024-2029 (%)
- 12.13 India - Market size and forecast 2024-2029
- Chart on India - Market size and forecast 2024-2029 ($ million)
- Data Table on India - Market size and forecast 2024-2029 ($ million)
- Chart on India - Year-over-year growth 2024-2029 (%)
- Data Table on India - Year-over-year growth 2024-2029 (%)
- 12.14 France - Market size and forecast 2024-2029
- Chart on France - Market size and forecast 2024-2029 ($ million)
- Data Table on France - Market size and forecast 2024-2029 ($ million)
- Chart on France - Year-over-year growth 2024-2029 (%)
- Data Table on France - Year-over-year growth 2024-2029 (%)
- 12.15 Japan - Market size and forecast 2024-2029
- Chart on Japan - Market size and forecast 2024-2029 ($ million)
- Data Table on Japan - Market size and forecast 2024-2029 ($ million)
- Chart on Japan - Year-over-year growth 2024-2029 (%)
- Data Table on Japan - Year-over-year growth 2024-2029 (%)
- 12.16 South Korea - Market size and forecast 2024-2029
- Chart on South Korea - Market size and forecast 2024-2029 ($ million)
- Data Table on South Korea - Market size and forecast 2024-2029 ($ million)
- Chart on South Korea - Year-over-year growth 2024-2029 (%)
- Data Table on South Korea - Year-over-year growth 2024-2029 (%)
- 12.17 Italy - Market size and forecast 2024-2029
- Chart on Italy - Market size and forecast 2024-2029 ($ million)
- Data Table on Italy - Market size and forecast 2024-2029 ($ million)
- Chart on Italy - Year-over-year growth 2024-2029 (%)
- Data Table on Italy - Year-over-year growth 2024-2029 (%)
- 12.18 Market opportunity By Geographical Landscape
- Market opportunity By Geographical Landscape ($ million)
- Data Tables on Market opportunity By Geographical Landscape ($ million)
13 Drivers, Challenges, and Opportunity/Restraints
- 13.1 Market drivers
- 13.2 Market challenges
- 13.3 Impact of drivers and challenges
- Impact of drivers and challenges in 2024 and 2029
- 13.4 Market opportunities/restraints
14 Competitive Landscape
- 14.1 Overview
- 14.2 Competitive Landscape
- Overview on criticality of inputs and factors of differentiation
- 14.3 Landscape disruption
- Overview on factors of disruption
- 14.4 Industry risks
- Impact of key risks on business
15 Competitive Analysis
- 15.1 Companies profiled
- Companies covered
- 15.2 Company ranking index
- Company ranking index
- 15.3 Market positioning of companies
- Matrix on companies position and classification
- 15.4 Airbiquity Inc.
- Airbiquity Inc. - Overview
- Airbiquity Inc. - Product / Service
- Airbiquity Inc. - Key offerings
- SWOT
- 15.5 Alps Alpine Co. Ltd.
- Alps Alpine Co. Ltd. - Overview
- Alps Alpine Co. Ltd. - Business segments
- Alps Alpine Co. Ltd. - Key news
- Alps Alpine Co. Ltd. - Key offerings
- Alps Alpine Co. Ltd. - Segment focus
- SWOT
- 15.6 AT and T Inc.
- AT and T Inc. - Overview
- AT and T Inc. - Business segments
- AT and T Inc. - Key news
- AT and T Inc. - Key offerings
- AT and T Inc. - Segment focus
- SWOT
- 15.7 Bayerische Motoren Werke AG
- Bayerische Motoren Werke AG - Overview
- Bayerische Motoren Werke AG - Business segments
- Bayerische Motoren Werke AG - Key offerings
- Bayerische Motoren Werke AG - Segment focus
- SWOT
- 15.8 BorgWarner Inc.
- BorgWarner Inc. - Overview
- BorgWarner Inc. - Business segments
- BorgWarner Inc. - Key news
- BorgWarner Inc. - Key offerings
- BorgWarner Inc. - Segment focus
- SWOT
- 15.9 DXC Technology Co.
- DXC Technology Co. - Overview
- DXC Technology Co. - Business segments
- DXC Technology Co. - Key news
- DXC Technology Co. - Key offerings
- DXC Technology Co. - Segment focus
- SWOT
- 15.10 Ford Motor Co.
- Ford Motor Co. - Overview
- Ford Motor Co. - Business segments
- Ford Motor Co. - Key offerings
- Ford Motor Co. - Segment focus
- SWOT
- 15.11 Information Technologies Institute Intellias LLC
- Information Technologies Institute Intellias LLC - Overview
- Information Technologies Institute Intellias LLC - Product / Service
- Information Technologies Institute Intellias LLC - Key offerings
- SWOT
- 15.12 Mercedes Benz Group AG
- Mercedes Benz Group AG - Overview
- Mercedes Benz Group AG - Product / Service
- Mercedes Benz Group AG - Key offerings
- SWOT
- 15.13 NXP Semiconductors NV
- NXP Semiconductors NV - Overview
- NXP Semiconductors NV - Product / Service
- NXP Semiconductors NV - Key offerings
- SWOT
- 15.14 Schaeffler AG
- Schaeffler AG - Overview
- Schaeffler AG - Business segments
- Schaeffler AG - Key news
- Schaeffler AG - Key offerings
- Schaeffler AG - Segment focus
- SWOT
- 15.15 Tesla Inc.
- Tesla Inc. - Overview
- Tesla Inc. - Business segments
- Tesla Inc. - Key news
- Tesla Inc. - Key offerings
- Tesla Inc. - Segment focus
- SWOT
- 15.16 Valeo SA
- Valeo SA - Overview
- Valeo SA - Business segments
- Valeo SA - Key news
- Valeo SA - Key offerings
- Valeo SA - Segment focus
- SWOT
- 15.17 Volkswagen AG
- Volkswagen AG - Overview
- Volkswagen AG - Business segments
- Volkswagen AG - Key news
- Volkswagen AG - Key offerings
- Volkswagen AG - Segment focus
- SWOT
- 15.18 Zubie Inc.
- Zubie Inc. - Overview
- Zubie Inc. - Product / Service
- Zubie Inc. - Key offerings
- SWOT
16 Appendix
- 16.1 Scope of the report
- 16.2 Inclusions and exclusions checklist
- Inclusions checklist
- Exclusions checklist
- 16.3 Currency conversion rates for US$
- Currency conversion rates for US$
- 16.4 Research methodology
- Research methodology
- 16.5 Data procurement
- Information sources
- 16.6 Data validation
- Data validation
- 16.7 Validation techniques employed for market sizing
- Validation techniques employed for market sizing
- 16.8 Data synthesis
- Data synthesis
- 16.9 360 degree market analysis
- 360 degree market analysis
- 16.10 List of abbreviations
- List of abbreviations

