|
|
市場調査レポート
商品コード
1911260
ヘルスケアサービスの世界市場、2026年~2030年Global Healthcare Services Market 2026-2030 |
||||||

|
|||||||
カスタマイズ可能
|
|||||||

| ヘルスケアサービスの世界市場、2026年~2030年 |
|
出版日: 2026年01月14日
発行: TechNavio
ページ情報: 英文 302 Pages
納期: 即納可能
|

概要
世界のヘルスケアサービス市場は、2025年から2030年の間に7兆5,899億米ドル規模に成長し、予測期間中のCAGRは9.1%と予測されております。
本報告書では、世界のヘルスケアサービス市場に関する包括的な分析、市場規模と予測、動向、成長要因、課題に加え、約25社のベンダー分析を提供しております。
本レポートは、現在の市場状況、最新の動向と促進要因、市場環境全般に関する最新の分析を提供します。市場は、慢性疾患の増加、世界の高齢人口の増加、ヘルスケアサービスにおける患者満足度への注目の高まりによって牽引されています。
本調査は、業界の主要関係者からの情報をはじめとする一次情報と二次情報を客観的に組み合わせて実施されました。本レポートには、主要企業の分析に加え、包括的な市場規模データ、地域別分析を伴うセグメント、ベンダー情勢が含まれています。レポートには過去データと予測データが掲載されています。
| 市場範囲 | |
|---|---|
| 基準年 | 2026年 |
| 終了年 | 2030年 |
| 予測期間 | 2026-2030 |
| 成長モメンタム | 加速 |
| 前年比2026年 | 8.3% |
| CAGR | 9.1% |
| 増分額 | 7兆5,899億米ドル |
本調査では、今後数年間における世界のヘルスケアサービス市場成長を牽引する主要要因の一つとして、ヘルスケア分野における遠隔医療の導入拡大を挙げております。また、個別化医療の普及拡大ならびにヘルスケア分野における人工知能(AI)および機械学習(ML)の統合が進むことで、市場において相当な需要が生じると見込まれております。
目次
第1章 エグゼクティブサマリー
- 市場概要
第2章 Technavio分析
- 価格・ライフサイクル・顧客購入バスケット・採用率・購入基準の分析
- インプットの重要性と差別化の要因
- 混乱の要因
- 促進要因と課題の影響
第3章 市場情勢
- 市場エコシステム
- 市場の特徴
- バリューチェーン分析
第4章 市場規模
- 市場の定義
- 市場セグメント分析
- 市場規模 2025
- 市場の見通し 2025-2030
第5章 市場規模実績
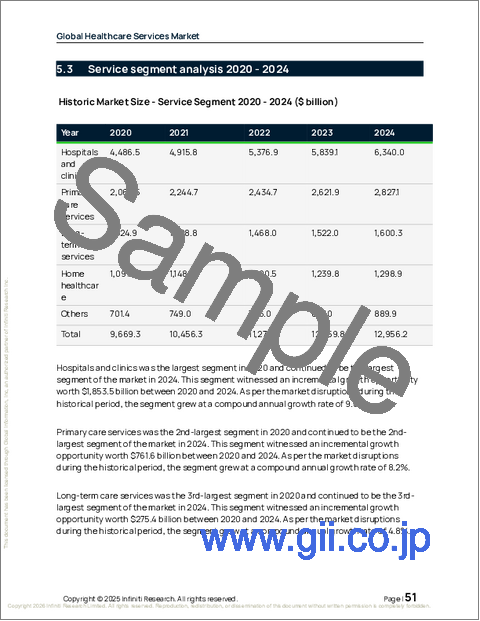
- 世界のヘルスケアサービス市場 2020-2024
- エンドユーザー別セグメント分析 2020-2024
- サービス別セグメント分析 2020-2024
- サービス別タイプセグメント分析 2020-2024
- 地域別セグメント分析 2020-2024
- 国別セグメント分析 2020-2024
第6章 定性分析
- AIの影響:世界のヘルスケアサービス市場
第7章 ファイブフォース分析
- ファイブフォースの要約
- 買い手の交渉力
- 供給企業の交渉力
- 新規参入業者の脅威
- 代替品の脅威
- 競争の脅威
- 市況
第8章 市場セグメンテーション:エンドユーザー別
- 市場セグメント
- 比較:エンドユーザー別
- 成人向け介護:市場規模と予測 2025-2030
- 高齢者ケア:市場規模と予測 2025-2030
- 小児医療:市場規模と予測 2025-2030
- 市場機会:エンドユーザー別
第9章 市場セグメンテーション:サービス別
- 市場セグメント
- 比較:サービス別
- 病院・診療所:市場規模と予測 2025-2030
- プライマリケアサービス:市場規模と予測 2025-2030
- 長期療養サービス:市場規模と予測 2025-2030
- 在宅ヘルスケア:市場規模と予測 2025-2030
- その他:市場規模と予測 2025-2030
- 市場機会:サービス別
第10章 市場セグメンテーション:サービスタイプ別
- 市場セグメント
- 比較:サービスタイプ別
- 公的保険:市場規模と予測 2025-2030
- 民間保険:市場規模と予測 2025-2030
- 自己負担:市場規模と予測 2025-2030
- 市場機会:サービスタイプ別
第11章 顧客情勢
- 顧客情勢の概要
第12章 地域別情勢
- 地域別セグメンテーション
- 地域別比較
- 北米:市場規模と予測 2025-2030
- 欧州:市場規模と予測 2025-2030
- アジア:市場規模と予測 2025-2030
- 世界のその他の地域:市場規模と予測 2025-2030
- 市場機会:地域別
第13章 促進要因、課題、および機会
- 市場促進要因
- 市場の課題
- 促進要因と課題の影響
- 市場機会
第14章 競合情勢
- 概要
- 競合情勢
- 混乱の状況
- 業界のリスク
第15章 競合分析
- 企業プロファイル
- 企業ランキング指標
- 企業の市場ポジショニング
- Apollo Hospitals Enterprise Ltd.
- Athenahealth Inc.
- Community Health Systems Inc.
- CVS Health Corp.
- DaVita Inc.
- Dr. Lal PathLabs Ltd.
- Fresenius Medical Co. KGaA
- Max Healthcare Institute Ltd
- McKesson Corp.
- OMH HealthEdge Holdings LLC
- Optum Inc.
- Quest Diagnostics Inc.
- Sonic Healthcare Ltd.
- Universal Health Services Inc
- West Suffolk NHS Foundation Trust

