|
|
市場調査レポート
商品コード
1502144
スパイスと調味料の世界市場 2024-2028Global spices and seasonings market 2024-2028 |
||||||
|
|||||||
カスタマイズ可能
|
|||||||


| スパイスと調味料の世界市場 2024-2028 |
|
出版日: 2024年05月20日
発行: TechNavio
ページ情報: 英文 177 Pages
納期: 即納可能
|

全表示
- 概要
- 図表
- 目次
Technavio社は、スパイスと調味料市場を調査し、2023年から2028年にかけて66億3,250万米ドル、予測期間中のCAGRは5.52%で成長すると予測しています。
当レポートでは、スパイスと調味料市場の全体的な分析、市場規模・予測、動向、成長促進要因、課題、約25のベンダーを網羅したベンダー分析などを掲載しています。
現在の市場シナリオ、最新動向と促進要因、市場環境全体に関する最新分析を提供しています。市場は、スパイスの医療効果に対する意識の高まり、エスニック料理の人気の高まり、すぐに使えるスパイスミックスへの需要の高まりによって牽引されています。
| 市場範囲 | |
|---|---|
| 基準年 | 2024 |
| 終了年 | 2028 |
| 予測期間 | 2024-2028 |
| 成長モメンタム | 加速 |
| 前年比2024年 | 5.12% |
| CAGR | 5.52% |
| 増分額 | 66億3,250万米ドル |
本調査では、今後数年間のスパイスと調味料市場成長を牽引する主な要因の一つとして、大手企業による戦略的買収の増加を挙げています。また、プライベートブランド(PB)の増加やオーガニックスパイスと調味料に対する需要の高まりも、市場の大きな需要につながると思われます。
目次
第1章 エグゼクティブサマリー
- 市場概要
第2章 市場情勢
- 市場エコシステム
- 市場の特徴
- バリューチェーン分析
第3章 市場規模の評価
- 市場の定義
- 市場セグメント分析
- 市場規模 2023
- 市場の見通し 2023-2028
第4章 市場規模実績
- 世界スパイスと調味料市場 2018-2022
- エンドユーザー別セグメント分析 2018-2022
- 製品別セグメント分析 2018-2022
- 地域別セグメント分析 2018-2022
- 国別セグメント分析 2018-2022
第5章 ファイブフォース分析
- ファイブフォースの要約
- 買い手の交渉力
- 供給企業の交渉力
- 新規参入業者の脅威
- 代替品の脅威
- 競争の脅威
- 市況
第6章 市場セグメンテーション:エンドユーザー別
- 市場セグメンテーション
- 比較:エンドユーザー別
- 小売り:市場規模と予測 2023-2028
- 食品サービス:市場規模と予測 2023-2028
- 産業:市場規模と予測 2023-2028
- 市場機会:エンドユーザー別
第7章 市場セグメンテーション:製品別
- 市場セグメンテーション
- 比較:製品別
- 塩および塩の代替品:市場規模と予測 2023-2028
- コショウ:市場規模と予測 2023-2028
- 乾燥ハーブ:市場規模と予測 2023-2028
- 個別のスパイス:市場規模と予測 2023-2028
- 市場機会:製品別
第8章 顧客情勢
- 顧客情勢の概要
第9章 地域別情勢
- 地域別セグメンテーション
- 地域別比較
- 北米:市場規模と予測 2023-2028
- 欧州:市場規模と予測 2023-2028
- アジア太平洋:市場規模と予測 2023-2028
- 南米:市場規模と予測 2023-2028
- 中東・アフリカ:市場規模と予測 2023-2028
- 米国:市場規模と予測 2023-2028
- 中国:市場規模と予測 2023-2028
- インド:市場規模と予測 2023-2028
- 英国:市場規模と予測 2023-2028
- ドイツ:市場規模と予測 2023-2028
- 市場機会:地域別
第10章 促進要因・課題・機会・抑制要因
- 市場促進要因
- 市場の課題
- 促進要因と課題の影響
- 市場の機会・抑制要因
第11章 競合情勢
- 概要
- 競合情勢
- 混乱の状況
- 業界のリスク
第12章 競合分析
- 企業プロファイル
- 企業の市場ポジショニング
- Ajinomoto Co. Inc.
- ARIAKE JAPAN Co. Ltd.
- Associated British Foods Plc
- C.H. Guenther and Son Inc.
- De Silva Brothers and Co.
- Dohler GmbH
- DS Group
- EVEREST Food Products Pvt. Ltd.
- Frontier Co op
- Fuchs North America
- Kerry Group Plc
- Mahashian Di Hatti Pvt. Ltd.
- McCormick and Co. Inc.
- Organic Spices Inc.
- The Kraft Heinz Co.
第13章 付録
Exhibits:
- Exhibits1: Executive Summary - Chart on Market Overview
- Exhibits2: Executive Summary - Data Table on Market Overview
- Exhibits3: Executive Summary - Chart on Global Market Characteristics
- Exhibits4: Executive Summary - Chart on Market by Geography
- Exhibits5: Executive Summary - Chart on Market Segmentation by End-user
- Exhibits6: Executive Summary - Chart on Market Segmentation by Product
- Exhibits7: Executive Summary - Chart on Incremental Growth
- Exhibits8: Executive Summary - Data Table on Incremental Growth
- Exhibits9: Executive Summary - Chart on Company Market Positioning
- Exhibits10: Parent Market
- Exhibits11: Data Table on - Parent Market
- Exhibits12: Market characteristics analysis
- Exhibits13: Value Chain Analysis
- Exhibits14: Offerings of companies included in the market definition
- Exhibits15: Market segments
- Exhibits16: Chart on Global - Market size and forecast 2023-2028 ($ million)
- Exhibits17: Data Table on Global - Market size and forecast 2023-2028 ($ million)
- Exhibits18: Chart on Global Market: Year-over-year growth 2023-2028 (%)
- Exhibits19: Data Table on Global Market: Year-over-year growth 2023-2028 (%)
- Exhibits20: Historic Market Size - Data Table on Global Spices And Seasonings Market 2018 - 2022 ($ million)
- Exhibits21: Historic Market Size - End-user Segment 2018 - 2022 ($ million)
- Exhibits22: Historic Market Size - Product Segment 2018 - 2022 ($ million)
- Exhibits23: Historic Market Size - Geography Segment 2018 - 2022 ($ million)
- Exhibits24: Historic Market Size - Country Segment 2018 - 2022 ($ million)
- Exhibits25: Five forces analysis - Comparison between 2023 and 2028
- Exhibits26: Bargaining power of buyers - Impact of key factors 2023 and 2028
- Exhibits27: Bargaining power of suppliers - Impact of key factors in 2023 and 2028
- Exhibits28: Threat of new entrants - Impact of key factors in 2023 and 2028
- Exhibits29: Threat of substitutes - Impact of key factors in 2023 and 2028
- Exhibits30: Threat of rivalry - Impact of key factors in 2023 and 2028
- Exhibits31: Chart on Market condition - Five forces 2023 and 2028
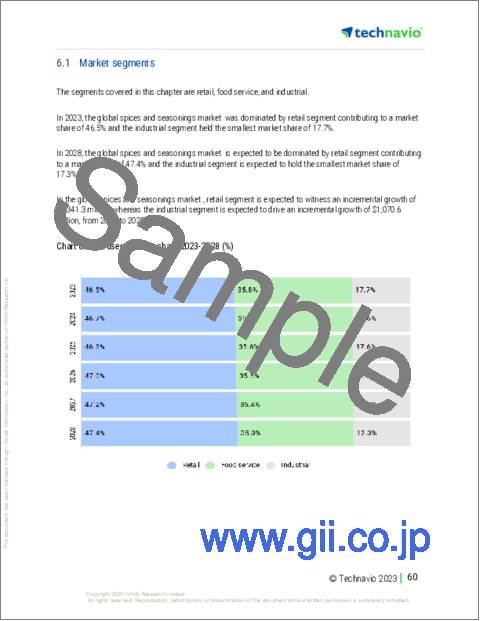
- Exhibits32: Chart on End-user - Market share 2023-2028 (%)
- Exhibits33: Data Table on End-user - Market share 2023-2028 (%)
- Exhibits34: Chart on Comparison by End-user
- Exhibits35: Data Table on Comparison by End-user
- Exhibits36: Chart on Retail - Market size and forecast 2023-2028 ($ million)
- Exhibits37: Data Table on Retail - Market size and forecast 2023-2028 ($ million)
- Exhibits38: Chart on Retail - Year-over-year growth 2023-2028 (%)
- Exhibits39: Data Table on Retail - Year-over-year growth 2023-2028 (%)
- Exhibits40: Chart on Food service - Market size and forecast 2023-2028 ($ million)
- Exhibits41: Data Table on Food service - Market size and forecast 2023-2028 ($ million)
- Exhibits42: Chart on Food service - Year-over-year growth 2023-2028 (%)
- Exhibits43: Data Table on Food service - Year-over-year growth 2023-2028 (%)
- Exhibits44: Chart on Industrial - Market size and forecast 2023-2028 ($ million)
- Exhibits45: Data Table on Industrial - Market size and forecast 2023-2028 ($ million)
- Exhibits46: Chart on Industrial - Year-over-year growth 2023-2028 (%)
- Exhibits47: Data Table on Industrial - Year-over-year growth 2023-2028 (%)
- Exhibits48: Market opportunity by End-user ($ million)
- Exhibits49: Data Table on Market opportunity by End-user ($ million)
- Exhibits50: Chart on Product - Market share 2023-2028 (%)
- Exhibits51: Data Table on Product - Market share 2023-2028 (%)
- Exhibits52: Chart on Comparison by Product
- Exhibits53: Data Table on Comparison by Product
- Exhibits54: Chart on Salt and salt substitutes - Market size and forecast 2023-2028 ($ million)
- Exhibits55: Data Table on Salt and salt substitutes - Market size and forecast 2023-2028 ($ million)
- Exhibits56: Chart on Salt and salt substitutes - Year-over-year growth 2023-2028 (%)
- Exhibits57: Data Table on Salt and salt substitutes - Year-over-year growth 2023-2028 (%)
- Exhibits58: Chart on Pepper - Market size and forecast 2023-2028 ($ million)
- Exhibits59: Data Table on Pepper - Market size and forecast 2023-2028 ($ million)
- Exhibits60: Chart on Pepper - Year-over-year growth 2023-2028 (%)
- Exhibits61: Data Table on Pepper - Year-over-year growth 2023-2028 (%)
- Exhibits62: Chart on Dried herbs - Market size and forecast 2023-2028 ($ million)
- Exhibits63: Data Table on Dried herbs - Market size and forecast 2023-2028 ($ million)
- Exhibits64: Chart on Dried herbs - Year-over-year growth 2023-2028 (%)
- Exhibits65: Data Table on Dried herbs - Year-over-year growth 2023-2028 (%)
- Exhibits66: Chart on Individual spices - Market size and forecast 2023-2028 ($ million)
- Exhibits67: Data Table on Individual spices - Market size and forecast 2023-2028 ($ million)
- Exhibits68: Chart on Individual spices - Year-over-year growth 2023-2028 (%)
- Exhibits69: Data Table on Individual spices - Year-over-year growth 2023-2028 (%)
- Exhibits70: Market opportunity by Product ($ million)
- Exhibits71: Data Table on Market opportunity by Product ($ million)
- Exhibits72: Analysis of price sensitivity, lifecycle, customer purchase basket, adoption rates, and purchase criteria
- Exhibits73: Chart on Market share By Geographical Landscape2023-2028 (%)
- Exhibits74: Data Table on Market share By Geographical Landscape2023-2028 (%)
- Exhibits75: Chart on Geographic comparison
- Exhibits76: Data Table on Geographic comparison
- Exhibits77: Chart on North America - Market size and forecast 2023-2028 ($ million)
- Exhibits78: Data Table on North America - Market size and forecast 2023-2028 ($ million)
- Exhibits79: Chart on North America - Year-over-year growth 2023-2028 (%)
- Exhibits80: Data Table on North America - Year-over-year growth 2023-2028 (%)
- Exhibits81: Chart on Europe - Market size and forecast 2023-2028 ($ million)
- Exhibits82: Data Table on Europe - Market size and forecast 2023-2028 ($ million)
- Exhibits83: Chart on Europe - Year-over-year growth 2023-2028 (%)
- Exhibits84: Data Table on Europe - Year-over-year growth 2023-2028 (%)
- Exhibits85: Chart on APAC - Market size and forecast 2023-2028 ($ million)
- Exhibits86: Data Table on APAC - Market size and forecast 2023-2028 ($ million)
- Exhibits87: Chart on APAC - Year-over-year growth 2023-2028 (%)
- Exhibits88: Data Table on APAC - Year-over-year growth 2023-2028 (%)
- Exhibits89: Chart on South America - Market size and forecast 2023-2028 ($ million)
- Exhibits90: Data Table on South America - Market size and forecast 2023-2028 ($ million)
- Exhibits91: Chart on South America - Year-over-year growth 2023-2028 (%)
- Exhibits92: Data Table on South America - Year-over-year growth 2023-2028 (%)
- Exhibits93: Chart on Middle East and Africa - Market size and forecast 2023-2028 ($ million)
- Exhibits94: Data Table on Middle East and Africa - Market size and forecast 2023-2028 ($ million)
- Exhibits95: Chart on Middle East and Africa - Year-over-year growth 2023-2028 (%)
- Exhibits96: Data Table on Middle East and Africa - Year-over-year growth 2023-2028 (%)
- Exhibits97: Chart on US - Market size and forecast 2023-2028 ($ million)
- Exhibits98: Data Table on US - Market size and forecast 2023-2028 ($ million)
- Exhibits99: Chart on US - Year-over-year growth 2023-2028 (%)
- Exhibits100: Data Table on US - Year-over-year growth 2023-2028 (%)
- Exhibits101: Chart on China - Market size and forecast 2023-2028 ($ million)
- Exhibits102: Data Table on China - Market size and forecast 2023-2028 ($ million)
- Exhibits103: Chart on China - Year-over-year growth 2023-2028 (%)
- Exhibits104: Data Table on China - Year-over-year growth 2023-2028 (%)
- Exhibits105: Chart on India - Market size and forecast 2023-2028 ($ million)
- Exhibits106: Data Table on India - Market size and forecast 2023-2028 ($ million)
- Exhibits107: Chart on India - Year-over-year growth 2023-2028 (%)
- Exhibits108: Data Table on India - Year-over-year growth 2023-2028 (%)
- Exhibits109: Chart on UK - Market size and forecast 2023-2028 ($ million)
- Exhibits110: Data Table on UK - Market size and forecast 2023-2028 ($ million)
- Exhibits111: Chart on UK - Year-over-year growth 2023-2028 (%)
- Exhibits112: Data Table on UK - Year-over-year growth 2023-2028 (%)
- Exhibits113: Chart on Germany - Market size and forecast 2023-2028 ($ million)
- Exhibits114: Data Table on Germany - Market size and forecast 2023-2028 ($ million)
- Exhibits115: Chart on Germany - Year-over-year growth 2023-2028 (%)
- Exhibits116: Data Table on Germany - Year-over-year growth 2023-2028 (%)
- Exhibits117: Market opportunity By Geographical Landscape($ million)
- Exhibits118: Data Tables on Market opportunity By Geographical Landscape($ million)
- Exhibits119: Impact of drivers and challenges in 2023 and 2028
- Exhibits120: Overview on criticality of inputs and factors of differentiation
- Exhibits121: Overview on factors of disruption
- Exhibits122: Impact of key risks on business
- Exhibits123: Companies covered
- Exhibits124: Matrix on companies position and classification
- Exhibits125: Ajinomoto Co. Inc. - Overview
- Exhibits126: Ajinomoto Co. Inc. - Business segments
- Exhibits127: Ajinomoto Co. Inc. - Key offerings
- Exhibits128: Ajinomoto Co. Inc. - Segment focus
- Exhibits129: ARIAKE JAPAN Co. Ltd. - Overview
- Exhibits130: ARIAKE JAPAN Co. Ltd. - Product / Service
- Exhibits131: ARIAKE JAPAN Co. Ltd. - Key offerings
- Exhibits132: Associated British Foods Plc - Overview
- Exhibits133: Associated British Foods Plc - Business segments
- Exhibits134: Associated British Foods Plc - Key offerings
- Exhibits135: Associated British Foods Plc - Segment focus
- Exhibits136: C.H. Guenther and Son Inc. - Overview
- Exhibits137: C.H. Guenther and Son Inc. - Product / Service
- Exhibits138: C.H. Guenther and Son Inc. - Key offerings
- Exhibits139: De Silva Brothers and Co. - Overview
- Exhibits140: De Silva Brothers and Co. - Product / Service
- Exhibits141: De Silva Brothers and Co. - Key offerings
- Exhibits142: Dohler GmbH - Overview
- Exhibits143: Dohler GmbH - Product / Service
- Exhibits144: Dohler GmbH - Key offerings
- Exhibits145: DS Group - Overview
- Exhibits146: DS Group - Product / Service
- Exhibits147: DS Group - Key offerings
- Exhibits148: EVEREST Food Products Pvt. Ltd. - Overview
- Exhibits149: EVEREST Food Products Pvt. Ltd. - Product / Service
- Exhibits150: EVEREST Food Products Pvt. Ltd. - Key offerings
- Exhibits151: Frontier Co op - Overview
- Exhibits152: Frontier Co op - Product / Service
- Exhibits153: Frontier Co op - Key offerings
- Exhibits154: Fuchs North America - Overview
- Exhibits155: Fuchs North America - Product / Service
- Exhibits156: Fuchs North America - Key offerings
- Exhibits157: Kerry Group Plc - Overview
- Exhibits158: Kerry Group Plc - Business segments
- Exhibits159: Kerry Group Plc - Key offerings
- Exhibits160: Kerry Group Plc - Segment focus
- Exhibits161: Mahashian Di Hatti Pvt. Ltd. - Overview
- Exhibits162: Mahashian Di Hatti Pvt. Ltd. - Product / Service
- Exhibits163: Mahashian Di Hatti Pvt. Ltd. - Key offerings
- Exhibits164: McCormick and Co. Inc. - Overview
- Exhibits165: McCormick and Co. Inc. - Business segments
- Exhibits166: McCormick and Co. Inc. - Key offerings
- Exhibits167: McCormick and Co. Inc. - Segment focus
- Exhibits168: Organic Spices Inc. - Overview
- Exhibits169: Organic Spices Inc. - Product / Service
- Exhibits170: Organic Spices Inc. - Key offerings
- Exhibits171: The Kraft Heinz Co. - Overview
- Exhibits172: The Kraft Heinz Co. - Business segments
- Exhibits173: The Kraft Heinz Co. - Key offerings
- Exhibits174: The Kraft Heinz Co. - Segment focus
- Exhibits175: Inclusions checklist
- Exhibits176: Exclusions checklist
- Exhibits177: Currency conversion rates for US$
- Exhibits178: Research methodology
- Exhibits179: Information sources
- Exhibits180: Data validation
- Exhibits181: Validation techniques employed for market sizing
- Exhibits182: Data synthesis
- Exhibits183: 360 degree market analysis
- Exhibits184: List of abbreviations
Technavio has been monitoring the spices and seasonings market and is forecast to grow by USD 6632.5 mn during 2023-2028, accelerating at a CAGR of 5.52% during the forecast period. Our report on the spices and seasonings market provides a holistic analysis, market size and forecast, trends, growth drivers, and challenges, as well as vendor analysis covering around 25 vendors.
The report offers an up-to-date analysis regarding the current market scenario, the latest trends and drivers, and the overall market environment. The market is driven by growing awareness of medical benefits of spices, rising popularity of ethnic cuisines, and growing demand for ready-to-use spice mixes.
Technavio's spices and seasonings market is segmented as below:
| Market Scope | |
|---|---|
| Base Year | 2024 |
| End Year | 2028 |
| Series Year | 2024-2028 |
| Growth Momentum | Accelerate |
| YOY 2024 | 5.12% |
| CAGR | 5.52% |
| Incremental Value | $6632.5mn |
By End-user
- Retail
- Food service
- Industrial
By Product
- Salt and salt substitutes
- Pepper
- Dried herbs
- Individual spices
By Geography
- North America
- Europe
- APAC
- South America
- Middle East and Africa
This study identifies the growing strategic acquisitions among major players as one of the prime reasons driving the spices and seasonings market growth during the next few years. Also, rising number of private-label brands and rising demand for organic spices and seasonings will lead to sizable demand in the market.
Technavio presents a detailed picture of the market by the way of study, synthesis, and summation of data from multiple sources by an analysis of key parameters. Our report on the spices and seasonings market covers the following areas:
- Spices and seasonings market sizing
- Spices and seasonings market forecast
- Spices and seasonings market industry analysis
Technavio's robust vendor analysis is designed to help clients improve their market position, and in line with this, this report provides a detailed analysis of several leading spices and seasonings market vendors that include Ajinomoto Co. Inc., ARIAKE Japan Co. Ltd., Associated British Foods Plc, Badshah Masala, C.H. Guenther and Son Inc., De Silva Brothers and Co., Dohler GmbH, DS Group, EVEREST Food Products Pvt. Ltd., Frontier Co op, Fuchs North America, Kerry Group Plc, Mahashian Di Hatti Pvt. Ltd., McCormick and Co. Inc., Organic Spices Inc., Patanjali Ayurved Ltd., The Kraft Heinz Co., Unilever PLC, Woodland Foods Ltd., and Zoff Foods Pvt. Ltd.. Also, the spices and seasonings market analysis report includes information on upcoming trends and challenges that will influence market growth. This is to help companies strategize and leverage all forthcoming growth opportunities.
The study was conducted using an objective combination of primary and secondary information including inputs from key participants in the industry. The report contains a comprehensive market and vendor landscape in addition to an analysis of the key vendors.
Technavio presents a detailed picture of the market by the way of study, synthesis, and summation of data from multiple sources by an analysis of key parameters such as profit, pricing, competition, and promotions. It presents various market facets by identifying the key industry influencers. The data presented is comprehensive, reliable, and a result of extensive research - both primary and secondary. Technavio's market research reports provide a complete competitive landscape and an in-depth vendor selection methodology and analysis using qualitative and quantitative research to forecast accurate market growth.
Table of Contents
1 Executive Summary
- 1.1 Market overview
- Executive Summary - Chart on Market Overview
- Executive Summary - Data Table on Market Overview
- Executive Summary - Chart on Global Market Characteristics
- Executive Summary - Chart on Market by Geography
- Executive Summary - Chart on Market Segmentation by End-user
- Executive Summary - Chart on Market Segmentation by Product
- Executive Summary - Chart on Incremental Growth
- Executive Summary - Data Table on Incremental Growth
- Executive Summary - Chart on Company Market Positioning
2 Market Landscape
- 2.1 Market ecosystem
- Parent Market
- Data Table on - Parent Market
- 2.2 Market characteristics
- Market characteristics analysis
- 2.3 Value chain analysis
- Value Chain Analysis
3 Market Sizing
- 3.1 Market definition
- Offerings of companies included in the market definition
- 3.2 Market segment analysis
- Market segments
- 3.3 Market size 2023
- 3.4 Market outlook: Forecast for 2023-2028
- Chart on Global - Market size and forecast 2023-2028 ($ million)
- Data Table on Global - Market size and forecast 2023-2028 ($ million)
- Chart on Global Market: Year-over-year growth 2023-2028 (%)
- Data Table on Global Market: Year-over-year growth 2023-2028 (%)
4 Historic Market Size
- 4.1 Global Spices And Seasonings Market 2018 - 2022
- Historic Market Size - Data Table on Global Spices And Seasonings Market 2018 - 2022 ($ million)
- 4.2 End-user segment analysis 2018 - 2022
- Historic Market Size - End-user Segment 2018 - 2022 ($ million)
- 4.3 Product segment analysis 2018 - 2022
- Historic Market Size - Product Segment 2018 - 2022 ($ million)
- 4.4 Geography segment analysis 2018 - 2022
- Historic Market Size - Geography Segment 2018 - 2022 ($ million)
- 4.5 Country segment analysis 2018 - 2022
- Historic Market Size - Country Segment 2018 - 2022 ($ million)
5 Five Forces Analysis
- 5.1 Five forces summary
- Five forces analysis - Comparison between 2023 and 2028
- 5.2 Bargaining power of buyers
- Bargaining power of buyers - Impact of key factors 2023 and 2028
- 5.3 Bargaining power of suppliers
- Bargaining power of suppliers - Impact of key factors in 2023 and 2028
- 5.4 Threat of new entrants
- Threat of new entrants - Impact of key factors in 2023 and 2028
- 5.5 Threat of substitutes
- Threat of substitutes - Impact of key factors in 2023 and 2028
- 5.6 Threat of rivalry
- Threat of rivalry - Impact of key factors in 2023 and 2028
- 5.7 Market condition
- Chart on Market condition - Five forces 2023 and 2028
6 Market Segmentation by End-user
- 6.1 Market segments
- Chart on End-user - Market share 2023-2028 (%)
- Data Table on End-user - Market share 2023-2028 (%)
- 6.2 Comparison by End-user
- Chart on Comparison by End-user
- Data Table on Comparison by End-user
- 6.3 Retail - Market size and forecast 2023-2028
- Chart on Retail - Market size and forecast 2023-2028 ($ million)
- Data Table on Retail - Market size and forecast 2023-2028 ($ million)
- Chart on Retail - Year-over-year growth 2023-2028 (%)
- Data Table on Retail - Year-over-year growth 2023-2028 (%)
- 6.4 Food service - Market size and forecast 2023-2028
- Chart on Food service - Market size and forecast 2023-2028 ($ million)
- Data Table on Food service - Market size and forecast 2023-2028 ($ million)
- Chart on Food service - Year-over-year growth 2023-2028 (%)
- Data Table on Food service - Year-over-year growth 2023-2028 (%)
- 6.5 Industrial - Market size and forecast 2023-2028
- Chart on Industrial - Market size and forecast 2023-2028 ($ million)
- Data Table on Industrial - Market size and forecast 2023-2028 ($ million)
- Chart on Industrial - Year-over-year growth 2023-2028 (%)
- Data Table on Industrial - Year-over-year growth 2023-2028 (%)
- 6.6 Market opportunity by End-user
- Market opportunity by End-user ($ million)
- Data Table on Market opportunity by End-user ($ million)
7 Market Segmentation by Product
- 7.1 Market segments
- Chart on Product - Market share 2023-2028 (%)
- Data Table on Product - Market share 2023-2028 (%)
- 7.2 Comparison by Product
- Chart on Comparison by Product
- Data Table on Comparison by Product
- 7.3 Salt and salt substitutes - Market size and forecast 2023-2028
- Chart on Salt and salt substitutes - Market size and forecast 2023-2028 ($ million)
- Data Table on Salt and salt substitutes - Market size and forecast 2023-2028 ($ million)
- Chart on Salt and salt substitutes - Year-over-year growth 2023-2028 (%)
- Data Table on Salt and salt substitutes - Year-over-year growth 2023-2028 (%)
- 7.4 Pepper - Market size and forecast 2023-2028
- Chart on Pepper - Market size and forecast 2023-2028 ($ million)
- Data Table on Pepper - Market size and forecast 2023-2028 ($ million)
- Chart on Pepper - Year-over-year growth 2023-2028 (%)
- Data Table on Pepper - Year-over-year growth 2023-2028 (%)
- 7.5 Dried herbs - Market size and forecast 2023-2028
- Chart on Dried herbs - Market size and forecast 2023-2028 ($ million)
- Data Table on Dried herbs - Market size and forecast 2023-2028 ($ million)
- Chart on Dried herbs - Year-over-year growth 2023-2028 (%)
- Data Table on Dried herbs - Year-over-year growth 2023-2028 (%)
- 7.6 Individual spices - Market size and forecast 2023-2028
- Chart on Individual spices - Market size and forecast 2023-2028 ($ million)
- Data Table on Individual spices - Market size and forecast 2023-2028 ($ million)
- Chart on Individual spices - Year-over-year growth 2023-2028 (%)
- Data Table on Individual spices - Year-over-year growth 2023-2028 (%)
- 7.7 Market opportunity by Product
- Market opportunity by Product ($ million)
- Data Table on Market opportunity by Product ($ million)
8 Customer Landscape
- 8.1 Customer landscape overview
- Analysis of price sensitivity, lifecycle, customer purchase basket, adoption rates, and purchase criteria
9 Geographic Landscape
- 9.1 Geographic segmentation
- Chart on Market share By Geographical Landscape2023-2028 (%)
- Data Table on Market share By Geographical Landscape2023-2028 (%)
- 9.2 Geographic comparison
- Chart on Geographic comparison
- Data Table on Geographic comparison
- 9.3 North America - Market size and forecast 2023-2028
- Chart on North America - Market size and forecast 2023-2028 ($ million)
- Data Table on North America - Market size and forecast 2023-2028 ($ million)
- Chart on North America - Year-over-year growth 2023-2028 (%)
- Data Table on North America - Year-over-year growth 2023-2028 (%)
- 9.4 Europe - Market size and forecast 2023-2028
- Chart on Europe - Market size and forecast 2023-2028 ($ million)
- Data Table on Europe - Market size and forecast 2023-2028 ($ million)
- Chart on Europe - Year-over-year growth 2023-2028 (%)
- Data Table on Europe - Year-over-year growth 2023-2028 (%)
- 9.5 APAC - Market size and forecast 2023-2028
- Chart on APAC - Market size and forecast 2023-2028 ($ million)
- Data Table on APAC - Market size and forecast 2023-2028 ($ million)
- Chart on APAC - Year-over-year growth 2023-2028 (%)
- Data Table on APAC - Year-over-year growth 2023-2028 (%)
- 9.6 South America - Market size and forecast 2023-2028
- Chart on South America - Market size and forecast 2023-2028 ($ million)
- Data Table on South America - Market size and forecast 2023-2028 ($ million)
- Chart on South America - Year-over-year growth 2023-2028 (%)
- Data Table on South America - Year-over-year growth 2023-2028 (%)
- 9.7 Middle East and Africa - Market size and forecast 2023-2028
- Chart on Middle East and Africa - Market size and forecast 2023-2028 ($ million)
- Data Table on Middle East and Africa - Market size and forecast 2023-2028 ($ million)
- Chart on Middle East and Africa - Year-over-year growth 2023-2028 (%)
- Data Table on Middle East and Africa - Year-over-year growth 2023-2028 (%)
- 9.8 US - Market size and forecast 2023-2028
- Chart on US - Market size and forecast 2023-2028 ($ million)
- Data Table on US - Market size and forecast 2023-2028 ($ million)
- Chart on US - Year-over-year growth 2023-2028 (%)
- Data Table on US - Year-over-year growth 2023-2028 (%)
- 9.9 China - Market size and forecast 2023-2028
- Chart on China - Market size and forecast 2023-2028 ($ million)
- Data Table on China - Market size and forecast 2023-2028 ($ million)
- Chart on China - Year-over-year growth 2023-2028 (%)
- Data Table on China - Year-over-year growth 2023-2028 (%)
- 9.10 India - Market size and forecast 2023-2028
- Chart on India - Market size and forecast 2023-2028 ($ million)
- Data Table on India - Market size and forecast 2023-2028 ($ million)
- Chart on India - Year-over-year growth 2023-2028 (%)
- Data Table on India - Year-over-year growth 2023-2028 (%)
- 9.11 UK - Market size and forecast 2023-2028
- Chart on UK - Market size and forecast 2023-2028 ($ million)
- Data Table on UK - Market size and forecast 2023-2028 ($ million)
- Chart on UK - Year-over-year growth 2023-2028 (%)
- Data Table on UK - Year-over-year growth 2023-2028 (%)
- 9.12 Germany - Market size and forecast 2023-2028
- Chart on Germany - Market size and forecast 2023-2028 ($ million)
- Data Table on Germany - Market size and forecast 2023-2028 ($ million)
- Chart on Germany - Year-over-year growth 2023-2028 (%)
- Data Table on Germany - Year-over-year growth 2023-2028 (%)
- 9.13 Market opportunity by geography
- Market opportunity By Geographical Landscape($ million)
- Data Tables on Market opportunity By Geographical Landscape($ million)
10 Drivers, Challenges, and Opportunity/Restraints
- 10.1 Market drivers
- 10.2 Market challenges
- 10.3 Impact of drivers and challenges
- Impact of drivers and challenges in 2023 and 2028
- 10.4 Market opportunities/restraints
11 Competitive Landscape
- 11.1 Overview
- 11.2 Competitive Landscape
- Overview on criticality of inputs and factors of differentiation
- 11.3 Landscape disruption
- Overview on factors of disruption
- 11.4 Industry risks
- Impact of key risks on business
12 Competitive Analysis
- 12.1 Companies profiled
- Companies covered
- 12.2 Market positioning of companies
- Matrix on companies position and classification
- 12.3 Ajinomoto Co. Inc.
- Ajinomoto Co. Inc. - Overview
- Ajinomoto Co. Inc. - Business segments
- Ajinomoto Co. Inc. - Key offerings
- Ajinomoto Co. Inc. - Segment focus
- 12.4 ARIAKE JAPAN Co. Ltd.
- ARIAKE JAPAN Co. Ltd. - Overview
- ARIAKE JAPAN Co. Ltd. - Product / Service
- ARIAKE JAPAN Co. Ltd. - Key offerings
- 12.5 Associated British Foods Plc
- Associated British Foods Plc - Overview
- Associated British Foods Plc - Business segments
- Associated British Foods Plc - Key offerings
- Associated British Foods Plc - Segment focus
- 12.6 C.H. Guenther and Son Inc.
- C.H. Guenther and Son Inc. - Overview
- C.H. Guenther and Son Inc. - Product / Service
- C.H. Guenther and Son Inc. - Key offerings
- 12.7 De Silva Brothers and Co.
- De Silva Brothers and Co. - Overview
- De Silva Brothers and Co. - Product / Service
- De Silva Brothers and Co. - Key offerings
- 12.8 Dohler GmbH
- Dohler GmbH - Overview
- Dohler GmbH - Product / Service
- Dohler GmbH - Key offerings
- 12.9 DS Group
- DS Group - Overview
- DS Group - Product / Service
- DS Group - Key offerings
- 12.10 EVEREST Food Products Pvt. Ltd.
- EVEREST Food Products Pvt. Ltd. - Overview
- EVEREST Food Products Pvt. Ltd. - Product / Service
- EVEREST Food Products Pvt. Ltd. - Key offerings
- 12.11 Frontier Co op
- Frontier Co op - Overview
- Frontier Co op - Product / Service
- Frontier Co op - Key offerings
- 12.12 Fuchs North America
- Fuchs North America - Overview
- Fuchs North America - Product / Service
- Fuchs North America - Key offerings
- 12.13 Kerry Group Plc
- Kerry Group Plc - Overview
- Kerry Group Plc - Business segments
- Kerry Group Plc - Key offerings
- Kerry Group Plc - Segment focus
- 12.14 Mahashian Di Hatti Pvt. Ltd.
- Mahashian Di Hatti Pvt. Ltd. - Overview
- Mahashian Di Hatti Pvt. Ltd. - Product / Service
- Mahashian Di Hatti Pvt. Ltd. - Key offerings
- 12.15 McCormick and Co. Inc.
- McCormick and Co. Inc. - Overview
- McCormick and Co. Inc. - Business segments
- McCormick and Co. Inc. - Key offerings
- McCormick and Co. Inc. - Segment focus
- 12.16 Organic Spices Inc.
- Organic Spices Inc. - Overview
- Organic Spices Inc. - Product / Service
- Organic Spices Inc. - Key offerings
- 12.17 The Kraft Heinz Co.
- The Kraft Heinz Co. - Overview
- The Kraft Heinz Co. - Business segments
- The Kraft Heinz Co. - Key offerings
- The Kraft Heinz Co. - Segment focus
13 Appendix
- 13.1 Scope of the report
- 13.2 Inclusions and exclusions checklist
- Inclusions checklist
- Exclusions checklist
- 13.3 Currency conversion rates for US$
- Currency conversion rates for US$
- 13.4 Research methodology
- Research methodology
- 13.5 Data procurement
- Information sources
- 13.6 Data validation
- Data validation
- 13.7 Validation techniques employed for market sizing
- Validation techniques employed for market sizing
- 13.8 Data synthesis
- Data synthesis
- 13.9 360 degree market analysis
- 360 degree market analysis
- 13.10 List of abbreviations
- List of abbreviations
