|
|
市場調査レポート
商品コード
1581063
業務用食肉加工機器の世界市場 (2024~2028年)Global Commercial Meat Processing Equipment Market 2024-2028 |
||||||

|
|||||||
カスタマイズ可能
|
|||||||


| 業務用食肉加工機器の世界市場 (2024~2028年) |
|
出版日: 2024年10月12日
発行: TechNavio
ページ情報: 英文 214 Pages
納期: 即納可能
|

全表示
- 概要
- 図表
- 目次
業務用食肉加工機器市場は2023年から2028年に33億60万米ドル分拡大し、予測期間中に5.1%のCAGRで成長すると予測されます。当レポートでは、業務用食肉加工機器市場の全体的な分析、市場規模・予測、動向、成長促進要因、課題、約25社のベンダーを網羅したベンダー分析などを掲載しています。
当レポートでは、現在の市場シナリオ、最新動向と促進要因、市場環境全体に関する最新分析を提供しています。食肉消費量の増加、食肉加工品への需要の高まり、食肉の輸出入の増加などが市場を牽引しています。
| 市場範囲 | |
|---|---|
| 基準年 | 2024年 |
| 終了年 | 2028年 |
| 予測期間 | 2024~2028年 |
| 成長モメンタム | 加速 |
| 前年比 (2024年) | 3.8% |
| CAGR | 5.1% |
| 増分額 | 33億60万米ドル |
当レポートでは、今後数年間の業務用食肉加工機器市場の成長を促進する主な理由の1つとして、食肉加工機器へのIoTの統合を挙げています。また、カスタム型食肉加工機器の採用が増加し、食肉加工機器の安全機能への注目が高まっていることも、市場の大きな需要につながります。
目次
第1章 エグゼクティブサマリー
- 市場概要
第2章 Technavioによる分析
- 価格感応度・ライフサイクル・顧客購入バスケット・採用率・購入基準の分析
- インプットの重要性と差別化の要因
- 混乱の要因
- 促進要因と課題の影響
第3章 市場情勢
- 市場エコシステム
- 市場の特徴
- バリューチェーン分析
第4章 市場規模の評価
- 市場の定義
- 市場セグメント分析
- 市場規模 (2023年)
- 市場の見通し (2023~2028年)
第5章 市場規模実績
- 業務用食肉加工機器の世界市場 (2018~2022年)
- 種類別分析 (2018~2022年)
- エンドユーザー別分析 (2018~2022年)
- 地域別分析 (2018~2022年)
- 国別分析 (2018~2022年)
第6章 定性分析
- 世界の業務用食肉加工機器市場におけるAIの影響
第7章 ファイブフォース分析
- ファイブフォースの要約
- 買い手の交渉力
- 供給企業の交渉力
- 新規参入業者の脅威
- 代替品の脅威
- 競争の脅威
- 市況
第8章 市場セグメンテーション:種類別
- 市場セグメンテーション
- 比較:種類別
- スライス機器:市場規模と予測 (2023~2028年)
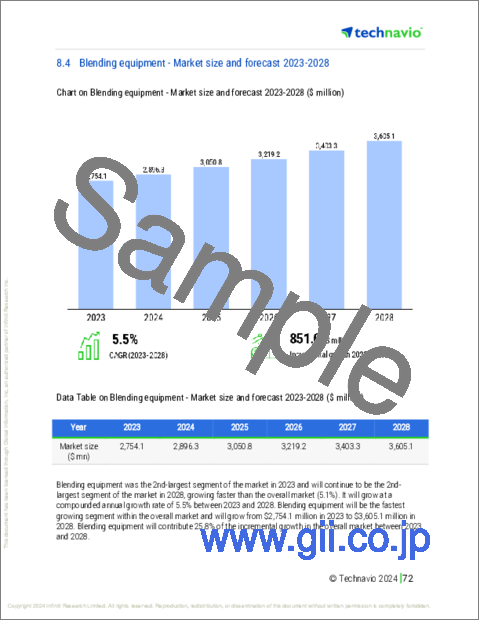
- ブレンド装置:市場規模と予測 (2023~2028年)
- テンダライザー装置:市場規模と予測 (2023~2028年)
- 燻製装置:市場規模と予測 (2023~2028年)
- その他:市場規模と予測 (2023~2028年)
- 種類別の市場機会
第9章 市場セグメンテーション:エンドユーザー別
- 市場セグメンテーション
- 比較:エンドユーザー別
- スーパーマーケット:市場規模と予測 (2023~2028年)
- ホテル・レストラン:市場規模と予測 (2023~2028年)
- 精肉店・と畜場:市場規模と予測 (2023~2028年)
- ケータリング企業:市場規模と予測 (2023~2028年)
- エンドユーザー別の市場機会
第10章 顧客情勢
- 顧客情勢の概要
第11章 地域別情勢
- 地域別セグメンテーション
- 地域別比較
- アジア太平洋:市場規模と予測 (2023~2028年)
- 北米:市場規模と予測 (2023~2028年)
- 欧州:市場規模と予測 (2023~2028年)
- 南米:市場規模と予測 (2023~2028年)
- 中東・アフリカ:市場規模と予測 (2023~2028年)
- 中国:市場規模と予測 (2023~2028年)
- 米国:市場規模と予測 (2023~2028年)
- 英国:市場規模と予測 (2023~2028年)
- オーストラリア:市場規模と予測 (2023~2028年)
- カナダ:市場規模と予測 (2023~2028年)
- インド:市場規模と予測 (2023~2028年)
- ドイツ:市場規模と予測 (2023~2028年)
- フランス:市場規模と予測 (2023~2028年)
- ブラジル:市場規模と予測 (2023~2028年)
- 韓国:市場規模と予測 (2023~2028年)
- 地域別の市場機会
第12章 促進要因・課題・機会・抑制要因
- 市場促進要因
- 市場の課題
- 促進要因と課題の影響
- 市場の機会・抑制要因
第13章 競合情勢
- 概要
- 競合情勢
- 混乱の状況
- 業界のリスク
第14章 競合分析
- 企業プロファイル
- 企業ランキング指数
- 企業の市場ポジショニング
- Alfa Laval AB
- BIRO Manufacturing Co.
- Bizerba SE and Co. KG
- BRAHER INTERNACIONAL S.A.
- Butcher Boy Machines International LLC
- Frain Industries
- GEA Group AG
- Globe Food Equipment Co.
- Hobart Corp.
- Meatek Food Machineries India Pvt. Ltd.
- Mepaco
- Minerva Omega Group s.r.l
- Provisur Technologies Inc.
- PSS SVIDNIK, a.s
- The Middleby Corp.
第15章 付録
Exhibits:
- Exhibits1: Executive Summary - Chart on Market Overview
- Exhibits2: Executive Summary - Data Table on Market Overview
- Exhibits3: Executive Summary - Chart on Global Market Characteristics
- Exhibits4: Executive Summary - Chart on Market By Geographical Landscape
- Exhibits5: Executive Summary - Chart on Market Segmentation by Type
- Exhibits6: Executive Summary - Chart on Market Segmentation by End-user
- Exhibits7: Executive Summary - Chart on Incremental Growth
- Exhibits8: Executive Summary - Data Table on Incremental Growth
- Exhibits9: Executive Summary - Chart on Company Market Positioning
- Exhibits10: Analysis of price sensitivity, lifecycle, customer purchase basket, adoption rates, and purchase criteria
- Exhibits11: Overview on criticality of inputs and factors of differentiation
- Exhibits12: Overview on factors of disruption
- Exhibits13: Impact of drivers and challenges in 2023 and 2028
- Exhibits14: Parent Market
- Exhibits15: Data Table on - Parent Market
- Exhibits16: Market characteristics analysis
- Exhibits17: Value Chain Analysis
- Exhibits18: Offerings of companies included in the market definition
- Exhibits19: Market segments
- Exhibits20: Chart on Global - Market size and forecast 2023-2028 ($ million)
- Exhibits21: Data Table on Global - Market size and forecast 2023-2028 ($ million)
- Exhibits22: Chart on Global Market: Year-over-year growth 2023-2028 (%)
- Exhibits23: Data Table on Global Market: Year-over-year growth 2023-2028 (%)
- Exhibits24: Historic Market Size - Data Table on Global Commercial Meat Processing Equipment Market 2018 - 2022 ($ million)
- Exhibits25: Historic Market Size - Type Segment 2018 - 2022 ($ million)
- Exhibits26: Historic Market Size - End-user Segment 2018 - 2022 ($ million)
- Exhibits27: Historic Market Size - Geography Segment 2018 - 2022 ($ million)
- Exhibits28: Historic Market Size - Country Segment 2018 - 2022 ($ million)
- Exhibits29: Five forces analysis - Comparison between 2023 and 2028
- Exhibits30: Bargaining power of buyers - Impact of key factors 2023 and 2028
- Exhibits31: Bargaining power of suppliers - Impact of key factors in 2023 and 2028
- Exhibits32: Threat of new entrants - Impact of key factors in 2023 and 2028
- Exhibits33: Threat of substitutes - Impact of key factors in 2023 and 2028
- Exhibits34: Threat of rivalry - Impact of key factors in 2023 and 2028
- Exhibits35: Chart on Market condition - Five forces 2023 and 2028
- Exhibits36: Chart on Type - Market share 2023-2028 (%)
- Exhibits37: Data Table on Type - Market share 2023-2028 (%)
- Exhibits38: Chart on Comparison by Type
- Exhibits39: Data Table on Comparison by Type
- Exhibits40: Chart on Slicing equipment - Market size and forecast 2023-2028 ($ million)
- Exhibits41: Data Table on Slicing equipment - Market size and forecast 2023-2028 ($ million)
- Exhibits42: Chart on Slicing equipment - Year-over-year growth 2023-2028 (%)
- Exhibits43: Data Table on Slicing equipment - Year-over-year growth 2023-2028 (%)
- Exhibits44: Chart on Blending equipment - Market size and forecast 2023-2028 ($ million)
- Exhibits45: Data Table on Blending equipment - Market size and forecast 2023-2028 ($ million)
- Exhibits46: Chart on Blending equipment - Year-over-year growth 2023-2028 (%)
- Exhibits47: Data Table on Blending equipment - Year-over-year growth 2023-2028 (%)
- Exhibits48: Chart on Tenderizing equipment - Market size and forecast 2023-2028 ($ million)
- Exhibits49: Data Table on Tenderizing equipment - Market size and forecast 2023-2028 ($ million)
- Exhibits50: Chart on Tenderizing equipment - Year-over-year growth 2023-2028 (%)
- Exhibits51: Data Table on Tenderizing equipment - Year-over-year growth 2023-2028 (%)
- Exhibits52: Chart on Smoking equipment - Market size and forecast 2023-2028 ($ million)
- Exhibits53: Data Table on Smoking equipment - Market size and forecast 2023-2028 ($ million)
- Exhibits54: Chart on Smoking equipment - Year-over-year growth 2023-2028 (%)
- Exhibits55: Data Table on Smoking equipment - Year-over-year growth 2023-2028 (%)
- Exhibits56: Chart on Others - Market size and forecast 2023-2028 ($ million)
- Exhibits57: Data Table on Others - Market size and forecast 2023-2028 ($ million)
- Exhibits58: Chart on Others - Year-over-year growth 2023-2028 (%)
- Exhibits59: Data Table on Others - Year-over-year growth 2023-2028 (%)
- Exhibits60: Market opportunity by Type ($ million)
- Exhibits61: Data Table on Market opportunity by Type ($ million)
- Exhibits62: Chart on End-user - Market share 2023-2028 (%)
- Exhibits63: Data Table on End-user - Market share 2023-2028 (%)
- Exhibits64: Chart on Comparison by End-user
- Exhibits65: Data Table on Comparison by End-user
- Exhibits66: Chart on Supermarkets - Market size and forecast 2023-2028 ($ million)
- Exhibits67: Data Table on Supermarkets - Market size and forecast 2023-2028 ($ million)
- Exhibits68: Chart on Supermarkets - Year-over-year growth 2023-2028 (%)
- Exhibits69: Data Table on Supermarkets - Year-over-year growth 2023-2028 (%)
- Exhibits70: Chart on Hotels and restaurants - Market size and forecast 2023-2028 ($ million)
- Exhibits71: Data Table on Hotels and restaurants - Market size and forecast 2023-2028 ($ million)
- Exhibits72: Chart on Hotels and restaurants - Year-over-year growth 2023-2028 (%)
- Exhibits73: Data Table on Hotels and restaurants - Year-over-year growth 2023-2028 (%)
- Exhibits74: Chart on Butcher shops and slaughterhouses - Market size and forecast 2023-2028 ($ million)
- Exhibits75: Data Table on Butcher shops and slaughterhouses - Market size and forecast 2023-2028 ($ million)
- Exhibits76: Chart on Butcher shops and slaughterhouses - Year-over-year growth 2023-2028 (%)
- Exhibits77: Data Table on Butcher shops and slaughterhouses - Year-over-year growth 2023-2028 (%)
- Exhibits78: Chart on Catering companies - Market size and forecast 2023-2028 ($ million)
- Exhibits79: Data Table on Catering companies - Market size and forecast 2023-2028 ($ million)
- Exhibits80: Chart on Catering companies - Year-over-year growth 2023-2028 (%)
- Exhibits81: Data Table on Catering companies - Year-over-year growth 2023-2028 (%)
- Exhibits82: Market opportunity by End-user ($ million)
- Exhibits83: Data Table on Market opportunity by End-user ($ million)
- Exhibits84: Analysis of price sensitivity, lifecycle, customer purchase basket, adoption rates, and purchase criteria
- Exhibits85: Chart on Market share By Geographical Landscape 2023-2028 (%)
- Exhibits86: Data Table on Market share By Geographical Landscape 2023-2028 (%)
- Exhibits87: Chart on Geographic comparison
- Exhibits88: Data Table on Geographic comparison
- Exhibits89: Chart on APAC - Market size and forecast 2023-2028 ($ million)
- Exhibits90: Data Table on APAC - Market size and forecast 2023-2028 ($ million)
- Exhibits91: Chart on APAC - Year-over-year growth 2023-2028 (%)
- Exhibits92: Data Table on APAC - Year-over-year growth 2023-2028 (%)
- Exhibits93: Chart on North America - Market size and forecast 2023-2028 ($ million)
- Exhibits94: Data Table on North America - Market size and forecast 2023-2028 ($ million)
- Exhibits95: Chart on North America - Year-over-year growth 2023-2028 (%)
- Exhibits96: Data Table on North America - Year-over-year growth 2023-2028 (%)
- Exhibits97: Chart on Europe - Market size and forecast 2023-2028 ($ million)
- Exhibits98: Data Table on Europe - Market size and forecast 2023-2028 ($ million)
- Exhibits99: Chart on Europe - Year-over-year growth 2023-2028 (%)
- Exhibits100: Data Table on Europe - Year-over-year growth 2023-2028 (%)
- Exhibits101: Chart on South America - Market size and forecast 2023-2028 ($ million)
- Exhibits102: Data Table on South America - Market size and forecast 2023-2028 ($ million)
- Exhibits103: Chart on South America - Year-over-year growth 2023-2028 (%)
- Exhibits104: Data Table on South America - Year-over-year growth 2023-2028 (%)
- Exhibits105: Chart on Middle East and Africa - Market size and forecast 2023-2028 ($ million)
- Exhibits106: Data Table on Middle East and Africa - Market size and forecast 2023-2028 ($ million)
- Exhibits107: Chart on Middle East and Africa - Year-over-year growth 2023-2028 (%)
- Exhibits108: Data Table on Middle East and Africa - Year-over-year growth 2023-2028 (%)
- Exhibits109: Chart on China - Market size and forecast 2023-2028 ($ million)
- Exhibits110: Data Table on China - Market size and forecast 2023-2028 ($ million)
- Exhibits111: Chart on China - Year-over-year growth 2023-2028 (%)
- Exhibits112: Data Table on China - Year-over-year growth 2023-2028 (%)
- Exhibits113: Chart on US - Market size and forecast 2023-2028 ($ million)
- Exhibits114: Data Table on US - Market size and forecast 2023-2028 ($ million)
- Exhibits115: Chart on US - Year-over-year growth 2023-2028 (%)
- Exhibits116: Data Table on US - Year-over-year growth 2023-2028 (%)
- Exhibits117: Chart on UK - Market size and forecast 2023-2028 ($ million)
- Exhibits118: Data Table on UK - Market size and forecast 2023-2028 ($ million)
- Exhibits119: Chart on UK - Year-over-year growth 2023-2028 (%)
- Exhibits120: Data Table on UK - Year-over-year growth 2023-2028 (%)
- Exhibits121: Chart on Australia - Market size and forecast 2023-2028 ($ million)
- Exhibits122: Data Table on Australia - Market size and forecast 2023-2028 ($ million)
- Exhibits123: Chart on Australia - Year-over-year growth 2023-2028 (%)
- Exhibits124: Data Table on Australia - Year-over-year growth 2023-2028 (%)
- Exhibits125: Chart on Canada - Market size and forecast 2023-2028 ($ million)
- Exhibits126: Data Table on Canada - Market size and forecast 2023-2028 ($ million)
- Exhibits127: Chart on Canada - Year-over-year growth 2023-2028 (%)
- Exhibits128: Data Table on Canada - Year-over-year growth 2023-2028 (%)
- Exhibits129: Chart on India - Market size and forecast 2023-2028 ($ million)
- Exhibits130: Data Table on India - Market size and forecast 2023-2028 ($ million)
- Exhibits131: Chart on India - Year-over-year growth 2023-2028 (%)
- Exhibits132: Data Table on India - Year-over-year growth 2023-2028 (%)
- Exhibits133: Chart on Germany - Market size and forecast 2023-2028 ($ million)
- Exhibits134: Data Table on Germany - Market size and forecast 2023-2028 ($ million)
- Exhibits135: Chart on Germany - Year-over-year growth 2023-2028 (%)
- Exhibits136: Data Table on Germany - Year-over-year growth 2023-2028 (%)
- Exhibits137: Chart on France - Market size and forecast 2023-2028 ($ million)
- Exhibits138: Data Table on France - Market size and forecast 2023-2028 ($ million)
- Exhibits139: Chart on France - Year-over-year growth 2023-2028 (%)
- Exhibits140: Data Table on France - Year-over-year growth 2023-2028 (%)
- Exhibits141: Chart on Brazil - Market size and forecast 2023-2028 ($ million)
- Exhibits142: Data Table on Brazil - Market size and forecast 2023-2028 ($ million)
- Exhibits143: Chart on Brazil - Year-over-year growth 2023-2028 (%)
- Exhibits144: Data Table on Brazil - Year-over-year growth 2023-2028 (%)
- Exhibits145: Chart on South Korea - Market size and forecast 2023-2028 ($ million)
- Exhibits146: Data Table on South Korea - Market size and forecast 2023-2028 ($ million)
- Exhibits147: Chart on South Korea - Year-over-year growth 2023-2028 (%)
- Exhibits148: Data Table on South Korea - Year-over-year growth 2023-2028 (%)
- Exhibits149: Market opportunity By Geographical Landscape ($ million)
- Exhibits150: Data Tables on Market opportunity By Geographical Landscape ($ million)
- Exhibits151: Impact of drivers and challenges in 2023 and 2028
- Exhibits152: Overview on criticality of inputs and factors of differentiation
- Exhibits153: Overview on factors of disruption
- Exhibits154: Impact of key risks on business
- Exhibits155: Companies covered
- Exhibits156: Company ranking index
- Exhibits157: Matrix on companies position and classification
- Exhibits158: Alfa Laval AB - Overview
- Exhibits159: Alfa Laval AB - Business segments
- Exhibits160: Alfa Laval AB - Key news
- Exhibits161: Alfa Laval AB - Key offerings
- Exhibits162: Alfa Laval AB - Segment focus
- Exhibits163: SWOT
- Exhibits164: BIRO Manufacturing Co. - Overview
- Exhibits165: BIRO Manufacturing Co. - Product / Service
- Exhibits166: BIRO Manufacturing Co. - Key offerings
- Exhibits167: SWOT
- Exhibits168: Bizerba SE and Co. KG - Overview
- Exhibits169: Bizerba SE and Co. KG - Product / Service
- Exhibits170: Bizerba SE and Co. KG - Key offerings
- Exhibits171: SWOT
- Exhibits172: BRAHER INTERNACIONAL S.A. - Overview
- Exhibits173: BRAHER INTERNACIONAL S.A. - Product / Service
- Exhibits174: BRAHER INTERNACIONAL S.A. - Key offerings
- Exhibits175: SWOT
- Exhibits176: Butcher Boy Machines International LLC - Overview
- Exhibits177: Butcher Boy Machines International LLC - Product / Service
- Exhibits178: Butcher Boy Machines International LLC - Key offerings
- Exhibits179: SWOT
- Exhibits180: Frain Industries - Overview
- Exhibits181: Frain Industries - Product / Service
- Exhibits182: Frain Industries - Key offerings
- Exhibits183: SWOT
- Exhibits184: GEA Group AG - Overview
- Exhibits185: GEA Group AG - Business segments
- Exhibits186: GEA Group AG - Key offerings
- Exhibits187: GEA Group AG - Segment focus
- Exhibits188: SWOT
- Exhibits189: Globe Food Equipment Co. - Overview
- Exhibits190: Globe Food Equipment Co. - Product / Service
- Exhibits191: Globe Food Equipment Co. - Key offerings
- Exhibits192: SWOT
- Exhibits193: Hobart Corp. - Overview
- Exhibits194: Hobart Corp. - Product / Service
- Exhibits195: Hobart Corp. - Key offerings
- Exhibits196: SWOT
- Exhibits197: Meatek Food Machineries India Pvt. Ltd. - Overview
- Exhibits198: Meatek Food Machineries India Pvt. Ltd. - Product / Service
- Exhibits199: Meatek Food Machineries India Pvt. Ltd. - Key offerings
- Exhibits200: SWOT
- Exhibits201: Mepaco - Overview
- Exhibits202: Mepaco - Product / Service
- Exhibits203: Mepaco - Key offerings
- Exhibits204: SWOT
- Exhibits205: Minerva Omega Group s.r.l - Overview
- Exhibits206: Minerva Omega Group s.r.l - Product / Service
- Exhibits207: Minerva Omega Group s.r.l - Key offerings
- Exhibits208: SWOT
- Exhibits209: Provisur Technologies Inc. - Overview
- Exhibits210: Provisur Technologies Inc. - Product / Service
- Exhibits211: Provisur Technologies Inc. - Key offerings
- Exhibits212: SWOT
- Exhibits213: PSS SVIDNIK, a.s - Overview
- Exhibits214: PSS SVIDNIK, a.s - Product / Service
- Exhibits215: PSS SVIDNIK, a.s - Key offerings
- Exhibits216: SWOT
- Exhibits217: The Middleby Corp. - Overview
- Exhibits218: The Middleby Corp. - Business segments
- Exhibits219: The Middleby Corp. - Key offerings
- Exhibits220: The Middleby Corp. - Segment focus
- Exhibits221: SWOT
- Exhibits222: Inclusions checklist
- Exhibits223: Exclusions checklist
- Exhibits224: Currency conversion rates for US$
- Exhibits225: Research methodology
- Exhibits226: Information sources
- Exhibits227: Data validation
- Exhibits228: Validation techniques employed for market sizing
- Exhibits229: Data synthesis
- Exhibits230: 360 degree market analysis
- Exhibits231: List of abbreviations
Commercial Meat Processing Equipment Market 2024-2028
The commercial meat processing equipment market is forecasted to grow by USD 3300.6 mn during 2023-2028, accelerating at a CAGR of 5.1% during the forecast period. The report on the commercial meat processing equipment market provides a holistic analysis, market size and forecast, trends, growth drivers, and challenges, as well as vendor analysis covering around 25 vendors.
The report offers an up-to-date analysis regarding the current market scenario, the latest trends and drivers, and the overall market environment. The market is driven by increase in meat consumption, rising demand for processed meat products, and increase in import and export of meat.
| Market Scope | |
|---|---|
| Base Year | 2024 |
| End Year | 2028 |
| Series Year | 2024-2028 |
| Growth Momentum | Accelerate |
| YOY 2024 | 3.8% |
| CAGR | 5.1% |
| Incremental Value | $3300.6 mn |
Technavio's commercial meat processing equipment market is segmented as below:
By Type
- Slicing equipment
- Blending equipment
- Tenderizing equipment
- Smoking equipment
- Others
By End-user
- Supermarkets
- Hotels and restaurants
- Butcher shops and slaughterhouses
- Catering companies
By Geographical Landscape
- APAC
- North America
- Europe
- South America
- Middle East and Africa
This study identifies the integration of iot into meat processing equipment as one of the prime reasons driving the commercial meat processing equipment market growth during the next few years. Also, growing adoption of customized meat processing equipment and growing focus on safety features of meat processing equipment will lead to sizable demand in the market.
The report on the commercial meat processing equipment market covers the following areas:
- Commercial Meat Processing Equipment Market sizing
- Commercial Meat Processing Equipment Market forecast
- Commercial Meat Processing Equipment Market industry analysis
The robust vendor analysis is designed to help clients improve their market position, and in line with this, this report provides a detailed analysis of several leading commercial meat processing equipment market vendors that include Alfa Laval AB, BIRO Manufacturing Co., Bizerba SE and Co. KG, BRAHER INTERNACIONAL S.A., Butcher Boy Machines International LLC, Frain Industries, GEA Group AG, Globe Food Equipment Co., Grote Co. Inc., Hobart Corp., John Bean Technologies Corp., Meatek Food Machineries India Pvt. Ltd., Mepaco, Minerva Omega Group s.r.l, MP Equipment, Provisur Technologies Inc., PSS SVIDNIK, a.s, RISCO S.p.A, Talsa SA, The Middleby Corp., Tomahawk Manufacturing Inc, and Zaftech India. Also, the commercial meat processing equipment market analysis report includes information on upcoming trends and challenges that will influence market growth. This is to help companies strategize and leverage all forthcoming growth opportunities.
The study was conducted using an objective combination of primary and secondary information including inputs from key participants in the industry. The report contains a comprehensive market and vendor landscape in addition to an analysis of the key vendors.
The publisher presents a detailed picture of the market by the way of study, synthesis, and summation of data from multiple sources by an analysis of key parameters such as profit, pricing, competition, and promotions. It presents various market facets by identifying the key industry influencers. The data presented is comprehensive, reliable, and a result of extensive primary and secondary research. The market research reports provide a complete competitive landscape and an in-depth vendor selection methodology and analysis using qualitative and quantitative research to forecast accurate market growth.
Table of Contents
1 Executive Summary
- 1.1 Market overview
- Executive Summary - Chart on Market Overview
- Executive Summary - Data Table on Market Overview
- Executive Summary - Chart on Global Market Characteristics
- Executive Summary - Chart on Market By Geographical Landscape
- Executive Summary - Chart on Market Segmentation by Type
- Executive Summary - Chart on Market Segmentation by End-user
- Executive Summary - Chart on Incremental Growth
- Executive Summary - Data Table on Incremental Growth
- Executive Summary - Chart on Company Market Positioning
2 Technavio Analysis
- 2.1 Analysis of price sensitivity, lifecycle, customer purchase basket, adoption rates, and purchase criteria
- Analysis of price sensitivity, lifecycle, customer purchase basket, adoption rates, and purchase criteria
- 2.2 Criticality of inputs and Factors of differentiation
- Overview on criticality of inputs and factors of differentiation
- 2.3 Factors of disruption
- Overview on factors of disruption
- 2.4 Impact of drivers and challenges
- Impact of drivers and challenges in 2023 and 2028
3 Market Landscape
- 3.1 Market ecosystem
- Parent Market
- Data Table on - Parent Market
- 3.2 Market characteristics
- Market characteristics analysis
- 3.3 Value chain analysis
- Value Chain Analysis
4 Market Sizing
- 4.1 Market definition
- Offerings of companies included in the market definition
- 4.2 Market segment analysis
- Market segments
- 4.3 Market size 2023
- 4.4 Market outlook: Forecast for 2023-2028
- Chart on Global - Market size and forecast 2023-2028 ($ million)
- Data Table on Global - Market size and forecast 2023-2028 ($ million)
- Chart on Global Market: Year-over-year growth 2023-2028 (%)
- Data Table on Global Market: Year-over-year growth 2023-2028 (%)
5 Historic Market Size
- 5.1 Global Commercial Meat Processing Equipment Market 2018 - 2022
- Historic Market Size - Data Table on Global Commercial Meat Processing Equipment Market 2018 - 2022 ($ million)
- 5.2 Type segment analysis 2018 - 2022
- Historic Market Size - Type Segment 2018 - 2022 ($ million)
- 5.3 End-user segment analysis 2018 - 2022
- Historic Market Size - End-user Segment 2018 - 2022 ($ million)
- 5.4 Geography segment analysis 2018 - 2022
- Historic Market Size - Geography Segment 2018 - 2022 ($ million)
- 5.5 Country segment analysis 2018 - 2022
- Historic Market Size - Country Segment 2018 - 2022 ($ million)
6 Qualitative Analysis
- 6.1 Impact of AI on the Global Commercial Meat Processing Equipment Market
7 Five Forces Analysis
- 7.1 Five forces summary
- Five forces analysis - Comparison between 2023 and 2028
- 7.2 Bargaining power of buyers
- Bargaining power of buyers - Impact of key factors 2023 and 2028
- 7.3 Bargaining power of suppliers
- Bargaining power of suppliers - Impact of key factors in 2023 and 2028
- 7.4 Threat of new entrants
- Threat of new entrants - Impact of key factors in 2023 and 2028
- 7.5 Threat of substitutes
- Threat of substitutes - Impact of key factors in 2023 and 2028
- 7.6 Threat of rivalry
- Threat of rivalry - Impact of key factors in 2023 and 2028
- 7.7 Market condition
- Chart on Market condition - Five forces 2023 and 2028
8 Market Segmentation by Type
- 8.1 Market segments
- Chart on Type - Market share 2023-2028 (%)
- Data Table on Type - Market share 2023-2028 (%)
- 8.2 Comparison by Type
- Chart on Comparison by Type
- Data Table on Comparison by Type
- 8.3 Slicing equipment - Market size and forecast 2023-2028
- Chart on Slicing equipment - Market size and forecast 2023-2028 ($ million)
- Data Table on Slicing equipment - Market size and forecast 2023-2028 ($ million)
- Chart on Slicing equipment - Year-over-year growth 2023-2028 (%)
- Data Table on Slicing equipment - Year-over-year growth 2023-2028 (%)
- 8.4 Blending equipment - Market size and forecast 2023-2028
- Chart on Blending equipment - Market size and forecast 2023-2028 ($ million)
- Data Table on Blending equipment - Market size and forecast 2023-2028 ($ million)
- Chart on Blending equipment - Year-over-year growth 2023-2028 (%)
- Data Table on Blending equipment - Year-over-year growth 2023-2028 (%)
- 8.5 Tenderizing equipment - Market size and forecast 2023-2028
- Chart on Tenderizing equipment - Market size and forecast 2023-2028 ($ million)
- Data Table on Tenderizing equipment - Market size and forecast 2023-2028 ($ million)
- Chart on Tenderizing equipment - Year-over-year growth 2023-2028 (%)
- Data Table on Tenderizing equipment - Year-over-year growth 2023-2028 (%)
- 8.6 Smoking equipment - Market size and forecast 2023-2028
- Chart on Smoking equipment - Market size and forecast 2023-2028 ($ million)
- Data Table on Smoking equipment - Market size and forecast 2023-2028 ($ million)
- Chart on Smoking equipment - Year-over-year growth 2023-2028 (%)
- Data Table on Smoking equipment - Year-over-year growth 2023-2028 (%)
- 8.7 Others - Market size and forecast 2023-2028
- Chart on Others - Market size and forecast 2023-2028 ($ million)
- Data Table on Others - Market size and forecast 2023-2028 ($ million)
- Chart on Others - Year-over-year growth 2023-2028 (%)
- Data Table on Others - Year-over-year growth 2023-2028 (%)
- 8.8 Market opportunity by Type
- Market opportunity by Type ($ million)
- Data Table on Market opportunity by Type ($ million)
9 Market Segmentation by End-user
- 9.1 Market segments
- Chart on End-user - Market share 2023-2028 (%)
- Data Table on End-user - Market share 2023-2028 (%)
- 9.2 Comparison by End-user
- Chart on Comparison by End-user
- Data Table on Comparison by End-user
- 9.3 Supermarkets - Market size and forecast 2023-2028
- Chart on Supermarkets - Market size and forecast 2023-2028 ($ million)
- Data Table on Supermarkets - Market size and forecast 2023-2028 ($ million)
- Chart on Supermarkets - Year-over-year growth 2023-2028 (%)
- Data Table on Supermarkets - Year-over-year growth 2023-2028 (%)
- 9.4 Hotels and restaurants - Market size and forecast 2023-2028
- Chart on Hotels and restaurants - Market size and forecast 2023-2028 ($ million)
- Data Table on Hotels and restaurants - Market size and forecast 2023-2028 ($ million)
- Chart on Hotels and restaurants - Year-over-year growth 2023-2028 (%)
- Data Table on Hotels and restaurants - Year-over-year growth 2023-2028 (%)
- 9.5 Butcher shops and slaughterhouses - Market size and forecast 2023-2028
- Chart on Butcher shops and slaughterhouses - Market size and forecast 2023-2028 ($ million)
- Data Table on Butcher shops and slaughterhouses - Market size and forecast 2023-2028 ($ million)
- Chart on Butcher shops and slaughterhouses - Year-over-year growth 2023-2028 (%)
- Data Table on Butcher shops and slaughterhouses - Year-over-year growth 2023-2028 (%)
- 9.6 Catering companies - Market size and forecast 2023-2028
- Chart on Catering companies - Market size and forecast 2023-2028 ($ million)
- Data Table on Catering companies - Market size and forecast 2023-2028 ($ million)
- Chart on Catering companies - Year-over-year growth 2023-2028 (%)
- Data Table on Catering companies - Year-over-year growth 2023-2028 (%)
- 9.7 Market opportunity by End-user
- Market opportunity by End-user ($ million)
- Data Table on Market opportunity by End-user ($ million)
10 Customer Landscape
- 10.1 Customer landscape overview
- Analysis of price sensitivity, lifecycle, customer purchase basket, adoption rates, and purchase criteria
11 Geographic Landscape
- 11.1 Geographic segmentation
- Chart on Market share By Geographical Landscape 2023-2028 (%)
- Data Table on Market share By Geographical Landscape 2023-2028 (%)
- 11.2 Geographic comparison
- Chart on Geographic comparison
- Data Table on Geographic comparison
- 11.3 APAC - Market size and forecast 2023-2028
- Chart on APAC - Market size and forecast 2023-2028 ($ million)
- Data Table on APAC - Market size and forecast 2023-2028 ($ million)
- Chart on APAC - Year-over-year growth 2023-2028 (%)
- Data Table on APAC - Year-over-year growth 2023-2028 (%)
- 11.4 North America - Market size and forecast 2023-2028
- Chart on North America - Market size and forecast 2023-2028 ($ million)
- Data Table on North America - Market size and forecast 2023-2028 ($ million)
- Chart on North America - Year-over-year growth 2023-2028 (%)
- Data Table on North America - Year-over-year growth 2023-2028 (%)
- 11.5 Europe - Market size and forecast 2023-2028
- Chart on Europe - Market size and forecast 2023-2028 ($ million)
- Data Table on Europe - Market size and forecast 2023-2028 ($ million)
- Chart on Europe - Year-over-year growth 2023-2028 (%)
- Data Table on Europe - Year-over-year growth 2023-2028 (%)
- 11.6 South America - Market size and forecast 2023-2028
- Chart on South America - Market size and forecast 2023-2028 ($ million)
- Data Table on South America - Market size and forecast 2023-2028 ($ million)
- Chart on South America - Year-over-year growth 2023-2028 (%)
- Data Table on South America - Year-over-year growth 2023-2028 (%)
- 11.7 Middle East and Africa - Market size and forecast 2023-2028
- Chart on Middle East and Africa - Market size and forecast 2023-2028 ($ million)
- Data Table on Middle East and Africa - Market size and forecast 2023-2028 ($ million)
- Chart on Middle East and Africa - Year-over-year growth 2023-2028 (%)
- Data Table on Middle East and Africa - Year-over-year growth 2023-2028 (%)
- 11.8 China - Market size and forecast 2023-2028
- Chart on China - Market size and forecast 2023-2028 ($ million)
- Data Table on China - Market size and forecast 2023-2028 ($ million)
- Chart on China - Year-over-year growth 2023-2028 (%)
- Data Table on China - Year-over-year growth 2023-2028 (%)
- 11.9 US - Market size and forecast 2023-2028
- Chart on US - Market size and forecast 2023-2028 ($ million)
- Data Table on US - Market size and forecast 2023-2028 ($ million)
- Chart on US - Year-over-year growth 2023-2028 (%)
- Data Table on US - Year-over-year growth 2023-2028 (%)
- 11.10 UK - Market size and forecast 2023-2028
- Chart on UK - Market size and forecast 2023-2028 ($ million)
- Data Table on UK - Market size and forecast 2023-2028 ($ million)
- Chart on UK - Year-over-year growth 2023-2028 (%)
- Data Table on UK - Year-over-year growth 2023-2028 (%)
- 11.11 Australia - Market size and forecast 2023-2028
- Chart on Australia - Market size and forecast 2023-2028 ($ million)
- Data Table on Australia - Market size and forecast 2023-2028 ($ million)
- Chart on Australia - Year-over-year growth 2023-2028 (%)
- Data Table on Australia - Year-over-year growth 2023-2028 (%)
- 11.12 Canada - Market size and forecast 2023-2028
- Chart on Canada - Market size and forecast 2023-2028 ($ million)
- Data Table on Canada - Market size and forecast 2023-2028 ($ million)
- Chart on Canada - Year-over-year growth 2023-2028 (%)
- Data Table on Canada - Year-over-year growth 2023-2028 (%)
- 11.13 India - Market size and forecast 2023-2028
- Chart on India - Market size and forecast 2023-2028 ($ million)
- Data Table on India - Market size and forecast 2023-2028 ($ million)
- Chart on India - Year-over-year growth 2023-2028 (%)
- Data Table on India - Year-over-year growth 2023-2028 (%)
- 11.14 Germany - Market size and forecast 2023-2028
- Chart on Germany - Market size and forecast 2023-2028 ($ million)
- Data Table on Germany - Market size and forecast 2023-2028 ($ million)
- Chart on Germany - Year-over-year growth 2023-2028 (%)
- Data Table on Germany - Year-over-year growth 2023-2028 (%)
- 11.15 France - Market size and forecast 2023-2028
- Chart on France - Market size and forecast 2023-2028 ($ million)
- Data Table on France - Market size and forecast 2023-2028 ($ million)
- Chart on France - Year-over-year growth 2023-2028 (%)
- Data Table on France - Year-over-year growth 2023-2028 (%)
- 11.16 Brazil - Market size and forecast 2023-2028
- Chart on Brazil - Market size and forecast 2023-2028 ($ million)
- Data Table on Brazil - Market size and forecast 2023-2028 ($ million)
- Chart on Brazil - Year-over-year growth 2023-2028 (%)
- Data Table on Brazil - Year-over-year growth 2023-2028 (%)
- 11.17 South Korea - Market size and forecast 2023-2028
- Chart on South Korea - Market size and forecast 2023-2028 ($ million)
- Data Table on South Korea - Market size and forecast 2023-2028 ($ million)
- Chart on South Korea - Year-over-year growth 2023-2028 (%)
- Data Table on South Korea - Year-over-year growth 2023-2028 (%)
- 11.18 Market opportunity By Geographical Landscape
- Market opportunity By Geographical Landscape ($ million)
- Data Tables on Market opportunity By Geographical Landscape ($ million)
12 Drivers, Challenges, and Opportunity/Restraints
- 12.1 Market drivers
- 12.2 Market challenges
- 12.3 Impact of drivers and challenges
- Impact of drivers and challenges in 2023 and 2028
- 12.4 Market opportunities/restraints
13 Competitive Landscape
- 13.1 Overview
- 13.2 Competitive Landscape
- Overview on criticality of inputs and factors of differentiation
- 13.3 Landscape disruption
- Overview on factors of disruption
- 13.4 Industry risks
- Impact of key risks on business
14 Competitive Analysis
- 14.1 Companies profiled
- Companies covered
- 14.2 Company ranking index
- Company ranking index
- 14.3 Market positioning of companies
- Matrix on companies position and classification
- 14.4 Alfa Laval AB
- Alfa Laval AB - Overview
- Alfa Laval AB - Business segments
- Alfa Laval AB - Key news
- Alfa Laval AB - Key offerings
- Alfa Laval AB - Segment focus
- SWOT
- 14.5 BIRO Manufacturing Co.
- BIRO Manufacturing Co. - Overview
- BIRO Manufacturing Co. - Product / Service
- BIRO Manufacturing Co. - Key offerings
- SWOT
- 14.6 Bizerba SE and Co. KG
- Bizerba SE and Co. KG - Overview
- Bizerba SE and Co. KG - Product / Service
- Bizerba SE and Co. KG - Key offerings
- SWOT
- 14.7 BRAHER INTERNACIONAL S.A.
- BRAHER INTERNACIONAL S.A. - Overview
- BRAHER INTERNACIONAL S.A. - Product / Service
- BRAHER INTERNACIONAL S.A. - Key offerings
- SWOT
- 14.8 Butcher Boy Machines International LLC
- Butcher Boy Machines International LLC - Overview
- Butcher Boy Machines International LLC - Product / Service
- Butcher Boy Machines International LLC - Key offerings
- SWOT
- 14.9 Frain Industries
- Frain Industries - Overview
- Frain Industries - Product / Service
- Frain Industries - Key offerings
- SWOT
- 14.10 GEA Group AG
- GEA Group AG - Overview
- GEA Group AG - Business segments
- GEA Group AG - Key offerings
- GEA Group AG - Segment focus
- SWOT
- 14.11 Globe Food Equipment Co.
- Globe Food Equipment Co. - Overview
- Globe Food Equipment Co. - Product / Service
- Globe Food Equipment Co. - Key offerings
- SWOT
- 14.12 Hobart Corp.
- Hobart Corp. - Overview
- Hobart Corp. - Product / Service
- Hobart Corp. - Key offerings
- SWOT
- 14.13 Meatek Food Machineries India Pvt. Ltd.
- Meatek Food Machineries India Pvt. Ltd. - Overview
- Meatek Food Machineries India Pvt. Ltd. - Product / Service
- Meatek Food Machineries India Pvt. Ltd. - Key offerings
- SWOT
- 14.14 Mepaco
- Mepaco - Overview
- Mepaco - Product / Service
- Mepaco - Key offerings
- SWOT
- 14.15 Minerva Omega Group s.r.l
- Minerva Omega Group s.r.l - Overview
- Minerva Omega Group s.r.l - Product / Service
- Minerva Omega Group s.r.l - Key offerings
- SWOT
- 14.16 Provisur Technologies Inc.
- Provisur Technologies Inc. - Overview
- Provisur Technologies Inc. - Product / Service
- Provisur Technologies Inc. - Key offerings
- SWOT
- 14.17 PSS SVIDNIK, a.s
- PSS SVIDNIK, a.s - Overview
- PSS SVIDNIK, a.s - Product / Service
- PSS SVIDNIK, a.s - Key offerings
- SWOT
- 14.18 The Middleby Corp.
- The Middleby Corp. - Overview
- The Middleby Corp. - Business segments
- The Middleby Corp. - Key offerings
- The Middleby Corp. - Segment focus
- SWOT
15 Appendix
- 15.1 Scope of the report
- 15.2 Inclusions and exclusions checklist
- Inclusions checklist
- Exclusions checklist
- 15.3 Currency conversion rates for US$
- Currency conversion rates for US$
- 15.4 Research methodology
- Research methodology
- 15.5 Data procurement
- Information sources
- 15.6 Data validation
- Data validation
- 15.7 Validation techniques employed for market sizing
- Validation techniques employed for market sizing
- 15.8 Data synthesis
- Data synthesis
- 15.9 360 degree market analysis
- 360 degree market analysis
- 15.10 List of abbreviations
- List of abbreviations
