|
|
市場調査レポート
商品コード
1911087
ドキソルビシンの世界市場、2026年~2030年Global Doxorubicin Market 2026-2030 |
||||||
|
|||||||
カスタマイズ可能
|
|||||||

| ドキソルビシンの世界市場、2026年~2030年 |
|
出版日: 2026年01月14日
発行: TechNavio
ページ情報: 英文 291 Pages
納期: 即納可能
|

概要
世界のドキソルビシン市場は、2025年から2030年にかけて6億2,580万米ドルの成長が見込まれ、予測期間中のCAGRは6.8%と予測されています。
本報告書では、世界のドキソルビシン市場に関する包括的な分析、市場規模と予測、動向、成長要因、課題に加え、約25社のベンダー分析を提供しています。
本レポートは、現在の市場状況、最新の動向と促進要因、市場環境全般に関する最新の分析を提供します。市場は、がん症例の増加、ドキソルビシンの製品発売増加、診断方法の進歩によって牽引されています。
本調査は、業界の主要関係者からの情報を含む一次情報と二次情報を客観的に組み合わせて実施されました。本レポートには、主要企業の分析に加え、包括的な市場規模データ、地域別分析を伴うセグメント、ベンダー情勢が含まれています。レポートには過去データと予測データが掲載されています。
| 市場範囲 | |
|---|---|
| 基準年 | 2026年 |
| 終了年 | 2030年 |
| 予測期間 | 2026年~2030年 |
| 成長モメンタム | 加速 |
| 前年比2026年 | 6.2% |
| CAGR | 6.8% |
| 増分額 | 6億2,580万米ドル |
本調査では、精密がん医療の導入が、今後数年間における世界のドキソルビシン市場成長を牽引する主要な要因の一つであると特定しています。また、革新的な生物学的製剤の研究開発の増加や、企業による無機的成長戦略の拡大が、市場における相当な需要につながると予想されます。
目次
第1章 エグゼクティブサマリー
第2章 Technavio分析
- 価格反応性・ライフサイクル・顧客購入バスケット・採用率・購入基準の分析
- インプットの重要性と差別化の要因
- 混乱の要因
- 促進要因と課題の影響
第3章 市場情勢
- 市場エコシステム
- 市場の特徴
- バリューチェーン分析
第4章 市場規模
- 市場の定義
- 市場セグメント分析
- 市場規模、2025年
- 市場の見通し、2025年~2030年
第5章 市場規模実績
- 世界のドキソルビシン市場、2020年~2024年
- 製剤セグメント分析、2020年~2024年
- 流通チャネルセグメント分析、2020年~2024年
- 用途別セグメント分析、2020年~2024年
- 地域別セグメント分析、2020年~2024年
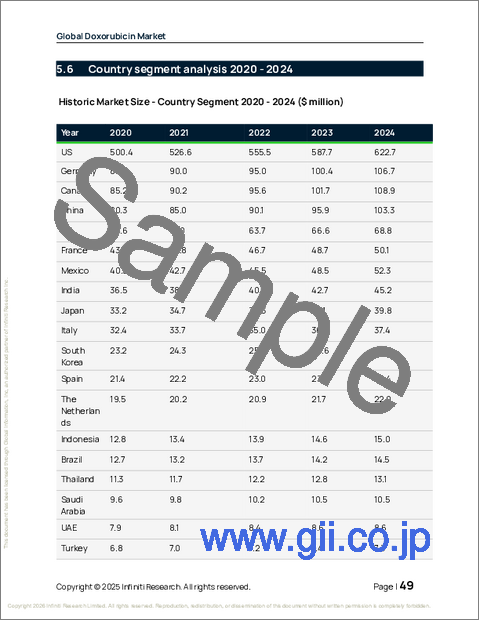
- 国別セグメント分析、2020年~2024年
第6章 定性分析
- AIの影響:世界のドキソルビシン市場
第7章 ファイブフォース分析
- ファイブフォースの要約
- 買い手の交渉力
- 供給企業の交渉力
- 新規参入業者の脅威
- 代替品の脅威
- 競争の脅威
- 市況
第8章 市場セグメンテーション:製剤別
- 比較:製剤別
- 凍結乾燥粉末
- ドキソルビシン注射剤
- 市場機会:製剤別
第9章 市場セグメンテーション:流通チャネル別
- 比較:流通チャネル別
- 病院薬局
- 小売薬局
- オンライン薬局
- その他
- 市場機会:流通チャネル別
第10章 市場セグメンテーション:用途別
- 比較:用途別
- 乳がん
- 白血病
- リンパ腫
- 膀胱がん
- その他
- 市場機会:用途別
第11章 顧客情勢
第12章 地域別情勢
- 地域別セグメンテーション
- 地域別比較
- 北米
- 米国
- カナダ
- メキシコ
- 欧州
- ドイツ
- イギリス
- フランス
- イタリア
- スペイン
- オランダ
- アジア
- 中国
- インド
- 日本
- 韓国
- インドネシア
- タイ
- 世界のその他の地域
- ブラジル
- サウジアラビア
- UAE
- トルコ
- アルゼンチン
- コロンビア
- 南アフリカ
- イスラエル
- 市場機会:地域別
第13章 促進要因、課題、機会
- 市場促進要因
- 市場の課題
- 促進要因と課題の影響
- 市場機会
第14章 競合情勢
- 概要
- 競合情勢
- 混乱の状況
- 業界のリスク
第15章 競合分析
- 企業プロファイル
- 企業ランキング指数
- 企業の市場ポジショニング
- Baxter International Inc.
- Cipla Inc.
- Dr Reddys Laboratories Ltd.
- Glenmark Pharmaceuticals Ltd.
- Hikma Pharmaceuticals Plc
- Intas Pharmaceuticals Ltd.
- Merck KGaA
- Novartis AG
- Pfizer Inc.
- Pharmagen CZ s.r.o
- S. G. Biopharm Pvt. Ltd.
- Sun Pharmaceutical Industries Ltd.
- Synbias Pharma AG
- Teva Pharmaceutical Ltd.
- Zydus Lifesciences Ltd.

