|
|
市場調査レポート
商品コード
1559368
MRI対応輸液ポンプの世界市場、2024年~2028年Global MRI Compatible IV Infusion Pumps Market 2024-2028 |
||||||
|
|||||||
カスタマイズ可能
|
|||||||


| MRI対応輸液ポンプの世界市場、2024年~2028年 |
|
出版日: 2024年08月15日
発行: TechNavio
ページ情報: 英文 138 Pages
納期: 即納可能
|

全表示
- 概要
- 図表
- 目次
MRI対応輸液ポンプ市場、2024年~2028年
MRI対応輸液ポンプ市場は2023-2028年に1億2,020万米ドル、予測期間中のCAGRは7.09%で成長すると予測されます。当レポートでは、MRI対応輸液ポンプ市場の全体的な分析、市場規模・予測、動向、成長促進要因、課題、約25のベンダーを網羅したベンダー分析などを掲載しています。
現在の市場シナリオ、最新動向と促進要因、市場環境全体に関する最新分析を提供しています。慢性疾患の増加、MRI診断に対する需要の増加、新製品発売の増加などが市場を牽引しています。
| 市場範囲 | |
|---|---|
| 基準年 | 2024 |
| 終了年 | 2028 |
| 予測期間 | 2024-2028 |
| 成長モメンタム | 加速 |
| 前年比2024年 | 6.49% |
| CAGR | 7.09% |
| 増分額 | 1億2,020万米ドル |
本調査では、今後数年間のMRI対応輸液ポンプ市場成長を牽引する主な要因の1つとして、新興国における高い成長可能性を挙げています。また、デバイス技術の進歩や各国政府によるヘルスケアインフラへの投資拡大も、市場の大きな需要につながると思われます。
目次
第1章 エグゼクティブサマリー
- 市場概要
第2章 市場情勢
- 市場エコシステム
- 市場の特徴
- バリューチェーン分析
第3章 市場規模の評価
- 市場の定義
- 市場セグメント分析
- 市場規模 2023
- 市場の見通し 2023-2028
第4章 市場規模実績
- MRI対応輸液ポンプの世界市場 2018-2022
- 製品タイプ別セグメント分析 2018-2022
- 地域別セグメント分析 2018-2022
- 国別セグメント分析 2018-2022
第5章 ファイブフォース分析
- ファイブフォースの要約
- 買い手の交渉力
- 供給企業の交渉力
- 新規参入業者の脅威
- 代替品の脅威
- 競争の脅威
- 市況
第6章 市場セグメンテーション:製品タイプ別
- 市場セグメンテーション
- 比較:製品タイプ別
- ポンプ:市場規模と予測 2023-2028
- チューブと使い捨て製品:市場規模と予測 2023-2028
- 市場機会:製品タイプ別
第7章 顧客情勢
- 顧客情勢の概要
第8章 地域別情勢
- 地域別セグメンテーション
- 地域別比較
- 北米:市場規模と予測 2023-2028
- 欧州:市場規模と予測 2023-2028
- アジア:市場規模と予測 2023-2028
- 世界のその他の地域:市場規模と予測 2023-2028
- 米国:市場規模と予測 2023-2028
- ドイツ:市場規模と予測 2023-2028
- 中国:市場規模と予測 2023-2028
- フランス:市場規模と予測 2023-2028
- カナダ:市場規模と予測 2023-2028
- 市場機会:地域情勢別
第9章 促進要因・課題・機会・抑制要因
- 市場促進要因
- 市場の課題
- 促進要因と課題の影響
- 市場の機会・抑制要因
第10章 競合情勢
- 概要
- 競合情勢
- 混乱の状況
- 業界のリスク
第11章 競合分析
- 企業プロファイル
- 企業の市場ポジショニング
- Arcomed AG
- B.Braun SE
- Baxter International Inc.
- Becton Dickinson and Co.
- Beijing KellyMed Co. Ltd.
- Fresenius SE and Co. KGaA
- ICU Medical Inc.
- IRadimed Corp.
- Medtronic Plc
- Terumo Europe NV
第12章 付録
Exhibits:
- Exhibits1: Executive Summary - Chart on Market Overview
- Exhibits2: Executive Summary - Data Table on Market Overview
- Exhibits3: Executive Summary - Chart on Global Market Characteristics
- Exhibits4: Executive Summary - Chart on Market By Geographical Landscape
- Exhibits5: Executive Summary - Chart on Market Segmentation by Product Type
- Exhibits6: Executive Summary - Chart on Incremental Growth
- Exhibits7: Executive Summary - Data Table on Incremental Growth
- Exhibits8: Executive Summary - Chart on Company Market Positioning
- Exhibits9: Parent Market
- Exhibits10: Data Table on - Parent Market
- Exhibits11: Market characteristics analysis
- Exhibits12: Value Chain Analysis
- Exhibits13: Offerings of companies included in the market definition
- Exhibits14: Market segments
- Exhibits15: Chart on Global - Market size and forecast 2023-2028 ($ million)
- Exhibits16: Data Table on Global - Market size and forecast 2023-2028 ($ million)
- Exhibits17: Chart on Global Market: Year-over-year growth 2023-2028 (%)
- Exhibits18: Data Table on Global Market: Year-over-year growth 2023-2028 (%)
- Exhibits19: Historic Market Size - Data Table on Global MRI Compatible IV Infusion Pumps Market 2018 - 2022 ($ million)
- Exhibits20: Historic Market Size - Product Type Segment 2018 - 2022 ($ million)
- Exhibits21: Historic Market Size - Geography Segment 2018 - 2022 ($ million)
- Exhibits22: Historic Market Size - Country Segment 2018 - 2022 ($ million)
- Exhibits23: Five forces analysis - Comparison between 2023 and 2028
- Exhibits24: Bargaining power of buyers - Impact of key factors 2023 and 2028
- Exhibits25: Bargaining power of suppliers - Impact of key factors in 2023 and 2028
- Exhibits26: Threat of new entrants - Impact of key factors in 2023 and 2028
- Exhibits27: Threat of substitutes - Impact of key factors in 2023 and 2028
- Exhibits28: Threat of rivalry - Impact of key factors in 2023 and 2028
- Exhibits29: Chart on Market condition - Five forces 2023 and 2028
- Exhibits30: Chart on Product Type - Market share 2023-2028 (%)
- Exhibits31: Data Table on Product Type - Market share 2023-2028 (%)
- Exhibits32: Chart on Comparison by Product Type
- Exhibits33: Data Table on Comparison by Product Type
- Exhibits34: Chart on Pumps - Market size and forecast 2023-2028 ($ million)
- Exhibits35: Data Table on Pumps - Market size and forecast 2023-2028 ($ million)
- Exhibits36: Chart on Pumps - Year-over-year growth 2023-2028 (%)
- Exhibits37: Data Table on Pumps - Year-over-year growth 2023-2028 (%)
- Exhibits38: Chart on Tubing and disposables - Market size and forecast 2023-2028 ($ million)
- Exhibits39: Data Table on Tubing and disposables - Market size and forecast 2023-2028 ($ million)
- Exhibits40: Chart on Tubing and disposables - Year-over-year growth 2023-2028 (%)
- Exhibits41: Data Table on Tubing and disposables - Year-over-year growth 2023-2028 (%)
- Exhibits42: Market opportunity by Product Type ($ million)
- Exhibits43: Data Table on Market opportunity by Product Type ($ million)
- Exhibits44: Analysis of price sensitivity, lifecycle, customer purchase basket, adoption rates, and purchase criteria
- Exhibits45: Chart on Market share By Geographical Landscape 2023-2028 (%)
- Exhibits46: Data Table on Market share By Geographical Landscape 2023-2028 (%)
- Exhibits47: Chart on Geographic comparison
- Exhibits48: Data Table on Geographic comparison
- Exhibits49: Chart on North America - Market size and forecast 2023-2028 ($ million)
- Exhibits50: Data Table on North America - Market size and forecast 2023-2028 ($ million)
- Exhibits51: Chart on North America - Year-over-year growth 2023-2028 (%)
- Exhibits52: Data Table on North America - Year-over-year growth 2023-2028 (%)
- Exhibits53: Chart on Europe - Market size and forecast 2023-2028 ($ million)
- Exhibits54: Data Table on Europe - Market size and forecast 2023-2028 ($ million)
- Exhibits55: Chart on Europe - Year-over-year growth 2023-2028 (%)
- Exhibits56: Data Table on Europe - Year-over-year growth 2023-2028 (%)
- Exhibits57: Chart on Asia - Market size and forecast 2023-2028 ($ million)
- Exhibits58: Data Table on Asia - Market size and forecast 2023-2028 ($ million)
- Exhibits59: Chart on Asia - Year-over-year growth 2023-2028 (%)
- Exhibits60: Data Table on Asia - Year-over-year growth 2023-2028 (%)
- Exhibits61: Chart on Rest of World (ROW) - Market size and forecast 2023-2028 ($ million)
- Exhibits62: Data Table on Rest of World (ROW) - Market size and forecast 2023-2028 ($ million)
- Exhibits63: Chart on Rest of World (ROW) - Year-over-year growth 2023-2028 (%)
- Exhibits64: Data Table on Rest of World (ROW) - Year-over-year growth 2023-2028 (%)
- Exhibits65: Chart on US - Market size and forecast 2023-2028 ($ million)
- Exhibits66: Data Table on US - Market size and forecast 2023-2028 ($ million)
- Exhibits67: Chart on US - Year-over-year growth 2023-2028 (%)
- Exhibits68: Data Table on US - Year-over-year growth 2023-2028 (%)
- Exhibits69: Chart on Germany - Market size and forecast 2023-2028 ($ million)
- Exhibits70: Data Table on Germany - Market size and forecast 2023-2028 ($ million)
- Exhibits71: Chart on Germany - Year-over-year growth 2023-2028 (%)
- Exhibits72: Data Table on Germany - Year-over-year growth 2023-2028 (%)
- Exhibits73: Chart on China - Market size and forecast 2023-2028 ($ million)
- Exhibits74: Data Table on China - Market size and forecast 2023-2028 ($ million)
- Exhibits75: Chart on China - Year-over-year growth 2023-2028 (%)
- Exhibits76: Data Table on China - Year-over-year growth 2023-2028 (%)
- Exhibits77: Chart on France - Market size and forecast 2023-2028 ($ million)
- Exhibits78: Data Table on France - Market size and forecast 2023-2028 ($ million)
- Exhibits79: Chart on France - Year-over-year growth 2023-2028 (%)
- Exhibits80: Data Table on France - Year-over-year growth 2023-2028 (%)
- Exhibits81: Chart on Canada - Market size and forecast 2023-2028 ($ million)
- Exhibits82: Data Table on Canada - Market size and forecast 2023-2028 ($ million)
- Exhibits83: Chart on Canada - Year-over-year growth 2023-2028 (%)
- Exhibits84: Data Table on Canada - Year-over-year growth 2023-2028 (%)
- Exhibits85: Market opportunity By Geographical Landscape ($ million)
- Exhibits86: Data Tables on Market opportunity By Geographical Landscape ($ million)
- Exhibits87: Impact of drivers and challenges in 2023 and 2028
- Exhibits88: Overview on criticality of inputs and factors of differentiation
- Exhibits89: Overview on factors of disruption
- Exhibits90: Impact of key risks on business
- Exhibits91: Companies covered
- Exhibits92: Matrix on companies position and classification
- Exhibits93: Arcomed AG - Overview
- Exhibits94: Arcomed AG - Product / Service
- Exhibits95: Arcomed AG - Key offerings
- Exhibits96: B.Braun SE - Overview
- Exhibits97: B.Braun SE - Business segments
- Exhibits98: B.Braun SE - Key news
- Exhibits99: B.Braun SE - Key offerings
- Exhibits100: B.Braun SE - Segment focus
- Exhibits101: Baxter International Inc. - Overview
- Exhibits102: Baxter International Inc. - Business segments
- Exhibits103: Baxter International Inc. - Key news
- Exhibits104: Baxter International Inc. - Key offerings
- Exhibits105: Baxter International Inc. - Segment focus
- Exhibits106: Becton Dickinson and Co. - Overview
- Exhibits107: Becton Dickinson and Co. - Business segments
- Exhibits108: Becton Dickinson and Co. - Key news
- Exhibits109: Becton Dickinson and Co. - Key offerings
- Exhibits110: Becton Dickinson and Co. - Segment focus
- Exhibits111: Beijing KellyMed Co. Ltd. - Overview
- Exhibits112: Beijing KellyMed Co. Ltd. - Product / Service
- Exhibits113: Beijing KellyMed Co. Ltd. - Key offerings
- Exhibits114: Fresenius SE and Co. KGaA - Overview
- Exhibits115: Fresenius SE and Co. KGaA - Business segments
- Exhibits116: Fresenius SE and Co. KGaA - Key news
- Exhibits117: Fresenius SE and Co. KGaA - Key offerings
- Exhibits118: Fresenius SE and Co. KGaA - Segment focus
- Exhibits119: ICU Medical Inc. - Overview
- Exhibits120: ICU Medical Inc. - Product / Service
- Exhibits121: ICU Medical Inc. - Key offerings
- Exhibits122: IRadimed Corp. - Overview
- Exhibits123: IRadimed Corp. - Product / Service
- Exhibits124: IRadimed Corp. - Key offerings
- Exhibits125: Medtronic Plc - Overview
- Exhibits126: Medtronic Plc - Business segments
- Exhibits127: Medtronic Plc - Key news
- Exhibits128: Medtronic Plc - Key offerings
- Exhibits129: Medtronic Plc - Segment focus
- Exhibits130: Terumo Europe NV - Overview
- Exhibits131: Terumo Europe NV - Product / Service
- Exhibits132: Terumo Europe NV - Key offerings
- Exhibits133: Inclusions checklist
- Exhibits134: Exclusions checklist
- Exhibits135: Currency conversion rates for US$
- Exhibits136: Research methodology
- Exhibits137: Information sources
- Exhibits138: Data validation
- Exhibits139: Validation techniques employed for market sizing
- Exhibits140: Data synthesis
- Exhibits141: 360 degree market analysis
- Exhibits142: List of abbreviations
MRI Compatible IV Infusion Pumps Market 2024-2028
The MRI compatible IV infusion pumps market is forecasted to grow by USD 120.2 mn during 2023-2028, accelerating at a CAGR of 7.09% during the forecast period. The report on the MRI compatible IV infusion pumps market provides a holistic analysis, market size and forecast, trends, growth drivers, and challenges, as well as vendor analysis covering around 25 vendors.
The report offers an up-to-date analysis regarding the current market scenario, the latest trends and drivers, and the overall market environment. The market is driven by increasing prevalence of chronic diseases, increasing demand for MRI diagnostics, and rising number of new product launches.
| Market Scope | |
|---|---|
| Base Year | 2024 |
| End Year | 2028 |
| Series Year | 2024-2028 |
| Growth Momentum | Accelerate |
| YOY 2024 | 6.49% |
| CAGR | 7.09% |
| Incremental Value | $120.2 mn |
Technavio's MRI compatible IV infusion pumps market is segmented as below:
By Product Type
- Pumps
- Tubing and disposables
By Geographical Landscape
- North America
- Europe
- Asia
- Rest of World (ROW)
This study identifies the high growth potential in emerging countries as one of the prime reasons driving the MRI compatible IV infusion pumps market growth during the next few years. Also, technological advancements in device technology and increased investments by governments in healthcare infrastructure will lead to sizable demand in the market.
The report on the MRI compatible IV infusion pumps market covers the following areas:
- MRI compatible IV infusion pumps market sizing
- MRI compatible IV infusion pumps market forecast
- MRI compatible IV infusion pumps market industry analysis
The vendor analysis is designed to help clients improve their market position, and in line with this, this report provides a detailed analysis of several leading MRI compatible IV infusion pumps market vendors that include ADOX SA, Arcomed AG, B.Braun SE, Baxter International Inc., Becton Dickinson and Co., Beijing KellyMed Co. Ltd., CODAN ARGUS AG, Digicare Biomedical Technology Inc., Eitan Medical Ltd., Flowonix Medical Inc., Fresenius SE and Co. KGaA, ICU Medical Inc., IRadimed Corp., Medtronic PLC, Nipro Corp., Shenzhen Mindray BioMedical Electronics Co. Ltd, Terumo Europe NV, vTitan Corp. Pvt Ltd., and Zyno Medical. Also, the MRI compatible IV infusion pumps market analysis report includes information on upcoming trends and challenges that will influence market growth. This is to help companies strategize and leverage all forthcoming growth opportunities.
The study was conducted using an objective combination of primary and secondary information including inputs from key participants in the industry. The report contains a comprehensive market and vendor landscape in addition to an analysis of the key vendors.
The publisher presents a detailed picture of the market by the way of study, synthesis, and summation of data from multiple sources by an analysis of key parameters such as profit, pricing, competition, and promotions. It presents various market facets by identifying the key industry influencers. The data presented is comprehensive, reliable, and a result of extensive research - both primary and secondary. The market research reports provide a complete competitive landscape and an in-depth vendor selection methodology and analysis using qualitative and quantitative research to forecast the accurate market growth.
Table of Contents
1 Executive Summary
- 1.1 Market overview
- Executive Summary - Chart on Market Overview
- Executive Summary - Data Table on Market Overview
- Executive Summary - Chart on Global Market Characteristics
- Executive Summary - Chart on Market By Geographical Landscape
- Executive Summary - Chart on Market Segmentation by Product Type
- Executive Summary - Chart on Incremental Growth
- Executive Summary - Data Table on Incremental Growth
- Executive Summary - Chart on Company Market Positioning
2 Market Landscape
- 2.1 Market ecosystem
- Parent Market
- Data Table on - Parent Market
- 2.2 Market characteristics
- Market characteristics analysis
- 2.3 Value chain analysis
- Value Chain Analysis
3 Market Sizing
- 3.1 Market definition
- Offerings of companies included in the market definition
- 3.2 Market segment analysis
- Market segments
- 3.3 Market size 2023
- 3.4 Market outlook: Forecast for 2023-2028
- Chart on Global - Market size and forecast 2023-2028 ($ million)
- Data Table on Global - Market size and forecast 2023-2028 ($ million)
- Chart on Global Market: Year-over-year growth 2023-2028 (%)
- Data Table on Global Market: Year-over-year growth 2023-2028 (%)
4 Historic Market Size
- 4.1 Global MRI Compatible IV Infusion Pumps Market 2018 - 2022
- Historic Market Size - Data Table on Global MRI Compatible IV Infusion Pumps Market 2018 - 2022 ($ million)
- 4.2 Product Type segment analysis 2018 - 2022
- Historic Market Size - Product Type Segment 2018 - 2022 ($ million)
- 4.3 Geography segment analysis 2018 - 2022
- Historic Market Size - Geography Segment 2018 - 2022 ($ million)
- 4.4 Country segment analysis 2018 - 2022
- Historic Market Size - Country Segment 2018 - 2022 ($ million)
5 Five Forces Analysis
- 5.1 Five forces summary
- Five forces analysis - Comparison between 2023 and 2028
- 5.2 Bargaining power of buyers
- Bargaining power of buyers - Impact of key factors 2023 and 2028
- 5.3 Bargaining power of suppliers
- Bargaining power of suppliers - Impact of key factors in 2023 and 2028
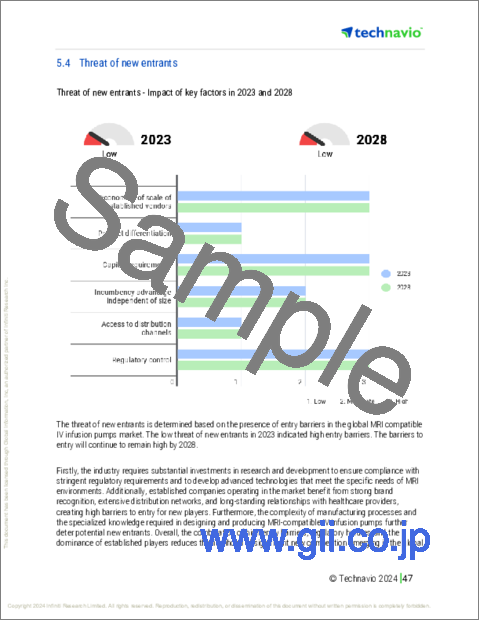
- 5.4 Threat of new entrants
- Threat of new entrants - Impact of key factors in 2023 and 2028
- 5.5 Threat of substitutes
- Threat of substitutes - Impact of key factors in 2023 and 2028
- 5.6 Threat of rivalry
- Threat of rivalry - Impact of key factors in 2023 and 2028
- 5.7 Market condition
- Chart on Market condition - Five forces 2023 and 2028
6 Market Segmentation by Product Type
- 6.1 Market segments
- Chart on Product Type - Market share 2023-2028 (%)
- Data Table on Product Type - Market share 2023-2028 (%)
- 6.2 Comparison by Product Type
- Chart on Comparison by Product Type
- Data Table on Comparison by Product Type
- 6.3 Pumps - Market size and forecast 2023-2028
- Chart on Pumps - Market size and forecast 2023-2028 ($ million)
- Data Table on Pumps - Market size and forecast 2023-2028 ($ million)
- Chart on Pumps - Year-over-year growth 2023-2028 (%)
- Data Table on Pumps - Year-over-year growth 2023-2028 (%)
- 6.4 Tubing and disposables - Market size and forecast 2023-2028
- Chart on Tubing and disposables - Market size and forecast 2023-2028 ($ million)
- Data Table on Tubing and disposables - Market size and forecast 2023-2028 ($ million)
- Chart on Tubing and disposables - Year-over-year growth 2023-2028 (%)
- Data Table on Tubing and disposables - Year-over-year growth 2023-2028 (%)
- 6.5 Market opportunity by Product Type
- Market opportunity by Product Type ($ million)
- Data Table on Market opportunity by Product Type ($ million)
7 Customer Landscape
- 7.1 Customer landscape overview
- Analysis of price sensitivity, lifecycle, customer purchase basket, adoption rates, and purchase criteria
8 Geographic Landscape
- 8.1 Geographic segmentation
- Chart on Market share By Geographical Landscape 2023-2028 (%)
- Data Table on Market share By Geographical Landscape 2023-2028 (%)
- 8.2 Geographic comparison
- Chart on Geographic comparison
- Data Table on Geographic comparison
- 8.3 North America - Market size and forecast 2023-2028
- Chart on North America - Market size and forecast 2023-2028 ($ million)
- Data Table on North America - Market size and forecast 2023-2028 ($ million)
- Chart on North America - Year-over-year growth 2023-2028 (%)
- Data Table on North America - Year-over-year growth 2023-2028 (%)
- 8.4 Europe - Market size and forecast 2023-2028
- Chart on Europe - Market size and forecast 2023-2028 ($ million)
- Data Table on Europe - Market size and forecast 2023-2028 ($ million)
- Chart on Europe - Year-over-year growth 2023-2028 (%)
- Data Table on Europe - Year-over-year growth 2023-2028 (%)
- 8.5 Asia - Market size and forecast 2023-2028
- Chart on Asia - Market size and forecast 2023-2028 ($ million)
- Data Table on Asia - Market size and forecast 2023-2028 ($ million)
- Chart on Asia - Year-over-year growth 2023-2028 (%)
- Data Table on Asia - Year-over-year growth 2023-2028 (%)
- 8.6 Rest of World (ROW) - Market size and forecast 2023-2028
- Chart on Rest of World (ROW) - Market size and forecast 2023-2028 ($ million)
- Data Table on Rest of World (ROW) - Market size and forecast 2023-2028 ($ million)
- Chart on Rest of World (ROW) - Year-over-year growth 2023-2028 (%)
- Data Table on Rest of World (ROW) - Year-over-year growth 2023-2028 (%)
- 8.7 US - Market size and forecast 2023-2028
- Chart on US - Market size and forecast 2023-2028 ($ million)
- Data Table on US - Market size and forecast 2023-2028 ($ million)
- Chart on US - Year-over-year growth 2023-2028 (%)
- Data Table on US - Year-over-year growth 2023-2028 (%)
- 8.8 Germany - Market size and forecast 2023-2028
- Chart on Germany - Market size and forecast 2023-2028 ($ million)
- Data Table on Germany - Market size and forecast 2023-2028 ($ million)
- Chart on Germany - Year-over-year growth 2023-2028 (%)
- Data Table on Germany - Year-over-year growth 2023-2028 (%)
- 8.9 China - Market size and forecast 2023-2028
- Chart on China - Market size and forecast 2023-2028 ($ million)
- Data Table on China - Market size and forecast 2023-2028 ($ million)
- Chart on China - Year-over-year growth 2023-2028 (%)
- Data Table on China - Year-over-year growth 2023-2028 (%)
- 8.10 France - Market size and forecast 2023-2028
- Chart on France - Market size and forecast 2023-2028 ($ million)
- Data Table on France - Market size and forecast 2023-2028 ($ million)
- Chart on France - Year-over-year growth 2023-2028 (%)
- Data Table on France - Year-over-year growth 2023-2028 (%)
- 8.11 Canada - Market size and forecast 2023-2028
- Chart on Canada - Market size and forecast 2023-2028 ($ million)
- Data Table on Canada - Market size and forecast 2023-2028 ($ million)
- Chart on Canada - Year-over-year growth 2023-2028 (%)
- Data Table on Canada - Year-over-year growth 2023-2028 (%)
- 8.12 Market opportunity By Geographical Landscape
- Market opportunity By Geographical Landscape ($ million)
- Data Tables on Market opportunity By Geographical Landscape ($ million)
9 Drivers, Challenges, and Opportunity/Restraints
- 9.1 Market drivers
- 9.2 Market challenges
- 9.3 Impact of drivers and challenges
- Impact of drivers and challenges in 2023 and 2028
- 9.4 Market opportunities/restraints
10 Competitive Landscape
- 10.1 Overview
- 10.2 Competitive Landscape
- Overview on criticality of inputs and factors of differentiation
- 10.3 Landscape disruption
- Overview on factors of disruption
- 10.4 Industry risks
- Impact of key risks on business
11 Competitive Analysis
- 11.1 Companies profiled
- Companies covered
- 11.2 Market positioning of companies
- Matrix on companies position and classification
- 11.3 Arcomed AG
- Arcomed AG - Overview
- Arcomed AG - Product / Service
- Arcomed AG - Key offerings
- 11.4 B.Braun SE
- B.Braun SE - Overview
- B.Braun SE - Business segments
- B.Braun SE - Key news
- B.Braun SE - Key offerings
- B.Braun SE - Segment focus
- 11.5 Baxter International Inc.
- Baxter International Inc. - Overview
- Baxter International Inc. - Business segments
- Baxter International Inc. - Key news
- Baxter International Inc. - Key offerings
- Baxter International Inc. - Segment focus
- 11.6 Becton Dickinson and Co.
- Becton Dickinson and Co. - Overview
- Becton Dickinson and Co. - Business segments
- Becton Dickinson and Co. - Key news
- Becton Dickinson and Co. - Key offerings
- Becton Dickinson and Co. - Segment focus
- 11.7 Beijing KellyMed Co. Ltd.
- Beijing KellyMed Co. Ltd. - Overview
- Beijing KellyMed Co. Ltd. - Product / Service
- Beijing KellyMed Co. Ltd. - Key offerings
- 11.8 Fresenius SE and Co. KGaA
- Fresenius SE and Co. KGaA - Overview
- Fresenius SE and Co. KGaA - Business segments
- Fresenius SE and Co. KGaA - Key news
- Fresenius SE and Co. KGaA - Key offerings
- Fresenius SE and Co. KGaA - Segment focus
- 11.9 ICU Medical Inc.
- ICU Medical Inc. - Overview
- ICU Medical Inc. - Product / Service
- ICU Medical Inc. - Key offerings
- 11.10 IRadimed Corp.
- IRadimed Corp. - Overview
- IRadimed Corp. - Product / Service
- IRadimed Corp. - Key offerings
- 11.11 Medtronic Plc
- Medtronic Plc - Overview
- Medtronic Plc - Business segments
- Medtronic Plc - Key news
- Medtronic Plc - Key offerings
- Medtronic Plc - Segment focus
- 11.12 Terumo Europe NV
- Terumo Europe NV - Overview
- Terumo Europe NV - Product / Service
- Terumo Europe NV - Key offerings
12 Appendix
- 12.1 Scope of the report
- 12.2 Inclusions and exclusions checklist
- Inclusions checklist
- Exclusions checklist
- 12.3 Currency conversion rates for US$
- Currency conversion rates for US$
- 12.4 Research methodology
- Research methodology
- 12.5 Data procurement
- Information sources
- 12.6 Data validation
- Data validation
- 12.7 Validation techniques employed for market sizing
- Validation techniques employed for market sizing
- 12.8 Data synthesis
- Data synthesis
- 12.9 360 degree market analysis
- 360 degree market analysis
- 12.10 List of abbreviations
- List of abbreviations

