|
|
市場調査レポート
商品コード
1559319
垂直農法技術の世界市場、2024~2028年Global Vertical Farming Technologies Market 2024-2028 |
||||||

|
|||||||
カスタマイズ可能
|
|||||||

| 垂直農法技術の世界市場、2024~2028年 |
|
出版日: 2024年08月16日
発行: TechNavio
ページ情報: 英文 162 Pages
納期: 即納可能
|

全表示
- 概要
- 図表
- 目次
垂直農法技術市場は2023~2028年に178億1,040万米ドル、予測期間中のCAGRは31.33%で成長すると予測されます。
当レポートでは、垂直農法技術市場の全体的な分析、市場規模・予測、動向、成長促進要因、課題、約25のベンダーを網羅したベンダー分析などを掲載しています。
現在の市場シナリオ、最新動向と促進要因、市場環境全体に関する最新分析を提供しています。市場は、農業の人件費削減への関心の高まり、投資と資金調達の増加、食品需要の増加に対応するニーズの高まりによって牽引されています。
| 市場範囲 | |
|---|---|
| 基準年 | 2024年 |
| 終了年 | 2028年 |
| 予測期間 | 2024~2028年 |
| 成長モメンタム | 加速 |
| 前年比[2024年] | 25.12% |
| CAGR | 31.33% |
| 増分額 | 178億1,040万米ドル |
本調査では、今後数年間の垂直農法技術市場成長を牽引する主要要因の1つとして、節水と省エネのメリットを提供する技術への傾斜が強まっていることを挙げています。また、自動化されたシステムによる垂直農法技術の需要の増加や、特許取得済みシステムによる垂直農法技術の採用が増加していることも、市場の大きな需要につながると考えられます。
目次
第1章 エグゼクティブサマリー
- 市場概要
第2章 市場情勢
- 市場エコシステム
- 市場の特徴
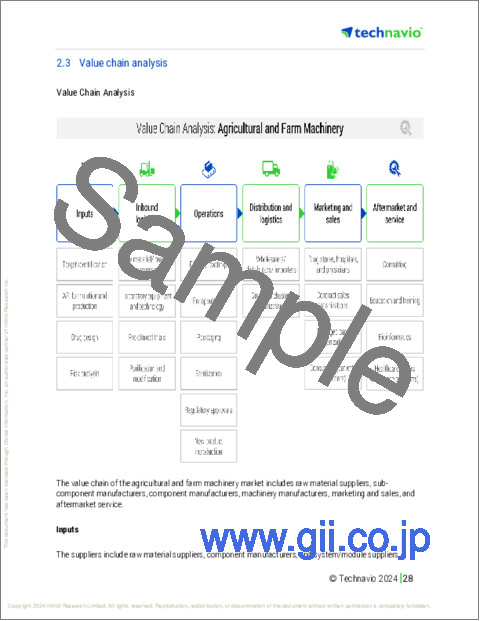
- バリューチェーン分析
第3章 市場規模の評価
- 市場の定義
- 市場セグメント分析
- 市場規模 2023年
- 市場の展望 2023~2028年
第4章 市場規模実績
- 垂直農法技術の世界市場 2018~2022年
- 用途別セグメント分析 2018~2022年
- タイプ別セグメント分析 2018~2022年
- 地域別セグメント分析 2018~2022年
- 国別セグメント分析 2018~2022年
第5章 ファイブフォース分析
- ファイブフォースの要約
- 買い手の交渉力
- 供給企業の交渉力
- 新規参入業者の脅威
- 代替品の脅威
- 競争の脅威
- 市況
第6章 市場セグメンテーション:用途別
- 市場セグメンテーション
- 比較:用途別
- 水耕栽培:市場規模と予測 2023~2028年
- エアロポニックス:市場規模と予測 2023~2028年
- アクアポニックス:市場規模と予測 2023~2028年
- 市場機会:用途別
第7章 市場セグメンテーション:タイプ別
- 市場セグメンテーション
- 比較:タイプ別
- 輸送コンテナ:市場規模と予測 2023~2028年
- 建物ベース:市場規模と予測 2023~2028年
- 市場機会:タイプ別
第8章 顧客情勢
- 顧客情勢概要
第9章 地域別情勢
- 地域別セグメンテーション
- 比較:地域別
- 欧州:市場規模と予測 2023~2028年
- アジア太平洋:市場規模と予測 2023~2028年
- 北米:市場規模と予測 2023~2028年
- 南米:市場規模と予測 2023~2028年
- 中東・アフリカ:市場規模と予測 2023~2028年
- 米国:市場規模と予測 2023~2028年
- オランダ:市場規模と予測 2023~2028年
- 日本:市場規模と予測 2023~2028年
- 中国:市場規模と予測 2023~2028年
- カナダ:市場規模と予測 2023~2028年
- 市場機会:地域情勢別
第10章 促進要因・課題・機会・抑制要因
- 市場促進要因
- 市場課題
- 促進要因と課題の影響
- 市場の機会・抑制要因
第11章 競合情勢
- 概要
- 競合情勢
- 混乱の状況
- 業界のリスク
第12章 競合分析
- 企業プロファイル
- 企業の市場ポジショニング
- AeroFarms LLC
- Bowery Farming Inc.
- Eden Green Technology
- Freight Farms Inc.
- Gronska Stadsodling
- Grow Pod Solutions
- GrowUp Farms Ltd.
- Hort Americas LLC
- IGS Ltd.
- Koninklijke Philips N.V.
- Plenty Unlimited Inc.
- SANANBIO
- SPREAD Co. Ltd.
- Vertical Farm Systems Pty Ltd
第13章 付録
Exhibits:
- Exhibits1: Executive Summary - Chart on Market Overview
- Exhibits2: Executive Summary - Data Table on Market Overview
- Exhibits3: Executive Summary - Chart on Global Market Characteristics
- Exhibits4: Executive Summary - Chart on Market By Geographical Landscape
- Exhibits5: Executive Summary - Chart on Market Segmentation by Application
- Exhibits6: Executive Summary - Chart on Market Segmentation by Type
- Exhibits7: Executive Summary - Chart on Incremental Growth
- Exhibits8: Executive Summary - Data Table on Incremental Growth
- Exhibits9: Executive Summary - Chart on Company Market Positioning
- Exhibits10: Parent Market
- Exhibits11: Data Table on - Parent Market
- Exhibits12: Market characteristics analysis
- Exhibits13: Value Chain Analysis
- Exhibits14: Offerings of companies included in the market definition
- Exhibits15: Market segments
- Exhibits16: Chart on Global - Market size and forecast 2023-2028 ($ million)
- Exhibits17: Data Table on Global - Market size and forecast 2023-2028 ($ million)
- Exhibits18: Chart on Global Market: Year-over-year growth 2023-2028 (%)
- Exhibits19: Data Table on Global Market: Year-over-year growth 2023-2028 (%)
- Exhibits20: Historic Market Size - Data Table on Global Vertical Farming Technologies Market 2018 - 2022 ($ million)
- Exhibits21: Historic Market Size - Application Segment 2018 - 2022 ($ million)
- Exhibits22: Historic Market Size - Type Segment 2018 - 2022 ($ million)
- Exhibits23: Historic Market Size - Geography Segment 2018 - 2022 ($ million)
- Exhibits24: Historic Market Size - Country Segment 2018 - 2022 ($ million)
- Exhibits25: Five forces analysis - Comparison between 2023 and 2028
- Exhibits26: Bargaining power of buyers - Impact of key factors 2023 and 2028
- Exhibits27: Bargaining power of suppliers - Impact of key factors in 2023 and 2028
- Exhibits28: Threat of new entrants - Impact of key factors in 2023 and 2028
- Exhibits29: Threat of substitutes - Impact of key factors in 2023 and 2028
- Exhibits30: Threat of rivalry - Impact of key factors in 2023 and 2028
- Exhibits31: Chart on Market condition - Five forces 2023 and 2028
- Exhibits32: Chart on Application - Market share 2023-2028 (%)
- Exhibits33: Data Table on Application - Market share 2023-2028 (%)
- Exhibits34: Chart on Comparison by Application
- Exhibits35: Data Table on Comparison by Application
- Exhibits36: Chart on Hydroponics - Market size and forecast 2023-2028 ($ million)
- Exhibits37: Data Table on Hydroponics - Market size and forecast 2023-2028 ($ million)
- Exhibits38: Chart on Hydroponics - Year-over-year growth 2023-2028 (%)
- Exhibits39: Data Table on Hydroponics - Year-over-year growth 2023-2028 (%)
- Exhibits40: Chart on Aeroponics - Market size and forecast 2023-2028 ($ million)
- Exhibits41: Data Table on Aeroponics - Market size and forecast 2023-2028 ($ million)
- Exhibits42: Chart on Aeroponics - Year-over-year growth 2023-2028 (%)
- Exhibits43: Data Table on Aeroponics - Year-over-year growth 2023-2028 (%)
- Exhibits44: Chart on Aquaponics - Market size and forecast 2023-2028 ($ million)
- Exhibits45: Data Table on Aquaponics - Market size and forecast 2023-2028 ($ million)
- Exhibits46: Chart on Aquaponics - Year-over-year growth 2023-2028 (%)
- Exhibits47: Data Table on Aquaponics - Year-over-year growth 2023-2028 (%)
- Exhibits48: Market opportunity by Application ($ million)
- Exhibits49: Data Table on Market opportunity by Application ($ million)
- Exhibits50: Chart on Type - Market share 2023-2028 (%)
- Exhibits51: Data Table on Type - Market share 2023-2028 (%)
- Exhibits52: Chart on Comparison by Type
- Exhibits53: Data Table on Comparison by Type
- Exhibits54: Chart on Shipping container - Market size and forecast 2023-2028 ($ million)
- Exhibits55: Data Table on Shipping container - Market size and forecast 2023-2028 ($ million)
- Exhibits56: Chart on Shipping container - Year-over-year growth 2023-2028 (%)
- Exhibits57: Data Table on Shipping container - Year-over-year growth 2023-2028 (%)
- Exhibits58: Chart on Building-based - Market size and forecast 2023-2028 ($ million)
- Exhibits59: Data Table on Building-based - Market size and forecast 2023-2028 ($ million)
- Exhibits60: Chart on Building-based - Year-over-year growth 2023-2028 (%)
- Exhibits61: Data Table on Building-based - Year-over-year growth 2023-2028 (%)
- Exhibits62: Market opportunity by Type ($ million)
- Exhibits63: Data Table on Market opportunity by Type ($ million)
- Exhibits64: Analysis of price sensitivity, lifecycle, customer purchase basket, adoption rates, and purchase criteria
- Exhibits65: Chart on Market share By Geographical Landscape 2023-2028 (%)
- Exhibits66: Data Table on Market share By Geographical Landscape 2023-2028 (%)
- Exhibits67: Chart on Geographic comparison
- Exhibits68: Data Table on Geographic comparison
- Exhibits69: Chart on Europe - Market size and forecast 2023-2028 ($ million)
- Exhibits70: Data Table on Europe - Market size and forecast 2023-2028 ($ million)
- Exhibits71: Chart on Europe - Year-over-year growth 2023-2028 (%)
- Exhibits72: Data Table on Europe - Year-over-year growth 2023-2028 (%)
- Exhibits73: Chart on APAC - Market size and forecast 2023-2028 ($ million)
- Exhibits74: Data Table on APAC - Market size and forecast 2023-2028 ($ million)
- Exhibits75: Chart on APAC - Year-over-year growth 2023-2028 (%)
- Exhibits76: Data Table on APAC - Year-over-year growth 2023-2028 (%)
- Exhibits77: Chart on North America - Market size and forecast 2023-2028 ($ million)
- Exhibits78: Data Table on North America - Market size and forecast 2023-2028 ($ million)
- Exhibits79: Chart on North America - Year-over-year growth 2023-2028 (%)
- Exhibits80: Data Table on North America - Year-over-year growth 2023-2028 (%)
- Exhibits81: Chart on South America - Market size and forecast 2023-2028 ($ million)
- Exhibits82: Data Table on South America - Market size and forecast 2023-2028 ($ million)
- Exhibits83: Chart on South America - Year-over-year growth 2023-2028 (%)
- Exhibits84: Data Table on South America - Year-over-year growth 2023-2028 (%)
- Exhibits85: Chart on Middle East and Africa - Market size and forecast 2023-2028 ($ million)
- Exhibits86: Data Table on Middle East and Africa - Market size and forecast 2023-2028 ($ million)
- Exhibits87: Chart on Middle East and Africa - Year-over-year growth 2023-2028 (%)
- Exhibits88: Data Table on Middle East and Africa - Year-over-year growth 2023-2028 (%)
- Exhibits89: Chart on US - Market size and forecast 2023-2028 ($ million)
- Exhibits90: Data Table on US - Market size and forecast 2023-2028 ($ million)
- Exhibits91: Chart on US - Year-over-year growth 2023-2028 (%)
- Exhibits92: Data Table on US - Year-over-year growth 2023-2028 (%)
- Exhibits93: Chart on The Netherlands - Market size and forecast 2023-2028 ($ million)
- Exhibits94: Data Table on The Netherlands - Market size and forecast 2023-2028 ($ million)
- Exhibits95: Chart on The Netherlands - Year-over-year growth 2023-2028 (%)
- Exhibits96: Data Table on The Netherlands - Year-over-year growth 2023-2028 (%)
- Exhibits97: Chart on Japan - Market size and forecast 2023-2028 ($ million)
- Exhibits98: Data Table on Japan - Market size and forecast 2023-2028 ($ million)
- Exhibits99: Chart on Japan - Year-over-year growth 2023-2028 (%)
- Exhibits100: Data Table on Japan - Year-over-year growth 2023-2028 (%)
- Exhibits101: Chart on China - Market size and forecast 2023-2028 ($ million)
- Exhibits102: Data Table on China - Market size and forecast 2023-2028 ($ million)
- Exhibits103: Chart on China - Year-over-year growth 2023-2028 (%)
- Exhibits104: Data Table on China - Year-over-year growth 2023-2028 (%)
- Exhibits105: Chart on Canada - Market size and forecast 2023-2028 ($ million)
- Exhibits106: Data Table on Canada - Market size and forecast 2023-2028 ($ million)
- Exhibits107: Chart on Canada - Year-over-year growth 2023-2028 (%)
- Exhibits108: Data Table on Canada - Year-over-year growth 2023-2028 (%)
- Exhibits109: Market opportunity By Geographical Landscape ($ million)
- Exhibits110: Data Tables on Market opportunity By Geographical Landscape ($ million)
- Exhibits111: Impact of drivers and challenges in 2023 and 2028
- Exhibits112: Overview on criticality of inputs and factors of differentiation
- Exhibits113: Overview on factors of disruption
- Exhibits114: Impact of key risks on business
- Exhibits115: Companies covered
- Exhibits116: Matrix on companies position and classification
- Exhibits117: 4D Bios Inc. - Overview
- Exhibits118: 4D Bios Inc. - Product / Service
- Exhibits119: 4D Bios Inc. - Key offerings
- Exhibits120: AeroFarms LLC - Overview
- Exhibits121: AeroFarms LLC - Product / Service
- Exhibits122: AeroFarms LLC - Key offerings
- Exhibits123: Bowery Farming Inc. - Overview
- Exhibits124: Bowery Farming Inc. - Product / Service
- Exhibits125: Bowery Farming Inc. - Key offerings
- Exhibits126: Eden Green Technology - Overview
- Exhibits127: Eden Green Technology - Product / Service
- Exhibits128: Eden Green Technology - Key offerings
- Exhibits129: Freight Farms Inc. - Overview
- Exhibits130: Freight Farms Inc. - Product / Service
- Exhibits131: Freight Farms Inc. - Key offerings
- Exhibits132: Gronska Stadsodling - Overview
- Exhibits133: Gronska Stadsodling - Product / Service
- Exhibits134: Gronska Stadsodling - Key offerings
- Exhibits135: Grow Pod Solutions - Overview
- Exhibits136: Grow Pod Solutions - Product / Service
- Exhibits137: Grow Pod Solutions - Key offerings
- Exhibits138: GrowUp Farms Ltd. - Overview
- Exhibits139: GrowUp Farms Ltd. - Product / Service
- Exhibits140: GrowUp Farms Ltd. - Key news
- Exhibits141: GrowUp Farms Ltd. - Key offerings
- Exhibits142: Hort Americas LLC - Overview
- Exhibits143: Hort Americas LLC - Product / Service
- Exhibits144: Hort Americas LLC - Key offerings
- Exhibits145: IGS Ltd. - Overview
- Exhibits146: IGS Ltd. - Product / Service
- Exhibits147: IGS Ltd. - Key offerings
- Exhibits148: Koninklijke Philips N.V. - Overview
- Exhibits149: Koninklijke Philips N.V. - Business segments
- Exhibits150: Koninklijke Philips N.V. - Key news
- Exhibits151: Koninklijke Philips N.V. - Key offerings
- Exhibits152: Koninklijke Philips N.V. - Segment focus
- Exhibits153: Plenty Unlimited Inc. - Overview
- Exhibits154: Plenty Unlimited Inc. - Product / Service
- Exhibits155: Plenty Unlimited Inc. - Key offerings
- Exhibits156: SANANBIO - Overview
- Exhibits157: SANANBIO - Product / Service
- Exhibits158: SANANBIO - Key offerings
- Exhibits159: SPREAD Co. Ltd. - Overview
- Exhibits160: SPREAD Co. Ltd. - Product / Service
- Exhibits161: SPREAD Co. Ltd. - Key offerings
- Exhibits162: Vertical Farm Systems Pty Ltd - Overview
- Exhibits163: Vertical Farm Systems Pty Ltd - Product / Service
- Exhibits164: Vertical Farm Systems Pty Ltd - Key offerings
- Exhibits165: Inclusions checklist
- Exhibits166: Exclusions checklist
- Exhibits167: Currency conversion rates for US$
- Exhibits168: Research methodology
- Exhibits169: Information sources
- Exhibits170: Data validation
- Exhibits171: Validation techniques employed for market sizing
- Exhibits172: Data synthesis
- Exhibits173: 360 degree market analysis
- Exhibits174: List of abbreviations
The vertical farming technologies market is forecasted to grow by USD 17810.4 mn during 2023-2028, accelerating at a CAGR of 31.33% during the forecast period. The report on the vertical farming technologies market provides a holistic analysis, market size and forecast, trends, growth drivers, and challenges, as well as vendor analysis covering around 25 vendors.
The report offers an up-to-date analysis regarding the current market scenario, the latest trends and drivers, and the overall market environment. The market is driven by growing focus on reducing labor costs for farming, growth in investments and funding, and growing need to meet rising demand for food products.
Technavio's vertical farming technologies market is segmented as below:
| Market Scope | |
|---|---|
| Base Year | 2024 |
| End Year | 2028 |
| Series Year | 2024-2028 |
| Growth Momentum | Accelerate |
| YOY 2024 | 25.12% |
| CAGR | 31.33% |
| Incremental Value | $17810.4 mn |
By Application
- Hydroponics
- Aeroponics
- Aquaponics
By Type
- Shipping container
- Building-based
By Geographical Landscape
- Europe
- APAC
- North America
- South America
- Middle East and Africa
This study identifies the growing inclination toward technologies that offer water saving and energy saving benefits as one of the prime reasons driving the vertical farming technologies market growth during the next few years. Also, increasing demand for vertical farming technologies with automated systems and rising adoption of vertical farming technologies with patented systems will lead to sizable demand in the market.
The report on the vertical farming technologies market covers the following areas:
- Vertical farming technologies market sizing
- Vertical farming technologies market forecast
- Vertical farming technologies market industry analysis
The robust vendor analysis is designed to help clients improve their market position, and in line with this, this report provides a detailed analysis of several leading vertical farming technologies market vendors that include 4D Bios Inc., AeroFarms LLC, Bowery Farming Inc., Eden Green Technology, Freight Farms Inc., Gronska Stadsodling, Grow Pod Solutions, GrowUp Farms Ltd., Hort Americas LLC, IGS Ltd., Indoor Urban Farming GmbH, Koninklijke Philips N.V., Plenty Unlimited Inc., SANANBIO, Sky Greens, SPREAD Co. Ltd., Swegreens, Urban Crop Solutions, Vertical Farm Systems Pty Ltd, and Vertical Future Ltd.. Also, the vertical farming technologies market analysis report includes information on upcoming trends and challenges that will influence market growth. This is to help companies strategize and leverage all forthcoming growth opportunities.
The study was conducted using an objective combination of primary and secondary information including inputs from key participants in the industry. The report contains a comprehensive market and vendor landscape in addition to an analysis of the key vendors.
The publisher presents a detailed picture of the market by the way of study, synthesis, and summation of data from multiple sources by an analysis of key parameters such as profit, pricing, competition, and promotions. It presents various market facets by identifying the key industry influencers. The data presented is comprehensive, reliable, and a result of extensive research - both primary and secondary. The market research reports provide a complete competitive landscape and an in-depth vendor selection methodology and analysis using qualitative and quantitative research to forecast the accurate market growth.
Table of Contents
1 Executive Summary
- 1.1 Market overview
- Executive Summary - Chart on Market Overview
- Executive Summary - Data Table on Market Overview
- Executive Summary - Chart on Global Market Characteristics
- Executive Summary - Chart on Market By Geographical Landscape
- Executive Summary - Chart on Market Segmentation by Application
- Executive Summary - Chart on Market Segmentation by Type
- Executive Summary - Chart on Incremental Growth
- Executive Summary - Data Table on Incremental Growth
- Executive Summary - Chart on Company Market Positioning
2 Market Landscape
- 2.1 Market ecosystem
- Parent Market
- Data Table on - Parent Market
- 2.2 Market characteristics
- Market characteristics analysis
- 2.3 Value chain analysis
- Value Chain Analysis
3 Market Sizing
- 3.1 Market definition
- Offerings of companies included in the market definition
- 3.2 Market segment analysis
- Market segments
- 3.3 Market size 2023
- 3.4 Market outlook: Forecast for 2023-2028
- Chart on Global - Market size and forecast 2023-2028 ($ million)
- Data Table on Global - Market size and forecast 2023-2028 ($ million)
- Chart on Global Market: Year-over-year growth 2023-2028 (%)
- Data Table on Global Market: Year-over-year growth 2023-2028 (%)
4 Historic Market Size
- 4.1 Global Vertical Farming Technologies Market 2018 - 2022
- Historic Market Size - Data Table on Global Vertical Farming Technologies Market 2018 - 2022 ($ million)
- 4.2 Application segment analysis 2018 - 2022
- Historic Market Size - Application Segment 2018 - 2022 ($ million)
- 4.3 Type segment analysis 2018 - 2022
- Historic Market Size - Type Segment 2018 - 2022 ($ million)
- 4.4 Geography segment analysis 2018 - 2022
- Historic Market Size - Geography Segment 2018 - 2022 ($ million)
- 4.5 Country segment analysis 2018 - 2022
- Historic Market Size - Country Segment 2018 - 2022 ($ million)
5 Five Forces Analysis
- 5.1 Five forces summary
- Five forces analysis - Comparison between 2023 and 2028
- 5.2 Bargaining power of buyers
- Bargaining power of buyers - Impact of key factors 2023 and 2028
- 5.3 Bargaining power of suppliers
- Bargaining power of suppliers - Impact of key factors in 2023 and 2028
- 5.4 Threat of new entrants
- Threat of new entrants - Impact of key factors in 2023 and 2028
- 5.5 Threat of substitutes
- Threat of substitutes - Impact of key factors in 2023 and 2028
- 5.6 Threat of rivalry
- Threat of rivalry - Impact of key factors in 2023 and 2028
- 5.7 Market condition
- Chart on Market condition - Five forces 2023 and 2028
6 Market Segmentation by Application
- 6.1 Market segments
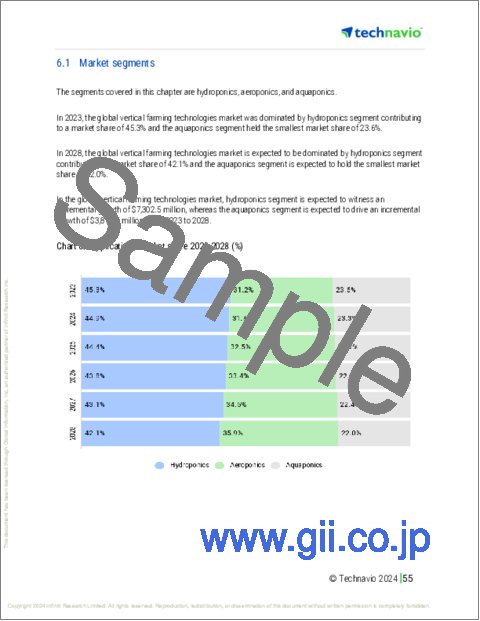
- Chart on Application - Market share 2023-2028 (%)
- Data Table on Application - Market share 2023-2028 (%)
- 6.2 Comparison by Application
- Chart on Comparison by Application
- Data Table on Comparison by Application
- 6.3 Hydroponics - Market size and forecast 2023-2028
- Chart on Hydroponics - Market size and forecast 2023-2028 ($ million)
- Data Table on Hydroponics - Market size and forecast 2023-2028 ($ million)
- Chart on Hydroponics - Year-over-year growth 2023-2028 (%)
- Data Table on Hydroponics - Year-over-year growth 2023-2028 (%)
- 6.4 Aeroponics - Market size and forecast 2023-2028
- Chart on Aeroponics - Market size and forecast 2023-2028 ($ million)
- Data Table on Aeroponics - Market size and forecast 2023-2028 ($ million)
- Chart on Aeroponics - Year-over-year growth 2023-2028 (%)
- Data Table on Aeroponics - Year-over-year growth 2023-2028 (%)
- 6.5 Aquaponics - Market size and forecast 2023-2028
- Chart on Aquaponics - Market size and forecast 2023-2028 ($ million)
- Data Table on Aquaponics - Market size and forecast 2023-2028 ($ million)
- Chart on Aquaponics - Year-over-year growth 2023-2028 (%)
- Data Table on Aquaponics - Year-over-year growth 2023-2028 (%)
- 6.6 Market opportunity by Application
- Market opportunity by Application ($ million)
- Data Table on Market opportunity by Application ($ million)
7 Market Segmentation by Type
- 7.1 Market segments
- Chart on Type - Market share 2023-2028 (%)
- Data Table on Type - Market share 2023-2028 (%)
- 7.2 Comparison by Type
- Chart on Comparison by Type
- Data Table on Comparison by Type
- 7.3 Shipping container - Market size and forecast 2023-2028
- Chart on Shipping container - Market size and forecast 2023-2028 ($ million)
- Data Table on Shipping container - Market size and forecast 2023-2028 ($ million)
- Chart on Shipping container - Year-over-year growth 2023-2028 (%)
- Data Table on Shipping container - Year-over-year growth 2023-2028 (%)
- 7.4 Building-based - Market size and forecast 2023-2028
- Chart on Building-based - Market size and forecast 2023-2028 ($ million)
- Data Table on Building-based - Market size and forecast 2023-2028 ($ million)
- Chart on Building-based - Year-over-year growth 2023-2028 (%)
- Data Table on Building-based - Year-over-year growth 2023-2028 (%)
- 7.5 Market opportunity by Type
- Market opportunity by Type ($ million)
- Data Table on Market opportunity by Type ($ million)
8 Customer Landscape
- 8.1 Customer landscape overview
- Analysis of price sensitivity, lifecycle, customer purchase basket, adoption rates, and purchase criteria
9 Geographic Landscape
- 9.1 Geographic segmentation
- Chart on Market share By Geographical Landscape 2023-2028 (%)
- Data Table on Market share By Geographical Landscape 2023-2028 (%)
- 9.2 Geographic comparison
- Chart on Geographic comparison
- Data Table on Geographic comparison
- 9.3 Europe - Market size and forecast 2023-2028
- Chart on Europe - Market size and forecast 2023-2028 ($ million)
- Data Table on Europe - Market size and forecast 2023-2028 ($ million)
- Chart on Europe - Year-over-year growth 2023-2028 (%)
- Data Table on Europe - Year-over-year growth 2023-2028 (%)
- 9.4 APAC - Market size and forecast 2023-2028
- Chart on APAC - Market size and forecast 2023-2028 ($ million)
- Data Table on APAC - Market size and forecast 2023-2028 ($ million)
- Chart on APAC - Year-over-year growth 2023-2028 (%)
- Data Table on APAC - Year-over-year growth 2023-2028 (%)
- 9.5 North America - Market size and forecast 2023-2028
- Chart on North America - Market size and forecast 2023-2028 ($ million)
- Data Table on North America - Market size and forecast 2023-2028 ($ million)
- Chart on North America - Year-over-year growth 2023-2028 (%)
- Data Table on North America - Year-over-year growth 2023-2028 (%)
- 9.6 South America - Market size and forecast 2023-2028
- Chart on South America - Market size and forecast 2023-2028 ($ million)
- Data Table on South America - Market size and forecast 2023-2028 ($ million)
- Chart on South America - Year-over-year growth 2023-2028 (%)
- Data Table on South America - Year-over-year growth 2023-2028 (%)
- 9.7 Middle East and Africa - Market size and forecast 2023-2028
- Chart on Middle East and Africa - Market size and forecast 2023-2028 ($ million)
- Data Table on Middle East and Africa - Market size and forecast 2023-2028 ($ million)
- Chart on Middle East and Africa - Year-over-year growth 2023-2028 (%)
- Data Table on Middle East and Africa - Year-over-year growth 2023-2028 (%)
- 9.8 US - Market size and forecast 2023-2028
- Chart on US - Market size and forecast 2023-2028 ($ million)
- Data Table on US - Market size and forecast 2023-2028 ($ million)
- Chart on US - Year-over-year growth 2023-2028 (%)
- Data Table on US - Year-over-year growth 2023-2028 (%)
- 9.9 The Netherlands - Market size and forecast 2023-2028
- Chart on The Netherlands - Market size and forecast 2023-2028 ($ million)
- Data Table on The Netherlands - Market size and forecast 2023-2028 ($ million)
- Chart on The Netherlands - Year-over-year growth 2023-2028 (%)
- Data Table on The Netherlands - Year-over-year growth 2023-2028 (%)
- 9.10 Japan - Market size and forecast 2023-2028
- Chart on Japan - Market size and forecast 2023-2028 ($ million)
- Data Table on Japan - Market size and forecast 2023-2028 ($ million)
- Chart on Japan - Year-over-year growth 2023-2028 (%)
- Data Table on Japan - Year-over-year growth 2023-2028 (%)
- 9.11 China - Market size and forecast 2023-2028
- Chart on China - Market size and forecast 2023-2028 ($ million)
- Data Table on China - Market size and forecast 2023-2028 ($ million)
- Chart on China - Year-over-year growth 2023-2028 (%)
- Data Table on China - Year-over-year growth 2023-2028 (%)
- 9.12 Canada - Market size and forecast 2023-2028
- Chart on Canada - Market size and forecast 2023-2028 ($ million)
- Data Table on Canada - Market size and forecast 2023-2028 ($ million)
- Chart on Canada - Year-over-year growth 2023-2028 (%)
- Data Table on Canada - Year-over-year growth 2023-2028 (%)
- 9.13 Market opportunity By Geographical Landscape
- Market opportunity By Geographical Landscape ($ million)
- Data Tables on Market opportunity By Geographical Landscape ($ million)
10 Drivers, Challenges, and Opportunity/Restraints
- 10.1 Market drivers
- 10.2 Market challenges
- 10.3 Impact of drivers and challenges
- Impact of drivers and challenges in 2023 and 2028
- 10.4 Market opportunities/restraints
11 Competitive Landscape
- 11.1 Overview
- 11.2 Competitive Landscape
- Overview on criticality of inputs and factors of differentiation
- 11.3 Landscape disruption
- Overview on factors of disruption
- 11.4 Industry risks
- Impact of key risks on business
12 Competitive Analysis
- 12.1 Companies profiled
- Companies covered
- 12.2 Market positioning of companies
- Matrix on companies position and classification
- 4D Bios Inc.
- 4D Bios Inc. - Overview
- 4D Bios Inc. - Product / Service
- 4D Bios Inc. - Key offerings
- 12.4 AeroFarms LLC
- AeroFarms LLC - Overview
- AeroFarms LLC - Product / Service
- AeroFarms LLC - Key offerings
- 12.5 Bowery Farming Inc.
- Bowery Farming Inc. - Overview
- Bowery Farming Inc. - Product / Service
- Bowery Farming Inc. - Key offerings
- 12.6 Eden Green Technology
- Eden Green Technology - Overview
- Eden Green Technology - Product / Service
- Eden Green Technology - Key offerings
- 12.7 Freight Farms Inc.
- Freight Farms Inc. - Overview
- Freight Farms Inc. - Product / Service
- Freight Farms Inc. - Key offerings
- 12.8 Gronska Stadsodling
- Gronska Stadsodling - Overview
- Gronska Stadsodling - Product / Service
- Gronska Stadsodling - Key offerings
- 12.9 Grow Pod Solutions
- Grow Pod Solutions - Overview
- Grow Pod Solutions - Product / Service
- Grow Pod Solutions - Key offerings
- 12.10 GrowUp Farms Ltd.
- GrowUp Farms Ltd. - Overview
- GrowUp Farms Ltd. - Product / Service
- GrowUp Farms Ltd. - Key news
- GrowUp Farms Ltd. - Key offerings
- 12.11 Hort Americas LLC
- Hort Americas LLC - Overview
- Hort Americas LLC - Product / Service
- Hort Americas LLC - Key offerings
- 12.12 IGS Ltd.
- IGS Ltd. - Overview
- IGS Ltd. - Product / Service
- IGS Ltd. - Key offerings
- 12.13 Koninklijke Philips N.V.
- Koninklijke Philips N.V. - Overview
- Koninklijke Philips N.V. - Business segments
- Koninklijke Philips N.V. - Key news
- Koninklijke Philips N.V. - Key offerings
- Koninklijke Philips N.V. - Segment focus
- 12.14 Plenty Unlimited Inc.
- Plenty Unlimited Inc. - Overview
- Plenty Unlimited Inc. - Product / Service
- Plenty Unlimited Inc. - Key offerings
- 12.15 SANANBIO
- SANANBIO - Overview
- SANANBIO - Product / Service
- SANANBIO - Key offerings
- 12.16 SPREAD Co. Ltd.
- SPREAD Co. Ltd. - Overview
- SPREAD Co. Ltd. - Product / Service
- SPREAD Co. Ltd. - Key offerings
- 12.17 Vertical Farm Systems Pty Ltd
- Vertical Farm Systems Pty Ltd - Overview
- Vertical Farm Systems Pty Ltd - Product / Service
- Vertical Farm Systems Pty Ltd - Key offerings
13 Appendix
- 13.1 Scope of the report
- 13.2 Inclusions and exclusions checklist
- Inclusions checklist
- Exclusions checklist
- 13.3 Currency conversion rates for US$
- Currency conversion rates for US$
- 13.4 Research methodology
- Research methodology
- 13.5 Data procurement
- Information sources
- 13.6 Data validation
- Data validation
- 13.7 Validation techniques employed for market sizing
- Validation techniques employed for market sizing
- 13.8 Data synthesis
- Data synthesis
- 360 degree market analysis
- 360 degree market analysis
- 13.10 List of abbreviations
- List of abbreviations
