|
|
市場調査レポート
商品コード
1557543
オメガ3製品の世界市場 2024年~2028年Global Omega 3 Products Market 2024-2028 |
||||||

|
|||||||
カスタマイズ可能
|
|||||||

| オメガ3製品の世界市場 2024年~2028年 |
|
出版日: 2024年08月15日
発行: TechNavio
ページ情報: 英文 173 Pages
納期: 即納可能
|

全表示
- 概要
- 図表
- 目次
オメガ3製品市場は2023年~2028年年に255億2,020万米ドル、予測期間中のCAGRは8.09%で成長すると予測されています。
当レポートでは、オメガ3製品市場の全体的な分析、市場規模・予測、動向、成長促進要因、課題、約25のベンダーを網羅したベンダー分析などを掲載しています。
現在の市場シナリオ、最新動向と促進要因、市場環境全体に関する最新分析を提供しています。市場は、オメガ3脂肪酸に関連する健康上の利点に対する意識の高まり、天然製品やオーガニック製品に対する消費者の関心の高まり、飼料用オメガ3の人気の高まりによって牽引されています。
| 市場範囲 | |
|---|---|
| 基準年 | 2024年 |
| 終了年 | 2028年 |
| 予測期間 | 2024年~2028年 |
| 成長モメンタム | 加速 |
| 前年比2024年 | 7.32% |
| CAGR | 8.09% |
| 増分額 | 255億2,020万米ドル |
本調査では、今後数年間のオメガ3製品市場の成長を促進する主な理由の一つとして、予防ヘルスケアと個別化栄養への注目の高まりを挙げています。また、魚油の抽出と精製における技術的進歩や、植物性・菜食主義者の需要の増加は、市場の大きな需要につながります。
目次
第1章 エグゼクティブサマリー
- 市場概要
第2章 市場情勢
- 市場エコシステム
- 市場の特徴
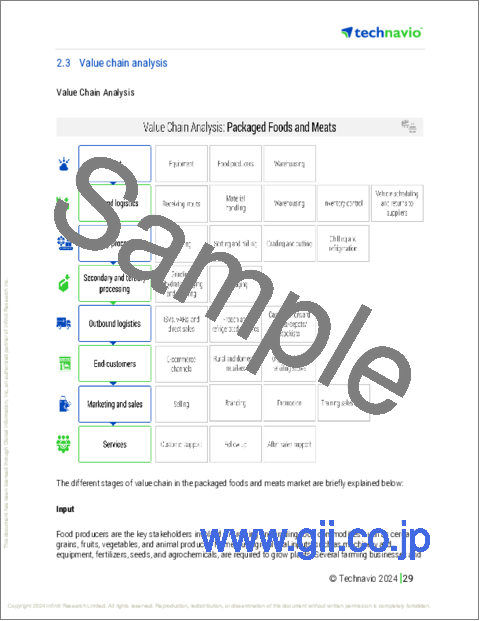
- バリューチェーン分析
第3章 市場規模の評価
- 市場の定義
- 市場セグメント分析
- 市場規模 2023年
- 市場の見通し 2023年~2028年
第4章 市場規模実績
- オメガ3製品の世界市場 2018年~2022年
- 製品セグメント分析 2018年~2022年
- タイプセグメント分析 2018年~2022年
- 地域別セグメント分析 2018年~2022年
- 国別セグメント分析 2018年~2022年
第5章 ファイブフォース分析
- ファイブフォースの要約
- 買い手の交渉力
- 供給企業の交渉力
- 新規参入業者の脅威
- 代替品の脅威
- 競争の脅威
- 市況
第6章 市場セグメンテーション:製品別
- 市場セグメンテーション
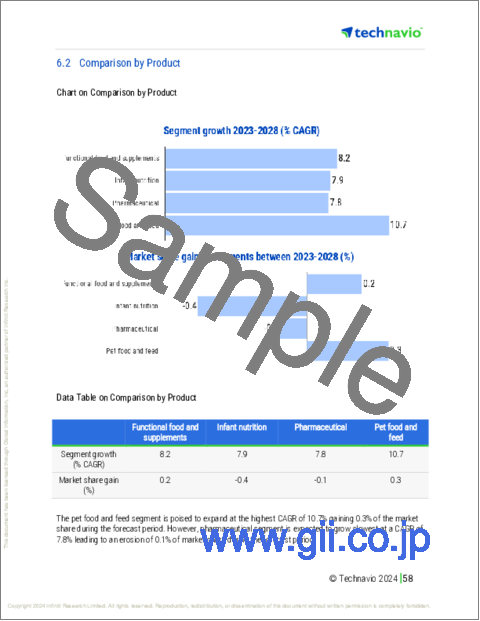
- 比較:製品別
- 機能性食品とサプリメント:市場規模と予測 2023年~2028年
- 乳児の栄養:市場規模と予測 2023年~2028年
- 製薬:市場規模と予測 2023年~2028年
- ペットフードと飼料:市場規模と予測 2023年~2028年
- 市場機会:製品別
第7章 市場セグメンテーション:タイプ別
- 市場セグメンテーション
- 比較:タイプ別
- DHA:市場規模と予測 2023年~2028年
- EPA:市場規模と予測 2023年~2028年
- アラバマ:市場規模と予測 2023年~2028年
- 市場機会:タイプ別
第8章 顧客情勢
- 顧客情勢の概要
第9章 地域別情勢
- 地域別セグメンテーション
- 地域別比較
- 北米:市場規模と予測 2023年~2028年
- アジア太平洋:市場規模と予測 2023年~2028年
- 欧州:市場規模と予測 2023年~2028年
- 南米:市場規模と予測 2023年~2028年
- 中東・アフリカ:市場規模と予測 2023年~2028年
- 米国:市場規模と予測 2023年~2028年
- 中国:市場規模と予測 2023年~2028年
- カナダ:市場規模と予測 2023年~2028年
- ドイツ:市場規模と予測 2023年~2028年
- 日本:市場規模と予測 2023年~2028年
- 市場機会:地域情勢別
第10章 促進要因・課題・機会・抑制要因
- 市場促進要因
- 市場の課題
- 促進要因と課題の影響
- 市場の機会・抑制要因
第11章 競合情勢
- 概要
- 競合情勢
- 混乱の状況
- 業界のリスク
第12章 競合分析
- 企業プロファイル
- 企業の市場ポジショニング
- Aker BioMarine ASA
- Archer Daniels Midland Co.
- BASF SE
- Cargill Inc.
- China Mengniu Dairy Co. Ltd.
- Cooke Aquaculture Inc.
- Croda International Plc
- GC Rieber AS
- Koninklijke DSM NV
- Lonza Group Ltd.
- Nestle SA
- Orkla ASA
- Pelagia AS
- Reckitt Benckiser Group Plc
- Unilever PLC
第13章 付録
Exhibits:
- Exhibits1: Executive Summary - Chart on Market Overview
- Exhibits2: Executive Summary - Data Table on Market Overview
- Exhibits3: Executive Summary - Chart on Global Market Characteristics
- Exhibits4: Executive Summary - Chart on Market By Geographical Landscape
- Exhibits5: Executive Summary - Chart on Market Segmentation by Product
- Exhibits6: Executive Summary - Chart on Market Segmentation by Type
- Exhibits7: Executive Summary - Chart on Incremental Growth
- Exhibits8: Executive Summary - Data Table on Incremental Growth
- Exhibits9: Executive Summary - Chart on Company Market Positioning
- Exhibits10: Parent Market
- Exhibits11: Data Table on - Parent Market
- Exhibits12: Market characteristics analysis
- Exhibits13: Value Chain Analysis
- Exhibits14: Offerings of companies included in the market definition
- Exhibits15: Market segments
- Exhibits16: Chart on Global - Market size and forecast 2023-2028 ($ million)
- Exhibits17: Data Table on Global - Market size and forecast 2023-2028 ($ million)
- Exhibits18: Chart on Global Market: Year-over-year growth 2023-2028 (%)
- Exhibits19: Data Table on Global Market: Year-over-year growth 2023-2028 (%)
- Exhibits20: Historic Market Size - Data Table on Global Omega 3 Products Market 2018 - 2022 ($ million)
- Exhibits21: Historic Market Size - Product Segment 2018 - 2022 ($ million)
- Exhibits22: Historic Market Size - Type Segment 2018 - 2022 ($ million)
- Exhibits23: Historic Market Size - Geography Segment 2018 - 2022 ($ million)
- Exhibits24: Historic Market Size - Country Segment 2018 - 2022 ($ million)
- Exhibits25: Five forces analysis - Comparison between 2023 and 2028
- Exhibits26: Bargaining power of buyers - Impact of key factors 2023 and 2028
- Exhibits27: Bargaining power of suppliers - Impact of key factors in 2023 and 2028
- Exhibits28: Threat of new entrants - Impact of key factors in 2023 and 2028
- Exhibits29: Threat of substitutes - Impact of key factors in 2023 and 2028
- Exhibits30: Threat of rivalry - Impact of key factors in 2023 and 2028
- Exhibits31: Chart on Market condition - Five forces 2023 and 2028
- Exhibits32: Chart on Product - Market share 2023-2028 (%)
- Exhibits33: Data Table on Product - Market share 2023-2028 (%)
- Exhibits34: Chart on Comparison by Product
- Exhibits35: Data Table on Comparison by Product
- Exhibits36: Chart on Functional food and supplements - Market size and forecast 2023-2028 ($ million)
- Exhibits37: Data Table on Functional food and supplements - Market size and forecast 2023-2028 ($ million)
- Exhibits38: Chart on Functional food and supplements - Year-over-year growth 2023-2028 (%)
- Exhibits39: Data Table on Functional food and supplements - Year-over-year growth 2023-2028 (%)
- Exhibits40: Chart on Infant nutrition - Market size and forecast 2023-2028 ($ million)
- Exhibits41: Data Table on Infant nutrition - Market size and forecast 2023-2028 ($ million)
- Exhibits42: Chart on Infant nutrition - Year-over-year growth 2023-2028 (%)
- Exhibits43: Data Table on Infant nutrition - Year-over-year growth 2023-2028 (%)
- Exhibits44: Chart on Pharmaceutical - Market size and forecast 2023-2028 ($ million)
- Exhibits45: Data Table on Pharmaceutical - Market size and forecast 2023-2028 ($ million)
- Exhibits46: Chart on Pharmaceutical - Year-over-year growth 2023-2028 (%)
- Exhibits47: Data Table on Pharmaceutical - Year-over-year growth 2023-2028 (%)
- Exhibits48: Chart on Pet food and feed - Market size and forecast 2023-2028 ($ million)
- Exhibits49: Data Table on Pet food and feed - Market size and forecast 2023-2028 ($ million)
- Exhibits50: Chart on Pet food and feed - Year-over-year growth 2023-2028 (%)
- Exhibits51: Data Table on Pet food and feed - Year-over-year growth 2023-2028 (%)
- Exhibits52: Market opportunity by Product ($ million)
- Exhibits53: Data Table on Market opportunity by Product ($ million)
- Exhibits54: Chart on Type - Market share 2023-2028 (%)
- Exhibits55: Data Table on Type - Market share 2023-2028 (%)
- Exhibits56: Chart on Comparison by Type
- Exhibits57: Data Table on Comparison by Type
- Exhibits58: Chart on DHA - Market size and forecast 2023-2028 ($ million)
- Exhibits59: Data Table on DHA - Market size and forecast 2023-2028 ($ million)
- Exhibits60: Chart on DHA - Year-over-year growth 2023-2028 (%)
- Exhibits61: Data Table on DHA - Year-over-year growth 2023-2028 (%)
- Exhibits62: Chart on EPA - Market size and forecast 2023-2028 ($ million)
- Exhibits63: Data Table on EPA - Market size and forecast 2023-2028 ($ million)
- Exhibits64: Chart on EPA - Year-over-year growth 2023-2028 (%)
- Exhibits65: Data Table on EPA - Year-over-year growth 2023-2028 (%)
- Exhibits66: Chart on ALA - Market size and forecast 2023-2028 ($ million)
- Exhibits67: Data Table on ALA - Market size and forecast 2023-2028 ($ million)
- Exhibits68: Chart on ALA - Year-over-year growth 2023-2028 (%)
- Exhibits69: Data Table on ALA - Year-over-year growth 2023-2028 (%)
- Exhibits70: Market opportunity by Type ($ million)
- Exhibits71: Data Table on Market opportunity by Type ($ million)
- Exhibits72: Analysis of price sensitivity, lifecycle, customer purchase basket, adoption rates, and purchase criteria
- Exhibits73: Chart on Market share By Geographical Landscape 2023-2028 (%)
- Exhibits74: Data Table on Market share By Geographical Landscape 2023-2028 (%)
- Exhibits75: Chart on Geographic comparison
- Exhibits76: Data Table on Geographic comparison
- Exhibits77: Chart on North America - Market size and forecast 2023-2028 ($ million)
- Exhibits78: Data Table on North America - Market size and forecast 2023-2028 ($ million)
- Exhibits79: Chart on North America - Year-over-year growth 2023-2028 (%)
- Exhibits80: Data Table on North America - Year-over-year growth 2023-2028 (%)
- Exhibits81: Chart on APAC - Market size and forecast 2023-2028 ($ million)
- Exhibits82: Data Table on APAC - Market size and forecast 2023-2028 ($ million)
- Exhibits83: Chart on APAC - Year-over-year growth 2023-2028 (%)
- Exhibits84: Data Table on APAC - Year-over-year growth 2023-2028 (%)
- Exhibits85: Chart on Europe - Market size and forecast 2023-2028 ($ million)
- Exhibits86: Data Table on Europe - Market size and forecast 2023-2028 ($ million)
- Exhibits87: Chart on Europe - Year-over-year growth 2023-2028 (%)
- Exhibits88: Data Table on Europe - Year-over-year growth 2023-2028 (%)
- Exhibits89: Chart on South America - Market size and forecast 2023-2028 ($ million)
- Exhibits90: Data Table on South America - Market size and forecast 2023-2028 ($ million)
- Exhibits91: Chart on South America - Year-over-year growth 2023-2028 (%)
- Exhibits92: Data Table on South America - Year-over-year growth 2023-2028 (%)
- Exhibits93: Chart on Middle East and Africa - Market size and forecast 2023-2028 ($ million)
- Exhibits94: Data Table on Middle East and Africa - Market size and forecast 2023-2028 ($ million)
- Exhibits95: Chart on Middle East and Africa - Year-over-year growth 2023-2028 (%)
- Exhibits96: Data Table on Middle East and Africa - Year-over-year growth 2023-2028 (%)
- Exhibits97: Chart on US - Market size and forecast 2023-2028 ($ million)
- Exhibits98: Data Table on US - Market size and forecast 2023-2028 ($ million)
- Exhibits99: Chart on US - Year-over-year growth 2023-2028 (%)
- Exhibits100: Data Table on US - Year-over-year growth 2023-2028 (%)
- Exhibits101: Chart on China - Market size and forecast 2023-2028 ($ million)
- Exhibits102: Data Table on China - Market size and forecast 2023-2028 ($ million)
- Exhibits103: Chart on China - Year-over-year growth 2023-2028 (%)
- Exhibits104: Data Table on China - Year-over-year growth 2023-2028 (%)
- Exhibits105: Chart on Canada - Market size and forecast 2023-2028 ($ million)
- Exhibits106: Data Table on Canada - Market size and forecast 2023-2028 ($ million)
- Exhibits107: Chart on Canada - Year-over-year growth 2023-2028 (%)
- Exhibits108: Data Table on Canada - Year-over-year growth 2023-2028 (%)
- Exhibits109: Chart on Germany - Market size and forecast 2023-2028 ($ million)
- Exhibits110: Data Table on Germany - Market size and forecast 2023-2028 ($ million)
- Exhibits111: Chart on Germany - Year-over-year growth 2023-2028 (%)
- Exhibits112: Data Table on Germany - Year-over-year growth 2023-2028 (%)
- Exhibits113: Chart on Japan - Market size and forecast 2023-2028 ($ million)
- Exhibits114: Data Table on Japan - Market size and forecast 2023-2028 ($ million)
- Exhibits115: Chart on Japan - Year-over-year growth 2023-2028 (%)
- Exhibits116: Data Table on Japan - Year-over-year growth 2023-2028 (%)
- Exhibits117: Market opportunity By Geographical Landscape ($ million)
- Exhibits118: Data Tables on Market opportunity By Geographical Landscape ($ million)
- Exhibits119: Impact of drivers and challenges in 2023 and 2028
- Exhibits120: Overview on criticality of inputs and factors of differentiation
- Exhibits121: Overview on factors of disruption
- Exhibits122: Impact of key risks on business
- Exhibits123: Companies covered
- Exhibits124: Matrix on companies position and classification
- Exhibits125: Aker BioMarine ASA - Overview
- Exhibits126: Aker BioMarine ASA - Business segments
- Exhibits127: Aker BioMarine ASA - Key offerings
- Exhibits128: Aker BioMarine ASA - Segment focus
- Exhibits129: Archer Daniels Midland Co. - Overview
- Exhibits130: Archer Daniels Midland Co. - Business segments
- Exhibits131: Archer Daniels Midland Co. - Key news
- Exhibits132: Archer Daniels Midland Co. - Key offerings
- Exhibits133: Archer Daniels Midland Co. - Segment focus
- Exhibits134: BASF SE - Overview
- Exhibits135: BASF SE - Business segments
- Exhibits136: BASF SE - Key news
- Exhibits137: BASF SE - Key offerings
- Exhibits138: BASF SE - Segment focus
- Exhibits139: Cargill Inc. - Overview
- Exhibits140: Cargill Inc. - Product / Service
- Exhibits141: Cargill Inc. - Key news
- Exhibits142: Cargill Inc. - Key offerings
- Exhibits143: China Mengniu Dairy Co. Ltd. - Overview
- Exhibits144: China Mengniu Dairy Co. Ltd. - Business segments
- Exhibits145: China Mengniu Dairy Co. Ltd. - Key offerings
- Exhibits146: China Mengniu Dairy Co. Ltd. - Segment focus
- Exhibits147: Cooke Aquaculture Inc. - Overview
- Exhibits148: Cooke Aquaculture Inc. - Product / Service
- Exhibits149: Cooke Aquaculture Inc. - Key offerings
- Exhibits150: Croda International Plc - Overview
- Exhibits151: Croda International Plc - Business segments
- Exhibits152: Croda International Plc - Key news
- Exhibits153: Croda International Plc - Key offerings
- Exhibits154: Croda International Plc - Segment focus
- Exhibits155: GC Rieber AS - Overview
- Exhibits156: GC Rieber AS - Product / Service
- Exhibits157: GC Rieber AS - Key offerings
- Exhibits158: Koninklijke DSM NV - Overview
- Exhibits159: Koninklijke DSM NV - Business segments
- Exhibits160: Koninklijke DSM NV - Key news
- Exhibits161: Koninklijke DSM NV - Key offerings
- Exhibits162: Koninklijke DSM NV - Segment focus
- Exhibits163: Lonza Group Ltd. - Overview
- Exhibits164: Lonza Group Ltd. - Business segments
- Exhibits165: Lonza Group Ltd. - Key news
- Exhibits166: Lonza Group Ltd. - Key offerings
- Exhibits167: Lonza Group Ltd. - Segment focus
- Exhibits168: Nestle SA - Overview
- Exhibits169: Nestle SA - Business segments
- Exhibits170: Nestle SA - Key news
- Exhibits171: Nestle SA - Key offerings
- Exhibits172: Nestle SA - Segment focus
- Exhibits173: Orkla ASA - Overview
- Exhibits174: Orkla ASA - Business segments
- Exhibits175: Orkla ASA - Key news
- Exhibits176: Orkla ASA - Key offerings
- Exhibits177: Orkla ASA - Segment focus
- Exhibits178: Pelagia AS - Overview
- Exhibits179: Pelagia AS - Product / Service
- Exhibits180: Pelagia AS - Key offerings
- Exhibits181: Reckitt Benckiser Group Plc - Overview
- Exhibits182: Reckitt Benckiser Group Plc - Business segments
- Exhibits183: Reckitt Benckiser Group Plc - Key news
- Exhibits184: Reckitt Benckiser Group Plc - Key offerings
- Exhibits185: Reckitt Benckiser Group Plc - Segment focus
- Exhibits186: Unilever PLC - Overview
- Exhibits187: Unilever PLC - Business segments
- Exhibits188: Unilever PLC - Key news
- Exhibits189: Unilever PLC - Key offerings
- Exhibits190: Unilever PLC - Segment focus
- Exhibits191: Inclusions checklist
- Exhibits192: Exclusions checklist
- Exhibits193: Currency conversion rates for US$
- Exhibits194: Research methodology
- Exhibits195: Information sources
- Exhibits196: Data validation
- Exhibits197: Validation techniques employed for market sizing
- Exhibits198: Data synthesis
- Exhibits199: 360 degree market analysis
- Exhibits200: List of abbreviations
The omega 3 products market is forecasted to grow by USD 25520.2 mn during 2023-2028, accelerating at a CAGR of 8.09% during the forecast period. The report on the omega 3 products market provides a holistic analysis, market size and forecast, trends, growth drivers, and challenges, as well as vendor analysis covering around 25 vendors.
The report offers an up-to-date analysis regarding the current market scenario, the latest trends and drivers, and the overall market environment. The market is driven by growing awareness of health benefits associated with omega 3 fatty acids, rising consumer interest in natural and organic products, and growing popularity of omega 3 for use in animal feed.
Technavio's omega 3 products market is segmented as below:
| Market Scope | |
|---|---|
| Base Year | 2024 |
| End Year | 2028 |
| Series Year | 2024-2028 |
| Growth Momentum | Accelerate |
| YOY 2024 | 7.32% |
| CAGR | 8.09% |
| Incremental Value | $25520.2 mn |
By Product
- Functional food and supplements
- Infant nutrition
- Pharmaceutical
- Pet food and feed
By Type
- DHA
- EPA
- ALA
By Geographical Landscape
- North America
- APAC
- Europe
- South America
- Middle East and Africa
This study identifies the increasing focus on preventive healthcare and personalized nutrition as one of the prime reasons driving the omega 3 products market growth during the next few years. Also, technological advancements in fish oil extraction and purification and rise in demand for plant-based and vegan diets will lead to sizable demand in the market.
The report on the omega 3 products market covers the following areas:
- Omega 3 products market sizing
- Omega 3 products market forecast
- Omega 3 products market industry analysis
The robust vendor analysis is designed to help clients improve their market position, and in line with this, this report provides a detailed analysis of several leading omega 3 products market vendors that include Aker BioMarine ASA, Amway Corp., Archer Daniels Midland Co., BASF SE, Cargill Inc., China Mengniu Dairy Co. Ltd., Cooke Aquaculture Inc., Croda International Plc, GC Rieber AS, Golden Omega S.A., Herbalife International of America Inc., Koninklijke DSM NV, Lonza Group Ltd., Natures Crops International, Nestle SA, Orkla ASA, Pelagia AS, Quadra Chemicals Ltd., Reckitt Benckiser Group Plc, and Unilever PLC. Also, the omega 3 products market analysis report includes information on upcoming trends and challenges that will influence market growth. This is to help companies strategize and leverage all forthcoming growth opportunities.
The study was conducted using an objective combination of primary and secondary information including inputs from key participants in the industry. The report contains a comprehensive market and vendor landscape in addition to an analysis of the key vendors.
The publisher presents a detailed picture of the market by the way of study, synthesis, and summation of data from multiple sources by an analysis of key parameters such as profit, pricing, competition, and promotions. It presents various market facets by identifying the key industry influencers. The data presented is comprehensive, reliable, and a result of extensive research - both primary and secondary. The market research reports provide a complete competitive landscape and an in-depth vendor selection methodology and analysis using qualitative and quantitative research to forecast the accurate market growth.
Table of Contents
1 Executive Summary
- 1.1 Market overview
- Executive Summary - Chart on Market Overview
- Executive Summary - Data Table on Market Overview
- Executive Summary - Chart on Global Market Characteristics
- Executive Summary - Chart on Market By Geographical Landscape
- Executive Summary - Chart on Market Segmentation by Product
- Executive Summary - Chart on Market Segmentation by Type
- Executive Summary - Chart on Incremental Growth
- Executive Summary - Data Table on Incremental Growth
- Executive Summary - Chart on Company Market Positioning
2 Market Landscape
- 2.1 Market ecosystem
- Parent Market
- Data Table on - Parent Market
- 2.2 Market characteristics
- Market characteristics analysis
- 2.3 Value chain analysis
- Value Chain Analysis
3 Market Sizing
- 3.1 Market definition
- Offerings of companies included in the market definition
- 3.2 Market segment analysis
- Market segments
- 3.3 Market size 2023
- 3.4 Market outlook: Forecast for 2023-2028
- Chart on Global - Market size and forecast 2023-2028 ($ million)
- Data Table on Global - Market size and forecast 2023-2028 ($ million)
- Chart on Global Market: Year-over-year growth 2023-2028 (%)
- Data Table on Global Market: Year-over-year growth 2023-2028 (%)
4 Historic Market Size
- 4.1 Global Omega 3 Products Market 2018 - 2022
- Historic Market Size - Data Table on Global Omega 3 Products Market 2018 - 2022 ($ million)
- 4.2 Product segment analysis 2018 - 2022
- Historic Market Size - Product Segment 2018 - 2022 ($ million)
- 4.3 Type segment analysis 2018 - 2022
- Historic Market Size - Type Segment 2018 - 2022 ($ million)
- 4.4 Geography segment analysis 2018 - 2022
- Historic Market Size - Geography Segment 2018 - 2022 ($ million)
- 4.5 Country segment analysis 2018 - 2022
- Historic Market Size - Country Segment 2018 - 2022 ($ million)
5 Five Forces Analysis
- 5.1 Five forces summary
- Five forces analysis - Comparison between 2023 and 2028
- 5.2 Bargaining power of buyers
- Bargaining power of buyers - Impact of key factors 2023 and 2028
- 5.3 Bargaining power of suppliers
- Bargaining power of suppliers - Impact of key factors in 2023 and 2028
- 5.4 Threat of new entrants
- Threat of new entrants - Impact of key factors in 2023 and 2028
- 5.5 Threat of substitutes
- Threat of substitutes - Impact of key factors in 2023 and 2028
- 5.6 Threat of rivalry
- Threat of rivalry - Impact of key factors in 2023 and 2028
- 5.7 Market condition
- Chart on Market condition - Five forces 2023 and 2028
6 Market Segmentation by Product
- 6.1 Market segments
- Chart on Product - Market share 2023-2028 (%)
- Data Table on Product - Market share 2023-2028 (%)
- 6.2 Comparison by Product
- Chart on Comparison by Product
- Data Table on Comparison by Product
- 6.3 Functional food and supplements - Market size and forecast 2023-2028
- Chart on Functional food and supplements - Market size and forecast 2023-2028 ($ million)
- Data Table on Functional food and supplements - Market size and forecast 2023-2028 ($ million)
- Chart on Functional food and supplements - Year-over-year growth 2023-2028 (%)
- Data Table on Functional food and supplements - Year-over-year growth 2023-2028 (%)
- 6.4 Infant nutrition - Market size and forecast 2023-2028
- Chart on Infant nutrition - Market size and forecast 2023-2028 ($ million)
- Data Table on Infant nutrition - Market size and forecast 2023-2028 ($ million)
- Chart on Infant nutrition - Year-over-year growth 2023-2028 (%)
- Data Table on Infant nutrition - Year-over-year growth 2023-2028 (%)
- 6.5 Pharmaceutical - Market size and forecast 2023-2028
- Chart on Pharmaceutical - Market size and forecast 2023-2028 ($ million)
- Data Table on Pharmaceutical - Market size and forecast 2023-2028 ($ million)
- Chart on Pharmaceutical - Year-over-year growth 2023-2028 (%)
- Data Table on Pharmaceutical - Year-over-year growth 2023-2028 (%)
- 6.6 Pet food and feed - Market size and forecast 2023-2028
- Chart on Pet food and feed - Market size and forecast 2023-2028 ($ million)
- Data Table on Pet food and feed - Market size and forecast 2023-2028 ($ million)
- Chart on Pet food and feed - Year-over-year growth 2023-2028 (%)
- Data Table on Pet food and feed - Year-over-year growth 2023-2028 (%)
- 6.7 Market opportunity by Product
- Market opportunity by Product ($ million)
- Data Table on Market opportunity by Product ($ million)
7 Market Segmentation by Type
- 7.1 Market segments
- Chart on Type - Market share 2023-2028 (%)
- Data Table on Type - Market share 2023-2028 (%)
- 7.2 Comparison by Type
- Chart on Comparison by Type
- Data Table on Comparison by Type
- 7.3 DHA - Market size and forecast 2023-2028
- Chart on DHA - Market size and forecast 2023-2028 ($ million)
- Data Table on DHA - Market size and forecast 2023-2028 ($ million)
- Chart on DHA - Year-over-year growth 2023-2028 (%)
- Data Table on DHA - Year-over-year growth 2023-2028 (%)
- 7.4 EPA - Market size and forecast 2023-2028
- Chart on EPA - Market size and forecast 2023-2028 ($ million)
- Data Table on EPA - Market size and forecast 2023-2028 ($ million)
- Chart on EPA - Year-over-year growth 2023-2028 (%)
- Data Table on EPA - Year-over-year growth 2023-2028 (%)
- 7.5 ALA - Market size and forecast 2023-2028
- Chart on ALA - Market size and forecast 2023-2028 ($ million)
- Data Table on ALA - Market size and forecast 2023-2028 ($ million)
- Chart on ALA - Year-over-year growth 2023-2028 (%)
- Data Table on ALA - Year-over-year growth 2023-2028 (%)
- 7.6 Market opportunity by Type
- Market opportunity by Type ($ million)
- Data Table on Market opportunity by Type ($ million)
8 Customer Landscape
- 8.1 Customer landscape overview
- Analysis of price sensitivity, lifecycle, customer purchase basket, adoption rates, and purchase criteria
9 Geographic Landscape
- 9.1 Geographic segmentation
- Chart on Market share By Geographical Landscape 2023-2028 (%)
- Data Table on Market share By Geographical Landscape 2023-2028 (%)
- 9.2 Geographic comparison
- Chart on Geographic comparison
- Data Table on Geographic comparison
- 9.3 North America - Market size and forecast 2023-2028
- Chart on North America - Market size and forecast 2023-2028 ($ million)
- Data Table on North America - Market size and forecast 2023-2028 ($ million)
- Chart on North America - Year-over-year growth 2023-2028 (%)
- Data Table on North America - Year-over-year growth 2023-2028 (%)
- 9.4 APAC - Market size and forecast 2023-2028
- Chart on APAC - Market size and forecast 2023-2028 ($ million)
- Data Table on APAC - Market size and forecast 2023-2028 ($ million)
- Chart on APAC - Year-over-year growth 2023-2028 (%)
- Data Table on APAC - Year-over-year growth 2023-2028 (%)
- 9.5 Europe - Market size and forecast 2023-2028
- Chart on Europe - Market size and forecast 2023-2028 ($ million)
- Data Table on Europe - Market size and forecast 2023-2028 ($ million)
- Chart on Europe - Year-over-year growth 2023-2028 (%)
- Data Table on Europe - Year-over-year growth 2023-2028 (%)
- 9.6 South America - Market size and forecast 2023-2028
- Chart on South America - Market size and forecast 2023-2028 ($ million)
- Data Table on South America - Market size and forecast 2023-2028 ($ million)
- Chart on South America - Year-over-year growth 2023-2028 (%)
- Data Table on South America - Year-over-year growth 2023-2028 (%)
- 9.7 Middle East and Africa - Market size and forecast 2023-2028
- Chart on Middle East and Africa - Market size and forecast 2023-2028 ($ million)
- Data Table on Middle East and Africa - Market size and forecast 2023-2028 ($ million)
- Chart on Middle East and Africa - Year-over-year growth 2023-2028 (%)
- Data Table on Middle East and Africa - Year-over-year growth 2023-2028 (%)
- 9.8 US - Market size and forecast 2023-2028
- Chart on US - Market size and forecast 2023-2028 ($ million)
- Data Table on US - Market size and forecast 2023-2028 ($ million)
- Chart on US - Year-over-year growth 2023-2028 (%)
- Data Table on US - Year-over-year growth 2023-2028 (%)
- 9.9 China - Market size and forecast 2023-2028
- Chart on China - Market size and forecast 2023-2028 ($ million)
- Data Table on China - Market size and forecast 2023-2028 ($ million)
- Chart on China - Year-over-year growth 2023-2028 (%)
- Data Table on China - Year-over-year growth 2023-2028 (%)
- 9.10 Canada - Market size and forecast 2023-2028
- Chart on Canada - Market size and forecast 2023-2028 ($ million)
- Data Table on Canada - Market size and forecast 2023-2028 ($ million)
- Chart on Canada - Year-over-year growth 2023-2028 (%)
- Data Table on Canada - Year-over-year growth 2023-2028 (%)
- 9.11 Germany - Market size and forecast 2023-2028
- Chart on Germany - Market size and forecast 2023-2028 ($ million)
- Data Table on Germany - Market size and forecast 2023-2028 ($ million)
- Chart on Germany - Year-over-year growth 2023-2028 (%)
- Data Table on Germany - Year-over-year growth 2023-2028 (%)
- 9.12 Japan - Market size and forecast 2023-2028
- Chart on Japan - Market size and forecast 2023-2028 ($ million)
- Data Table on Japan - Market size and forecast 2023-2028 ($ million)
- Chart on Japan - Year-over-year growth 2023-2028 (%)
- Data Table on Japan - Year-over-year growth 2023-2028 (%)
- 9.13 Market opportunity By Geographical Landscape
- Market opportunity By Geographical Landscape ($ million)
- Data Tables on Market opportunity By Geographical Landscape ($ million)
10 Drivers, Challenges, and Opportunity/Restraints
- 10.1 Market drivers
- 10.2 Market challenges
- 10.3 Impact of drivers and challenges
- Impact of drivers and challenges in 2023 and 2028
- 10.4 Market opportunities/restraints
11 Competitive Landscape
- 11.1 Overview
- 11.2 Competitive Landscape
- Overview on criticality of inputs and factors of differentiation
- 11.3 Landscape disruption
- Overview on factors of disruption
- 11.4 Industry risks
- Impact of key risks on business
12 Competitive Analysis
- 12.1 Companies profiled
- Companies covered
- 12.2 Market positioning of companies
- Matrix on companies position and classification
- 12.3 Aker BioMarine ASA
- Aker BioMarine ASA - Overview
- Aker BioMarine ASA - Business segments
- Aker BioMarine ASA - Key offerings
- Aker BioMarine ASA - Segment focus
- 12.4 Archer Daniels Midland Co.
- Archer Daniels Midland Co. - Overview
- Archer Daniels Midland Co. - Business segments
- Archer Daniels Midland Co. - Key news
- Archer Daniels Midland Co. - Key offerings
- Archer Daniels Midland Co. - Segment focus
- 12.5 BASF SE
- BASF SE - Overview
- BASF SE - Business segments
- BASF SE - Key news
- BASF SE - Key offerings
- BASF SE - Segment focus
- 12.6 Cargill Inc.
- Cargill Inc. - Overview
- Cargill Inc. - Product / Service
- Cargill Inc. - Key news
- Cargill Inc. - Key offerings
- 12.7 China Mengniu Dairy Co. Ltd.
- China Mengniu Dairy Co. Ltd. - Overview
- China Mengniu Dairy Co. Ltd. - Business segments
- China Mengniu Dairy Co. Ltd. - Key offerings
- China Mengniu Dairy Co. Ltd. - Segment focus
- 12.8 Cooke Aquaculture Inc.
- Cooke Aquaculture Inc. - Overview
- Cooke Aquaculture Inc. - Product / Service
- Cooke Aquaculture Inc. - Key offerings
- 12.9 Croda International Plc
- Croda International Plc - Overview
- Croda International Plc - Business segments
- Croda International Plc - Key news
- Croda International Plc - Key offerings
- Croda International Plc - Segment focus
- 12.10 GC Rieber AS
- GC Rieber AS - Overview
- GC Rieber AS - Product / Service
- GC Rieber AS - Key offerings
- 12.11 Koninklijke DSM NV
- Koninklijke DSM NV - Overview
- Koninklijke DSM NV - Business segments
- Koninklijke DSM NV - Key news
- Koninklijke DSM NV - Key offerings
- Koninklijke DSM NV - Segment focus
- 12.12 Lonza Group Ltd.
- Lonza Group Ltd. - Overview
- Lonza Group Ltd. - Business segments
- Lonza Group Ltd. - Key news
- Lonza Group Ltd. - Key offerings
- Lonza Group Ltd. - Segment focus
- 12.13 Nestle SA
- Nestle SA - Overview
- Nestle SA - Business segments
- Nestle SA - Key news
- Nestle SA - Key offerings
- Nestle SA - Segment focus
- 12.14 Orkla ASA
- Orkla ASA - Overview
- Orkla ASA - Business segments
- Orkla ASA - Key news
- Orkla ASA - Key offerings
- Orkla ASA - Segment focus
- 12.15 Pelagia AS
- Pelagia AS - Overview
- Pelagia AS - Product / Service
- Pelagia AS - Key offerings
- 12.16 Reckitt Benckiser Group Plc
- Reckitt Benckiser Group Plc - Overview
- Reckitt Benckiser Group Plc - Business segments
- Reckitt Benckiser Group Plc - Key news
- Reckitt Benckiser Group Plc - Key offerings
- Reckitt Benckiser Group Plc - Segment focus
- 12.17 Unilever PLC
- Unilever PLC - Overview
- Unilever PLC - Business segments
- Unilever PLC - Key news
- Unilever PLC - Key offerings
- Unilever PLC - Segment focus
13 Appendix
- 13.1 Scope of the report
- 13.2 Inclusions and exclusions checklist
- Inclusions checklist
- Exclusions checklist
- 13.3 Currency conversion rates for US$
- Currency conversion rates for US$
- 13.4 Research methodology
- Research methodology
- 13.5 Data procurement
- Information sources
- 13.6 Data validation
- Data validation
- 13.7 Validation techniques employed for market sizing
- Validation techniques employed for market sizing
- 13.8 Data synthesis
- Data synthesis
- 13.9 360 degree market analysis
- 360 degree market analysis
- 13.10 List of abbreviations
- List of abbreviations

