|
|
市場調査レポート
商品コード
1719406
セメントレス人工膝関節全置換術の世界市場 2025~2029年Global Cementless Total Knee Arthroplasty Market 2025-2029 |
||||||

|
|||||||
カスタマイズ可能
|
|||||||


| セメントレス人工膝関節全置換術の世界市場 2025~2029年 |
|
出版日: 2025年04月18日
発行: TechNavio
ページ情報: 英文 235 Pages
納期: 即納可能
|

全表示
- 概要
- 図表
- 目次
セメントレス人工膝関節全置換術市場は2024-2029年に57億5,460万米ドル、予測期間中のCAGRは30.4%で成長すると予測されます。
この調査レポートは、セメントレス人工膝関節全置換術市場の全体分析、市場規模・予測、動向、成長促進要因、課題、約25のベンダーを網羅したベンダー分析などを掲載しています。
現在の市場シナリオ、最新動向と促進要因、市場環境全体に関する最新分析を提供しています。関節炎と診断される人の増加、スポーツ障害の増加、ヘルスケアニーズを満たすための政府支援の増加などが市場を牽引しています。
| 市場範囲 | |
|---|---|
| 基準年 | 2025 |
| 終了年 | 2029 |
| 予測期間 | 2025-2029 |
| 成長モメンタム | 加速 |
| 前年比2025年 | 25.1% |
| CAGR | 30.4% |
| 増分額 | 57億5,460万米ドル |
本調査は、業界の主要参加者からのインプットを含め、一次情報と二次情報を客観的に組み合わせて実施しました。レポートには、主要企業の分析に加え、包括的な市場規模データ、地域別分析によるセグメント、ベンダー情勢が含まれています。レポートには過去データと予測データがあります。
本調査では、外来患者による人工膝関節置換術の増加が、今後数年間のセメントレス人工膝関節全置換術市場の成長を促進する主要な理由の1つであると特定しています。また、ロボット膝移植手術への注目の高まりと3dプリント膝インプラントの需要増加が、市場の大きな需要につながります。
目次
第1章 エグゼクティブサマリー
- 市場概要
第2章 Technavio分析
- 価格・ライフサイクル・顧客購入バスケット・採用率・購入基準の分析
- インプットの重要性と差別化の要因
- 混乱の要因
- 促進要因と課題の影響
第3章 市場情勢
- 市場エコシステム
- 市場の特徴
- バリューチェーン分析
第4章 市場規模
- 市場の定義
- 市場セグメント分析
- 市場規模 2024
- 市場の見通し 2024-2029
第5章 市場規模実績
- セメントレス人工膝関節全置換術の世界市場 2019-2023
- 製品セグメント分析 2019-2023
- エンドユーザー別セグメント分析 2019-2023
- 素材別セグメント分析 2019-2023
- タイプ別セグメント分析 2019-2023
- 地域別セグメント分析 2019-2023
- 国別セグメント分析 2019-2023
第6章 定性分析
- AIの影響:セメントレス人工膝関節全置換術の世界市場
第7章 ファイブフォース分析
- ファイブフォースの要約
- 買い手の交渉力
- 供給企業の交渉力
- 新規参入業者の脅威
- 代替品の脅威
- 競争の脅威
- 市況
第8章 市場セグメンテーション:製品別
- 市場セグメント
- 比較:製品別
- 固定型ベアリング:市場規模と予測 2024-2029
- 移動型ベアリング:市場規模と予測 2024-2029
- 市場機会:製品別
第9章 市場セグメンテーション:エンドユーザー別
- 市場セグメント
- 比較:エンドユーザー別
- 病院:市場規模と予測 2024-2029
- 整形外科クリニック:市場規模と予測 2024-2029
- 外来手術センター:市場規模と予測 2024-2029
- 市場機会:エンドユーザー別
第10章 市場セグメンテーション:素材別
- 市場セグメント
- 比較:素材別
- 合金:市場規模と予測 2024-2029
- セラミックス:市場規模と予測 2024-2029
- その他:市場規模と予測 2024-2029
- 市場機会:素材別
第11章 市場セグメンテーション:タイプ別
- 市場セグメント
- 比較:タイプ別
- モノブロック:市場規模と予測 2024-2029
- モジュラー:市場規模と予測 2024-2029
- ハイブリッド:市場規模と予測 2024-2029
- 市場機会:タイプ別
第12章 顧客情勢
- 顧客情勢の概要
第13章 地域別情勢
- 地域別セグメンテーション
- 地域別比較
- 北米:市場規模と予測 2024-2029
- 欧州:市場規模と予測 2024-2029
- アジア:市場規模と予測 2024-2029
- 世界のその他の地域:市場規模と予測 2024-2029
- 米国:市場規模と予測 2024-2029
- ドイツ:市場規模と予測 2024-2029
- カナダ:市場規模と予測 2024-2029
- 中国:市場規模と予測 2024-2029
- 英国:市場規模と予測 2024-2029
- フランス:市場規模と予測 2024-2029
- 日本:市場規模と予測 2024-2029
- イタリア:市場規模と予測 2024-2029
- インド:市場規模と予測 2024-2029
- スペイン:市場規模と予測 2024-2029
- 市場機会:地域情勢別
第14章 促進要因・課題・機会・抑制要因
- 市場促進要因
- 市場の課題
- 促進要因と課題の影響
- 市場の機会・抑制要因
第15章 競合情勢
- 概要
- 競合情勢
- 混乱の状況
- 業界のリスク
第16章 競合分析
- 企業プロファイル
- 企業ランキング指数
- 企業の市場ポジショニング
- Conformis Inc.
- Corin Group Plc
- DJO Global Inc.
- Euromed Implants GmbH
- Exactech Inc.
- GROUP FH ORTHO
- Johnson and Johnson Services Inc.
- Mathys AG Bettlach
- MicroPort Scientific Corp.
- Smith and Nephew plc
- Stryker Corp.
- United Orthopedic Corp.
- Waldemar Link GmbH and Co. KG
- X.NOV
- Zimmer Biomet Holdings Inc.
第17章 付録
Exhibits:
- Exhibits1: Executive Summary - Chart on Market Overview
- Exhibits2: Executive Summary - Data Table on Market Overview
- Exhibits3: Executive Summary - Chart on Global Market Characteristics
- Exhibits4: Executive Summary - Chart on Market By Geographical Landscape
- Exhibits5: Executive Summary - Chart on Market Segmentation by Product
- Exhibits6: Executive Summary - Chart on Market Segmentation by End-user
- Exhibits7: Executive Summary - Chart on Market Segmentation by Material
- Exhibits8: Executive Summary - Chart on Market Segmentation by Type
- Exhibits9: Executive Summary - Chart on Incremental Growth
- Exhibits10: Executive Summary - Data Table on Incremental Growth
- Exhibits11: Executive Summary - Chart on Company Market Positioning
- Exhibits12: Analysis of price sensitivity, lifecycle, customer purchase basket, adoption rates, and purchase criteria
- Exhibits13: Overview on criticality of inputs and factors of differentiation
- Exhibits14: Overview on factors of disruption
- Exhibits15: Impact of drivers and challenges in 2024 and 2029
- Exhibits16: Parent Market
- Exhibits17: Data Table on - Parent Market
- Exhibits18: Market characteristics analysis
- Exhibits19: Value chain analysis
- Exhibits20: Offerings of companies included in the market definition
- Exhibits21: Market segments
- Exhibits22: Chart on Global - Market size and forecast 2024-2029 ($ million)
- Exhibits23: Data Table on Global - Market size and forecast 2024-2029 ($ million)
- Exhibits24: Chart on Global Market: Year-over-year growth 2024-2029 (%)
- Exhibits25: Data Table on Global Market: Year-over-year growth 2024-2029 (%)
- Exhibits26: Historic Market Size - Data Table on Global Cementless Total Knee Arthroplasty Market 2019 - 2023 ($ million)
- Exhibits27: Historic Market Size - Product Segment 2019 - 2023 ($ million)
- Exhibits28: Historic Market Size - End-user Segment 2019 - 2023 ($ million)
- Exhibits29: Historic Market Size - Material Segment 2019 - 2023 ($ million)
- Exhibits30: Historic Market Size - Type Segment 2019 - 2023 ($ million)
- Exhibits31: Historic Market Size - Geography Segment 2019 - 2023 ($ million)
- Exhibits32: Historic Market Size - Country Segment 2019 - 2023 ($ million)
- Exhibits33: Five forces analysis - Comparison between 2024 and 2029
- Exhibits34: Bargaining power of buyers - Impact of key factors 2024 and 2029
- Exhibits35: Bargaining power of suppliers - Impact of key factors in 2024 and 2029
- Exhibits36: Threat of new entrants - Impact of key factors in 2024 and 2029
- Exhibits37: Threat of substitutes - Impact of key factors in 2024 and 2029
- Exhibits38: Threat of rivalry - Impact of key factors in 2024 and 2029
- Exhibits39: Chart on Market condition - Five forces 2024 and 2029
- Exhibits40: Chart on Product - Market share 2024-2029 (%)
- Exhibits41: Data Table on Product - Market share 2024-2029 (%)
- Exhibits42: Chart on Comparison by Product
- Exhibits43: Data Table on Comparison by Product
- Exhibits44: Chart on Fixed-bearing - Market size and forecast 2024-2029 ($ million)
- Exhibits45: Data Table on Fixed-bearing - Market size and forecast 2024-2029 ($ million)
- Exhibits46: Chart on Fixed-bearing - Year-over-year growth 2024-2029 (%)
- Exhibits47: Data Table on Fixed-bearing - Year-over-year growth 2024-2029 (%)
- Exhibits48: Chart on Mobile-bearing - Market size and forecast 2024-2029 ($ million)
- Exhibits49: Data Table on Mobile-bearing - Market size and forecast 2024-2029 ($ million)
- Exhibits50: Chart on Mobile-bearing - Year-over-year growth 2024-2029 (%)
- Exhibits51: Data Table on Mobile-bearing - Year-over-year growth 2024-2029 (%)
- Exhibits52: Market opportunity by Product ($ million)
- Exhibits53: Data Table on Market opportunity by Product ($ million)
- Exhibits54: Chart on End-user - Market share 2024-2029 (%)
- Exhibits55: Data Table on End-user - Market share 2024-2029 (%)
- Exhibits56: Chart on Comparison by End-user
- Exhibits57: Data Table on Comparison by End-user
- Exhibits58: Chart on Hospitals - Market size and forecast 2024-2029 ($ million)
- Exhibits59: Data Table on Hospitals - Market size and forecast 2024-2029 ($ million)
- Exhibits60: Chart on Hospitals - Year-over-year growth 2024-2029 (%)
- Exhibits61: Data Table on Hospitals - Year-over-year growth 2024-2029 (%)
- Exhibits62: Chart on Orthopedic clinics - Market size and forecast 2024-2029 ($ million)
- Exhibits63: Data Table on Orthopedic clinics - Market size and forecast 2024-2029 ($ million)
- Exhibits64: Chart on Orthopedic clinics - Year-over-year growth 2024-2029 (%)
- Exhibits65: Data Table on Orthopedic clinics - Year-over-year growth 2024-2029 (%)
- Exhibits66: Chart on Ambulatory surgical centers - Market size and forecast 2024-2029 ($ million)
- Exhibits67: Data Table on Ambulatory surgical centers - Market size and forecast 2024-2029 ($ million)
- Exhibits68: Chart on Ambulatory surgical centers - Year-over-year growth 2024-2029 (%)
- Exhibits69: Data Table on Ambulatory surgical centers - Year-over-year growth 2024-2029 (%)
- Exhibits70: Market opportunity by End-user ($ million)
- Exhibits71: Data Table on Market opportunity by End-user ($ million)
- Exhibits72: Chart on Material - Market share 2024-2029 (%)
- Exhibits73: Data Table on Material - Market share 2024-2029 (%)
- Exhibits74: Chart on Comparison by Material
- Exhibits75: Data Table on Comparison by Material
- Exhibits76: Chart on Alloy - Market size and forecast 2024-2029 ($ million)
- Exhibits77: Data Table on Alloy - Market size and forecast 2024-2029 ($ million)
- Exhibits78: Chart on Alloy - Year-over-year growth 2024-2029 (%)
- Exhibits79: Data Table on Alloy - Year-over-year growth 2024-2029 (%)
- Exhibits80: Chart on Ceramics - Market size and forecast 2024-2029 ($ million)
- Exhibits81: Data Table on Ceramics - Market size and forecast 2024-2029 ($ million)
- Exhibits82: Chart on Ceramics - Year-over-year growth 2024-2029 (%)
- Exhibits83: Data Table on Ceramics - Year-over-year growth 2024-2029 (%)
- Exhibits84: Chart on Others - Market size and forecast 2024-2029 ($ million)
- Exhibits85: Data Table on Others - Market size and forecast 2024-2029 ($ million)
- Exhibits86: Chart on Others - Year-over-year growth 2024-2029 (%)
- Exhibits87: Data Table on Others - Year-over-year growth 2024-2029 (%)
- Exhibits88: Market opportunity by Material ($ million)
- Exhibits89: Data Table on Market opportunity by Material ($ million)
- Exhibits90: Chart on Type - Market share 2024-2029 (%)
- Exhibits91: Data Table on Type - Market share 2024-2029 (%)
- Exhibits92: Chart on Comparison by Type
- Exhibits93: Data Table on Comparison by Type
- Exhibits94: Chart on Monoblock - Market size and forecast 2024-2029 ($ million)
- Exhibits95: Data Table on Monoblock - Market size and forecast 2024-2029 ($ million)
- Exhibits96: Chart on Monoblock - Year-over-year growth 2024-2029 (%)
- Exhibits97: Data Table on Monoblock - Year-over-year growth 2024-2029 (%)
- Exhibits98: Chart on Modular - Market size and forecast 2024-2029 ($ million)
- Exhibits99: Data Table on Modular - Market size and forecast 2024-2029 ($ million)
- Exhibits100: Chart on Modular - Year-over-year growth 2024-2029 (%)
- Exhibits101: Data Table on Modular - Year-over-year growth 2024-2029 (%)
- Exhibits102: Chart on Hybrid - Market size and forecast 2024-2029 ($ million)
- Exhibits103: Data Table on Hybrid - Market size and forecast 2024-2029 ($ million)
- Exhibits104: Chart on Hybrid - Year-over-year growth 2024-2029 (%)
- Exhibits105: Data Table on Hybrid - Year-over-year growth 2024-2029 (%)
- Exhibits106: Market opportunity by Type ($ million)
- Exhibits107: Data Table on Market opportunity by Type ($ million)
- Exhibits108: Analysis of price sensitivity, lifecycle, customer purchase basket, adoption rates, and purchase criteria
- Exhibits109: Chart on Market share By Geographical Landscape 2024-2029 (%)
- Exhibits110: Data Table on Market share By Geographical Landscape 2024-2029 (%)
- Exhibits111: Chart on Geographic comparison
- Exhibits112: Data Table on Geographic comparison
- Exhibits113: Chart on North America - Market size and forecast 2024-2029 ($ million)
- Exhibits114: Data Table on North America - Market size and forecast 2024-2029 ($ million)
- Exhibits115: Chart on North America - Year-over-year growth 2024-2029 (%)
- Exhibits116: Data Table on North America - Year-over-year growth 2024-2029 (%)
- Exhibits117: Chart on Europe - Market size and forecast 2024-2029 ($ million)
- Exhibits118: Data Table on Europe - Market size and forecast 2024-2029 ($ million)
- Exhibits119: Chart on Europe - Year-over-year growth 2024-2029 (%)
- Exhibits120: Data Table on Europe - Year-over-year growth 2024-2029 (%)
- Exhibits121: Chart on Asia - Market size and forecast 2024-2029 ($ million)
- Exhibits122: Data Table on Asia - Market size and forecast 2024-2029 ($ million)
- Exhibits123: Chart on Asia - Year-over-year growth 2024-2029 (%)
- Exhibits124: Data Table on Asia - Year-over-year growth 2024-2029 (%)
- Exhibits125: Chart on Rest of World (ROW) - Market size and forecast 2024-2029 ($ million)
- Exhibits126: Data Table on Rest of World (ROW) - Market size and forecast 2024-2029 ($ million)
- Exhibits127: Chart on Rest of World (ROW) - Year-over-year growth 2024-2029 (%)
- Exhibits128: Data Table on Rest of World (ROW) - Year-over-year growth 2024-2029 (%)
- Exhibits129: Chart on US - Market size and forecast 2024-2029 ($ million)
- Exhibits130: Data Table on US - Market size and forecast 2024-2029 ($ million)
- Exhibits131: Chart on US - Year-over-year growth 2024-2029 (%)
- Exhibits132: Data Table on US - Year-over-year growth 2024-2029 (%)
- Exhibits133: Chart on Germany - Market size and forecast 2024-2029 ($ million)
- Exhibits134: Data Table on Germany - Market size and forecast 2024-2029 ($ million)
- Exhibits135: Chart on Germany - Year-over-year growth 2024-2029 (%)
- Exhibits136: Data Table on Germany - Year-over-year growth 2024-2029 (%)
- Exhibits137: Chart on Canada - Market size and forecast 2024-2029 ($ million)
- Exhibits138: Data Table on Canada - Market size and forecast 2024-2029 ($ million)
- Exhibits139: Chart on Canada - Year-over-year growth 2024-2029 (%)
- Exhibits140: Data Table on Canada - Year-over-year growth 2024-2029 (%)
- Exhibits141: Chart on China - Market size and forecast 2024-2029 ($ million)
- Exhibits142: Data Table on China - Market size and forecast 2024-2029 ($ million)
- Exhibits143: Chart on China - Year-over-year growth 2024-2029 (%)
- Exhibits144: Data Table on China - Year-over-year growth 2024-2029 (%)
- Exhibits145: Chart on UK - Market size and forecast 2024-2029 ($ million)
- Exhibits146: Data Table on UK - Market size and forecast 2024-2029 ($ million)
- Exhibits147: Chart on UK - Year-over-year growth 2024-2029 (%)
- Exhibits148: Data Table on UK - Year-over-year growth 2024-2029 (%)
- Exhibits149: Chart on France - Market size and forecast 2024-2029 ($ million)
- Exhibits150: Data Table on France - Market size and forecast 2024-2029 ($ million)
- Exhibits151: Chart on France - Year-over-year growth 2024-2029 (%)
- Exhibits152: Data Table on France - Year-over-year growth 2024-2029 (%)
- Exhibits153: Chart on Japan - Market size and forecast 2024-2029 ($ million)
- Exhibits154: Data Table on Japan - Market size and forecast 2024-2029 ($ million)
- Exhibits155: Chart on Japan - Year-over-year growth 2024-2029 (%)
- Exhibits156: Data Table on Japan - Year-over-year growth 2024-2029 (%)
- Exhibits157: Chart on Italy - Market size and forecast 2024-2029 ($ million)
- Exhibits158: Data Table on Italy - Market size and forecast 2024-2029 ($ million)
- Exhibits159: Chart on Italy - Year-over-year growth 2024-2029 (%)
- Exhibits160: Data Table on Italy - Year-over-year growth 2024-2029 (%)
- Exhibits161: Chart on India - Market size and forecast 2024-2029 ($ million)
- Exhibits162: Data Table on India - Market size and forecast 2024-2029 ($ million)
- Exhibits163: Chart on India - Year-over-year growth 2024-2029 (%)
- Exhibits164: Data Table on India - Year-over-year growth 2024-2029 (%)
- Exhibits165: Chart on Spain - Market size and forecast 2024-2029 ($ million)
- Exhibits166: Data Table on Spain - Market size and forecast 2024-2029 ($ million)
- Exhibits167: Chart on Spain - Year-over-year growth 2024-2029 (%)
- Exhibits168: Data Table on Spain - Year-over-year growth 2024-2029 (%)
- Exhibits169: Market opportunity By Geographical Landscape ($ million)
- Exhibits170: Data Tables on Market opportunity By Geographical Landscape ($ million)
- Exhibits171: Impact of drivers and challenges in 2024 and 2029
- Exhibits172: Overview on criticality of inputs and factors of differentiation
- Exhibits173: Overview on factors of disruption
- Exhibits174: Impact of key risks on business
- Exhibits175: Companies covered
- Exhibits176: Company ranking index
- Exhibits177: Matrix on companies position and classification
- Exhibits178: Conformis Inc. - Overview
- Exhibits179: Conformis Inc. - Product / Service
- Exhibits180: Conformis Inc. - Key offerings
- Exhibits181: SWOT
- Exhibits182: Corin Group Plc - Overview
- Exhibits183: Corin Group Plc - Product / Service
- Exhibits184: Corin Group Plc - Key offerings
- Exhibits185: SWOT
- Exhibits186: DJO Global Inc. - Overview
- Exhibits187: DJO Global Inc. - Product / Service
- Exhibits188: DJO Global Inc. - Key offerings
- Exhibits189: SWOT
- Exhibits190: Euromed Implants GmbH - Overview
- Exhibits191: Euromed Implants GmbH - Product / Service
- Exhibits192: Euromed Implants GmbH - Key offerings
- Exhibits193: SWOT
- Exhibits194: Exactech Inc. - Overview
- Exhibits195: Exactech Inc. - Product / Service
- Exhibits196: Exactech Inc. - Key offerings
- Exhibits197: SWOT
- Exhibits198: GROUP FH ORTHO - Overview
- Exhibits199: GROUP FH ORTHO - Product / Service
- Exhibits200: GROUP FH ORTHO - Key offerings
- Exhibits201: SWOT
- Exhibits202: Johnson and Johnson Services Inc. - Overview
- Exhibits203: Johnson and Johnson Services Inc. - Business segments
- Exhibits204: Johnson and Johnson Services Inc. - Key news
- Exhibits205: Johnson and Johnson Services Inc. - Key offerings
- Exhibits206: Johnson and Johnson Services Inc. - Segment focus
- Exhibits207: SWOT
- Exhibits208: Mathys AG Bettlach - Overview
- Exhibits209: Mathys AG Bettlach - Product / Service
- Exhibits210: Mathys AG Bettlach - Key offerings
- Exhibits211: SWOT
- Exhibits212: MicroPort Scientific Corp. - Overview
- Exhibits213: MicroPort Scientific Corp. - Business segments
- Exhibits214: MicroPort Scientific Corp. - Key news
- Exhibits215: MicroPort Scientific Corp. - Key offerings
- Exhibits216: MicroPort Scientific Corp. - Segment focus
- Exhibits217: SWOT
- Exhibits218: Smith and Nephew plc - Overview
- Exhibits219: Smith and Nephew plc - Business segments
- Exhibits220: Smith and Nephew plc - Key news
- Exhibits221: Smith and Nephew plc - Key offerings
- Exhibits222: Smith and Nephew plc - Segment focus
- Exhibits223: SWOT
- Exhibits224: Stryker Corp. - Overview
- Exhibits225: Stryker Corp. - Business segments
- Exhibits226: Stryker Corp. - Key news
- Exhibits227: Stryker Corp. - Key offerings
- Exhibits228: Stryker Corp. - Segment focus
- Exhibits229: SWOT
- Exhibits230: United Orthopedic Corp. - Overview
- Exhibits231: United Orthopedic Corp. - Product / Service
- Exhibits232: United Orthopedic Corp. - Key offerings
- Exhibits233: SWOT
- Exhibits234: Waldemar Link GmbH and Co. KG - Overview
- Exhibits235: Waldemar Link GmbH and Co. KG - Product / Service
- Exhibits236: Waldemar Link GmbH and Co. KG - Key offerings
- Exhibits237: SWOT
- Exhibits238: X.NOV - Overview
- Exhibits239: X.NOV - Product / Service
- Exhibits240: X.NOV - Key offerings
- Exhibits241: SWOT
- Exhibits242: Zimmer Biomet Holdings Inc. - Overview
- Exhibits243: Zimmer Biomet Holdings Inc. - Business segments
- Exhibits244: Zimmer Biomet Holdings Inc. - Key news
- Exhibits245: Zimmer Biomet Holdings Inc. - Key offerings
- Exhibits246: Zimmer Biomet Holdings Inc. - Segment focus
- Exhibits247: SWOT
- Exhibits248: Inclusions checklist
- Exhibits249: Exclusions checklist
- Exhibits250: Currency conversion rates for US$
- Exhibits251: Research methodology
- Exhibits252: Information sources
- Exhibits253: Data validation
- Exhibits254: Validation techniques employed for market sizing
- Exhibits255: Data synthesis
- Exhibits256: 360 degree market analysis
- Exhibits257: List of abbreviations
The cementless total knee arthroplasty market is forecasted to grow by USD 5754.6 mn during 2024-2029, accelerating at a CAGR of 30.4% during the forecast period. The report on the cementless total knee arthroplasty market provides a holistic analysis, market size and forecast, trends, growth drivers, and challenges, as well as vendor analysis covering around 25 vendors.
The report offers an up-to-date analysis regarding the current market scenario, the latest trends and drivers, and the overall market environment. The market is driven by rising number of people diagnosed with arthritis, rise in number of sports injuries, and increasing government support to meet healthcare needs.
| Market Scope | |
|---|---|
| Base Year | 2025 |
| End Year | 2029 |
| Series Year | 2025-2029 |
| Growth Momentum | Accelerate |
| YOY 2025 | 25.1% |
| CAGR | 30.4% |
| Incremental Value | $5754.6 mn |
The study was conducted using an objective combination of primary and secondary information including inputs from key participants in the industry. The report contains a comprehensive market size data, segment with regional analysis and vendor landscape in addition to an analysis of the key companies. Reports have historic and forecast data.
Technavio's cementless total knee arthroplasty market is segmented as below:
By Product
- Fixed-bearing
- Mobile-bearing
By End-user
- Hospitals
- Orthopedic clinics
- Ambulatory surgical centers
By Material
- Alloy
- Ceramics
- Others
By Type
- Monoblock
- Modular
- Hybrid
By Geographical Landscape
- North America
- Europe
- Asia
- Rest of World (ROW)
This study identifies the increasing number of outpatient knee replacement surgeries as one of the prime reasons driving the cementless total knee arthroplasty market growth during the next few years. Also, increasing focus on robotic knee implantation surgeries and increasing demand for 3d-printed knee implants will lead to sizable demand in the market.
The report on the cementless total knee arthroplasty market covers the following areas:
- Cementless Total Knee Arthroplasty Market sizing
- Cementless Total Knee Arthroplasty Market forecast
- Cementless Total Knee Arthroplasty Market industry analysis
The robust vendor analysis is designed to help clients improve their market position, and in line with this, this report provides a detailed analysis of several leading cementless total knee arthroplasty market vendors that include Aesculap Implants Systems LLC, Allegra Orthopaedics Ltd., Beijing Chunlizhengda Medical Instruments Co. Ltd., Conformis Inc., Corin Group Plc, DJO Global Inc., Euromed Implants GmbH, Exactech Inc., GROUP FH ORTHO, Johnson and Johnson Services Inc., Mathys AG Bettlach, Medacta International SA, MicroPort Scientific Corp., Smith and Nephew plc, Stryker Corp., Symbios Orthopedie SA, United Orthopedic Corp., Waldemar Link GmbH and Co. KG, X.NOV, and Zimmer Biomet Holdings Inc.. Also, the cementless total knee arthroplasty market analysis report includes information on upcoming trends and challenges that will influence market growth. This is to help companies strategize and leverage all forthcoming growth opportunities.
The publisher presents a detailed picture of the market by the way of study, synthesis, and summation of data from multiple sources by an analysis of key parameters such as profit, pricing, competition, and promotions. It presents various market facets by identifying the key industry influencers. The data presented is comprehensive, reliable, and a result of extensive primary and secondary research. The market research reports provide a complete competitive landscape and an in-depth vendor selection methodology and analysis using qualitative and quantitative research to forecast accurate market growth.
Table of Contents
1 Executive Summary
- 1.1 Market overview
- Executive Summary - Chart on Market Overview
- Executive Summary - Data Table on Market Overview
- Executive Summary - Chart on Global Market Characteristics
- Executive Summary - Chart on Market By Geographical Landscape
- Executive Summary - Chart on Market Segmentation by Product
- Executive Summary - Chart on Market Segmentation by End-user
- Executive Summary - Chart on Market Segmentation by Material
- Executive Summary - Chart on Market Segmentation by Type
- Executive Summary - Chart on Incremental Growth
- Executive Summary - Data Table on Incremental Growth
- Executive Summary - Chart on Company Market Positioning
2 Technavio Analysis
- 2.1 Analysis of price sensitivity, lifecycle, customer purchase basket, adoption rates, and purchase criteria
- Analysis of price sensitivity, lifecycle, customer purchase basket, adoption rates, and purchase criteria
- 2.2 Criticality of inputs and Factors of differentiation
- Overview on criticality of inputs and factors of differentiation
- 2.3 Factors of disruption
- Overview on factors of disruption
- 2.4 Impact of drivers and challenges
- Impact of drivers and challenges in 2024 and 2029
3 Market Landscape
- 3.1 Market ecosystem
- Parent Market
- Data Table on - Parent Market
- 3.2 Market characteristics
- Market characteristics analysis
- 3.3 Value chain analysis
- Value chain analysis
4 Market Sizing
- 4.1 Market definition
- Offerings of companies included in the market definition
- 4.2 Market segment analysis
- Market segments
- 4.3 Market size 2024
- 4.4 Market outlook: Forecast for 2024-2029
- Chart on Global - Market size and forecast 2024-2029 ($ million)
- Data Table on Global - Market size and forecast 2024-2029 ($ million)
- Chart on Global Market: Year-over-year growth 2024-2029 (%)
- Data Table on Global Market: Year-over-year growth 2024-2029 (%)
5 Historic Market Size
- 5.1 Global Cementless Total Knee Arthroplasty Market 2019 - 2023
- Historic Market Size - Data Table on Global Cementless Total Knee Arthroplasty Market 2019 - 2023 ($ million)
- 5.2 Product segment analysis 2019 - 2023
- Historic Market Size - Product Segment 2019 - 2023 ($ million)
- 5.3 End-user segment analysis 2019 - 2023
- Historic Market Size - End-user Segment 2019 - 2023 ($ million)
- 5.4 Material segment analysis 2019 - 2023
- Historic Market Size - Material Segment 2019 - 2023 ($ million)
- 5.5 Type segment analysis 2019 - 2023
- Historic Market Size - Type Segment 2019 - 2023 ($ million)
- 5.6 Geography segment analysis 2019 - 2023
- Historic Market Size - Geography Segment 2019 - 2023 ($ million)
- 5.7 Country segment analysis 2019 - 2023
- Historic Market Size - Country Segment 2019 - 2023 ($ million)
6 Qualitative Analysis
- 6.1 Impact of AI on Global Cementless Total Knee Arthroplasty Market
7 Five Forces Analysis
- 7.1 Five forces summary
- Five forces analysis - Comparison between 2024 and 2029
- 7.2 Bargaining power of buyers
- Bargaining power of buyers - Impact of key factors 2024 and 2029
- 7.3 Bargaining power of suppliers
- Bargaining power of suppliers - Impact of key factors in 2024 and 2029
- 7.4 Threat of new entrants
- Threat of new entrants - Impact of key factors in 2024 and 2029
- 7.5 Threat of substitutes
- Threat of substitutes - Impact of key factors in 2024 and 2029
- 7.6 Threat of rivalry
- Threat of rivalry - Impact of key factors in 2024 and 2029
- 7.7 Market condition
- Chart on Market condition - Five forces 2024 and 2029
8 Market Segmentation by Product
- 8.1 Market segments
- Chart on Product - Market share 2024-2029 (%)
- Data Table on Product - Market share 2024-2029 (%)
- 8.2 Comparison by Product
- Chart on Comparison by Product
- Data Table on Comparison by Product
- 8.3 Fixed-bearing - Market size and forecast 2024-2029
- Chart on Fixed-bearing - Market size and forecast 2024-2029 ($ million)
- Data Table on Fixed-bearing - Market size and forecast 2024-2029 ($ million)
- Chart on Fixed-bearing - Year-over-year growth 2024-2029 (%)
- Data Table on Fixed-bearing - Year-over-year growth 2024-2029 (%)
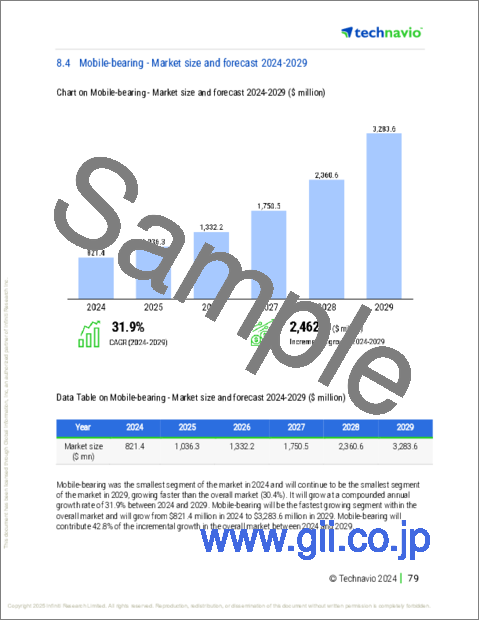
- 8.4 Mobile-bearing - Market size and forecast 2024-2029
- Chart on Mobile-bearing - Market size and forecast 2024-2029 ($ million)
- Data Table on Mobile-bearing - Market size and forecast 2024-2029 ($ million)
- Chart on Mobile-bearing - Year-over-year growth 2024-2029 (%)
- Data Table on Mobile-bearing - Year-over-year growth 2024-2029 (%)
- 8.5 Market opportunity by Product
- Market opportunity by Product ($ million)
- Data Table on Market opportunity by Product ($ million)
9 Market Segmentation by End-user
- 9.1 Market segments
- Chart on End-user - Market share 2024-2029 (%)
- Data Table on End-user - Market share 2024-2029 (%)
- 9.2 Comparison by End-user
- Chart on Comparison by End-user
- Data Table on Comparison by End-user
- 9.3 Hospitals - Market size and forecast 2024-2029
- Chart on Hospitals - Market size and forecast 2024-2029 ($ million)
- Data Table on Hospitals - Market size and forecast 2024-2029 ($ million)
- Chart on Hospitals - Year-over-year growth 2024-2029 (%)
- Data Table on Hospitals - Year-over-year growth 2024-2029 (%)
- 9.4 Orthopedic clinics - Market size and forecast 2024-2029
- Chart on Orthopedic clinics - Market size and forecast 2024-2029 ($ million)
- Data Table on Orthopedic clinics - Market size and forecast 2024-2029 ($ million)
- Chart on Orthopedic clinics - Year-over-year growth 2024-2029 (%)
- Data Table on Orthopedic clinics - Year-over-year growth 2024-2029 (%)
- 9.5 Ambulatory surgical centers - Market size and forecast 2024-2029
- Chart on Ambulatory surgical centers - Market size and forecast 2024-2029 ($ million)
- Data Table on Ambulatory surgical centers - Market size and forecast 2024-2029 ($ million)
- Chart on Ambulatory surgical centers - Year-over-year growth 2024-2029 (%)
- Data Table on Ambulatory surgical centers - Year-over-year growth 2024-2029 (%)
- 9.6 Market opportunity by End-user
- Market opportunity by End-user ($ million)
- Data Table on Market opportunity by End-user ($ million)
10 Market Segmentation by Material
- 10.1 Market segments
- Chart on Material - Market share 2024-2029 (%)
- Data Table on Material - Market share 2024-2029 (%)
- 10.2 Comparison by Material
- Chart on Comparison by Material
- Data Table on Comparison by Material
- 10.3 Alloy - Market size and forecast 2024-2029
- Chart on Alloy - Market size and forecast 2024-2029 ($ million)
- Data Table on Alloy - Market size and forecast 2024-2029 ($ million)
- Chart on Alloy - Year-over-year growth 2024-2029 (%)
- Data Table on Alloy - Year-over-year growth 2024-2029 (%)
- 10.4 Ceramics - Market size and forecast 2024-2029
- Chart on Ceramics - Market size and forecast 2024-2029 ($ million)
- Data Table on Ceramics - Market size and forecast 2024-2029 ($ million)
- Chart on Ceramics - Year-over-year growth 2024-2029 (%)
- Data Table on Ceramics - Year-over-year growth 2024-2029 (%)
- 10.5 Others - Market size and forecast 2024-2029
- Chart on Others - Market size and forecast 2024-2029 ($ million)
- Data Table on Others - Market size and forecast 2024-2029 ($ million)
- Chart on Others - Year-over-year growth 2024-2029 (%)
- Data Table on Others - Year-over-year growth 2024-2029 (%)
- 10.6 Market opportunity by Material
- Market opportunity by Material ($ million)
- Data Table on Market opportunity by Material ($ million)
11 Market Segmentation by Type
- 11.1 Market segments
- Chart on Type - Market share 2024-2029 (%)
- Data Table on Type - Market share 2024-2029 (%)
- 11.2 Comparison by Type
- Chart on Comparison by Type
- Data Table on Comparison by Type
- 11.3 Monoblock - Market size and forecast 2024-2029
- Chart on Monoblock - Market size and forecast 2024-2029 ($ million)
- Data Table on Monoblock - Market size and forecast 2024-2029 ($ million)
- Chart on Monoblock - Year-over-year growth 2024-2029 (%)
- Data Table on Monoblock - Year-over-year growth 2024-2029 (%)
- 11.4 Modular - Market size and forecast 2024-2029
- Chart on Modular - Market size and forecast 2024-2029 ($ million)
- Data Table on Modular - Market size and forecast 2024-2029 ($ million)
- Chart on Modular - Year-over-year growth 2024-2029 (%)
- Data Table on Modular - Year-over-year growth 2024-2029 (%)
- 11.5 Hybrid - Market size and forecast 2024-2029
- Chart on Hybrid - Market size and forecast 2024-2029 ($ million)
- Data Table on Hybrid - Market size and forecast 2024-2029 ($ million)
- Chart on Hybrid - Year-over-year growth 2024-2029 (%)
- Data Table on Hybrid - Year-over-year growth 2024-2029 (%)
- 11.6 Market opportunity by Type
- Market opportunity by Type ($ million)
- Data Table on Market opportunity by Type ($ million)
12 Customer Landscape
- 12.1 Customer landscape overview
- Analysis of price sensitivity, lifecycle, customer purchase basket, adoption rates, and purchase criteria
13 Geographic Landscape
- 13.1 Geographic segmentation
- Chart on Market share By Geographical Landscape 2024-2029 (%)
- Data Table on Market share By Geographical Landscape 2024-2029 (%)
- 13.2 Geographic comparison
- Chart on Geographic comparison
- Data Table on Geographic comparison
- 13.3 North America - Market size and forecast 2024-2029
- Chart on North America - Market size and forecast 2024-2029 ($ million)
- Data Table on North America - Market size and forecast 2024-2029 ($ million)
- Chart on North America - Year-over-year growth 2024-2029 (%)
- Data Table on North America - Year-over-year growth 2024-2029 (%)
- 13.4 Europe - Market size and forecast 2024-2029
- Chart on Europe - Market size and forecast 2024-2029 ($ million)
- Data Table on Europe - Market size and forecast 2024-2029 ($ million)
- Chart on Europe - Year-over-year growth 2024-2029 (%)
- Data Table on Europe - Year-over-year growth 2024-2029 (%)
- 13.5 Asia - Market size and forecast 2024-2029
- Chart on Asia - Market size and forecast 2024-2029 ($ million)
- Data Table on Asia - Market size and forecast 2024-2029 ($ million)
- Chart on Asia - Year-over-year growth 2024-2029 (%)
- Data Table on Asia - Year-over-year growth 2024-2029 (%)
- 13.6 Rest of World (ROW) - Market size and forecast 2024-2029
- Chart on Rest of World (ROW) - Market size and forecast 2024-2029 ($ million)
- Data Table on Rest of World (ROW) - Market size and forecast 2024-2029 ($ million)
- Chart on Rest of World (ROW) - Year-over-year growth 2024-2029 (%)
- Data Table on Rest of World (ROW) - Year-over-year growth 2024-2029 (%)
- 13.7 US - Market size and forecast 2024-2029
- Chart on US - Market size and forecast 2024-2029 ($ million)
- Data Table on US - Market size and forecast 2024-2029 ($ million)
- Chart on US - Year-over-year growth 2024-2029 (%)
- Data Table on US - Year-over-year growth 2024-2029 (%)
- 13.8 Germany - Market size and forecast 2024-2029
- Chart on Germany - Market size and forecast 2024-2029 ($ million)
- Data Table on Germany - Market size and forecast 2024-2029 ($ million)
- Chart on Germany - Year-over-year growth 2024-2029 (%)
- Data Table on Germany - Year-over-year growth 2024-2029 (%)
- 13.9 Canada - Market size and forecast 2024-2029
- Chart on Canada - Market size and forecast 2024-2029 ($ million)
- Data Table on Canada - Market size and forecast 2024-2029 ($ million)
- Chart on Canada - Year-over-year growth 2024-2029 (%)
- Data Table on Canada - Year-over-year growth 2024-2029 (%)
- 13.10 China - Market size and forecast 2024-2029
- Chart on China - Market size and forecast 2024-2029 ($ million)
- Data Table on China - Market size and forecast 2024-2029 ($ million)
- Chart on China - Year-over-year growth 2024-2029 (%)
- Data Table on China - Year-over-year growth 2024-2029 (%)
- 13.11 UK - Market size and forecast 2024-2029
- Chart on UK - Market size and forecast 2024-2029 ($ million)
- Data Table on UK - Market size and forecast 2024-2029 ($ million)
- Chart on UK - Year-over-year growth 2024-2029 (%)
- Data Table on UK - Year-over-year growth 2024-2029 (%)
- 13.12 France - Market size and forecast 2024-2029
- Chart on France - Market size and forecast 2024-2029 ($ million)
- Data Table on France - Market size and forecast 2024-2029 ($ million)
- Chart on France - Year-over-year growth 2024-2029 (%)
- Data Table on France - Year-over-year growth 2024-2029 (%)
- 13.13 Japan - Market size and forecast 2024-2029
- Chart on Japan - Market size and forecast 2024-2029 ($ million)
- Data Table on Japan - Market size and forecast 2024-2029 ($ million)
- Chart on Japan - Year-over-year growth 2024-2029 (%)
- Data Table on Japan - Year-over-year growth 2024-2029 (%)
- 13.14 Italy - Market size and forecast 2024-2029
- Chart on Italy - Market size and forecast 2024-2029 ($ million)
- Data Table on Italy - Market size and forecast 2024-2029 ($ million)
- Chart on Italy - Year-over-year growth 2024-2029 (%)
- Data Table on Italy - Year-over-year growth 2024-2029 (%)
- 13.15 India - Market size and forecast 2024-2029
- Chart on India - Market size and forecast 2024-2029 ($ million)
- Data Table on India - Market size and forecast 2024-2029 ($ million)
- Chart on India - Year-over-year growth 2024-2029 (%)
- Data Table on India - Year-over-year growth 2024-2029 (%)
- 13.16 Spain - Market size and forecast 2024-2029
- Chart on Spain - Market size and forecast 2024-2029 ($ million)
- Data Table on Spain - Market size and forecast 2024-2029 ($ million)
- Chart on Spain - Year-over-year growth 2024-2029 (%)
- Data Table on Spain - Year-over-year growth 2024-2029 (%)
- 13.17 Market opportunity By Geographical Landscape
- Market opportunity By Geographical Landscape ($ million)
- Data Tables on Market opportunity By Geographical Landscape ($ million)
14 Drivers, Challenges, and Opportunity/Restraints
- 14.1 Market drivers
- 14.2 Market challenges
- 14.3 Impact of drivers and challenges
- Impact of drivers and challenges in 2024 and 2029
- 14.4 Market opportunities/restraints
15 Competitive Landscape
- 15.1 Overview
- 15.2 Competitive Landscape
- Overview on criticality of inputs and factors of differentiation
- 15.3 Landscape disruption
- Overview on factors of disruption
- 15.4 Industry risks
- Impact of key risks on business
16 Competitive Analysis
- 16.1 Companies profiled
- Companies covered
- 16.2 Company ranking index
- Company ranking index
- 16.3 Market positioning of companies
- Matrix on companies position and classification
- 16.4 Conformis Inc.
- Conformis Inc. - Overview
- Conformis Inc. - Product / Service
- Conformis Inc. - Key offerings
- SWOT
- 16.5 Corin Group Plc
- Corin Group Plc - Overview
- Corin Group Plc - Product / Service
- Corin Group Plc - Key offerings
- SWOT
- 16.6 DJO Global Inc.
- DJO Global Inc. - Overview
- DJO Global Inc. - Product / Service
- DJO Global Inc. - Key offerings
- SWOT
- 16.7 Euromed Implants GmbH
- Euromed Implants GmbH - Overview
- Euromed Implants GmbH - Product / Service
- Euromed Implants GmbH - Key offerings
- SWOT
- 16.8 Exactech Inc.
- Exactech Inc. - Overview
- Exactech Inc. - Product / Service
- Exactech Inc. - Key offerings
- SWOT
- 16.9 GROUP FH ORTHO
- GROUP FH ORTHO - Overview
- GROUP FH ORTHO - Product / Service
- GROUP FH ORTHO - Key offerings
- SWOT
- 16.10 Johnson and Johnson Services Inc.
- Johnson and Johnson Services Inc. - Overview
- Johnson and Johnson Services Inc. - Business segments
- Johnson and Johnson Services Inc. - Key news
- Johnson and Johnson Services Inc. - Key offerings
- Johnson and Johnson Services Inc. - Segment focus
- SWOT
- 16.11 Mathys AG Bettlach
- Mathys AG Bettlach - Overview
- Mathys AG Bettlach - Product / Service
- Mathys AG Bettlach - Key offerings
- SWOT
- 16.12 MicroPort Scientific Corp.
- MicroPort Scientific Corp. - Overview
- MicroPort Scientific Corp. - Business segments
- MicroPort Scientific Corp. - Key news
- MicroPort Scientific Corp. - Key offerings
- MicroPort Scientific Corp. - Segment focus
- SWOT
- 16.13 Smith and Nephew plc
- Smith and Nephew plc - Overview
- Smith and Nephew plc - Business segments
- Smith and Nephew plc - Key news
- Smith and Nephew plc - Key offerings
- Smith and Nephew plc - Segment focus
- SWOT
- 16.14 Stryker Corp.
- Stryker Corp. - Overview
- Stryker Corp. - Business segments
- Stryker Corp. - Key news
- Stryker Corp. - Key offerings
- Stryker Corp. - Segment focus
- SWOT
- 16.15 United Orthopedic Corp.
- United Orthopedic Corp. - Overview
- United Orthopedic Corp. - Product / Service
- United Orthopedic Corp. - Key offerings
- SWOT
- 16.16 Waldemar Link GmbH and Co. KG
- Waldemar Link GmbH and Co. KG - Overview
- Waldemar Link GmbH and Co. KG - Product / Service
- Waldemar Link GmbH and Co. KG - Key offerings
- SWOT
- 16.17 X.NOV
- X.NOV - Overview
- X.NOV - Product / Service
- X.NOV - Key offerings
- SWOT
- 16.18 Zimmer Biomet Holdings Inc.
- Zimmer Biomet Holdings Inc. - Overview
- Zimmer Biomet Holdings Inc. - Business segments
- Zimmer Biomet Holdings Inc. - Key news
- Zimmer Biomet Holdings Inc. - Key offerings
- Zimmer Biomet Holdings Inc. - Segment focus
- SWOT
17 Appendix
- 17.1 Scope of the report
- 17.2 Inclusions and exclusions checklist
- Inclusions checklist
- Exclusions checklist
- 17.3 Currency conversion rates for US$
- Currency conversion rates for US$
- 17.4 Research methodology
- Research methodology
- 17.5 Data procurement
- Information sources
- 17.6 Data validation
- Data validation
- 17.7 Validation techniques employed for market sizing
- Validation techniques employed for market sizing
- 17.8 Data synthesis
- Data synthesis
- 17.9 360 degree market analysis
- 360 degree market analysis
- 17.10 List of abbreviations
- List of abbreviations

