|
|
市場調査レポート
商品コード
1645617
ヘルスケアのビジネスプロセスアウトソーシング(BPO)の世界市場 2025~2029年Global Healthcare Business Process Outsourcing (BPO) Market 2025-2029 |
||||||

|
|||||||
カスタマイズ可能
|
|||||||


| ヘルスケアのビジネスプロセスアウトソーシング(BPO)の世界市場 2025~2029年 |
|
出版日: 2025年01月18日
発行: TechNavio
ページ情報: 英文 209 Pages
納期: 即納可能
|

全表示
- 概要
- 図表
- 目次
ヘルスケアのビジネスプロセスアウトソーシング(BPO)市場は2024~2029年に183億2,040万米ドル、予測期間中のCAGRは10.6%で成長すると予測されます。
当レポートでは、ヘルスケアのビジネスプロセスアウトソーシング(BPO)市場の全体的な分析、市場規模・予測、動向、成長促進要因、課題、約25のベンダーを網羅したベンダー分析などを掲載しています。
現在の市場シナリオ、最新動向と促進要因、市場環境全体に関する最新分析を提供しています。市場は、運用コスト削減への注力、BPO数の急増、熟練専門家の存在などが牽引しています。
| 市場範囲 | |
|---|---|
| 基準年 | 2025年 |
| 終了年 | 2029年 |
| 予測期間 | 2025~2029年 |
| 成長モメンタム | 加速 |
| 前年比[2025年] | 9.8% |
| CAGR | 10.6% |
| 増分額 | 183億2,040万米ドル |
本調査では、クラウドコンピューティングサービスの台頭が、今後数年間のヘルスケアのビジネスプロセスアウトソーシング(BPO)市場の成長を牽引する主要因の1つであると分析しています。また、プロセス自動化重視の高まりや、ヘルスケア領域の拡大・成長は、市場の大きな需要につながります。
目次
第1章 エグゼクティブサマリー
- 市場概要
第2章 Technavio分析
- 価格・ライフサイクル・顧客購入バスケット・採用率・購入基準の分析
- インプットの重要性と差別化の要因
- 混乱の要因
- 促進要因と課題の影響
第3章 市場情勢
- 市場エコシステム
- 市場の特徴
- バリューチェーン分析
第4章 市場規模
- 市場の定義
- 市場セグメント分析
- 市場規模 2024年
- 市場の展望 2024~2029年
第5章 市場規模実績
- ヘルスケアのビジネスプロセスアウトソーシング(BPO)の世界市場 2019~2023年
- ソリューションセグメント分析 2019~2023年
- サービス別セグメント分析 2019~2023年
- 地域別セグメント分析 2019~2023年
- 国別セグメント分析 2019~2023年
第6章 定性分析
- AIの影響:ヘルスケアのビジネスプロセスアウトソーシング(BPO)の世界市場
第7章 ファイブフォース分析
- ファイブフォースの要約
- 買い手の交渉力
- 供給企業の交渉力
- 新規参入業者の脅威
- 代替品の脅威
- 競争の脅威
- 市況
第8章 市場セグメンテーション:ソリューション別
- 市場セグメント
- 比較:ソリューション別
- RCM:市場規模と予測 2024~2029年
- 患者ケアサービス:市場規模と予測 2024~2029年
- 患者登録と戦略計画:市場規模と予測 2024~2029年
- 市場機会:ソリューション別
第9章 市場セグメンテーション:サービス別
- 市場セグメント
- 比較:サービス別
- 製造業:市場規模と予測 2024~2029年
- 研究開発:市場規模と予測 2024~2029年
- 非臨床サービス:市場規模と予測 2024~2029年
- 市場機会:サービス別
第10章 顧客情勢
- 顧客情勢概要
第11章 地域別情勢
- 地域別セグメンテーション
- 比較:地域別
- 北米:市場規模と予測 2024~2029年
- アジア太平洋:市場規模と予測 2024~2029年
- 欧州:市場規模と予測 2024~2029年
- 中東・アフリカ:市場規模と予測 2024~2029年
- 南米:市場規模と予測 2024~2029年
- 米国:市場規模と予測 2024~2029年
- カナダ:市場規模と予測 2024~2029年
- 中国:市場規模と予測 2024~2029年
- 英国:市場規模と予測 2024~2029年
- メキシコ:市場規模と予測 2024~2029年
- ドイツ:市場規模と予測 2024~2029年
- インド:市場規模と予測 2024~2029年
- フィリピン:市場規模と予測 2024~2029年
- ブラジル:市場規模と予測 2024~2029年
- フランス:市場規模と予測 2024~2029年
- 地域情勢による市場機会
第12章 促進要因・課題・機会・抑制要因
- 市場促進要因
- 市場課題
- 促進要因と課題の影響
- 市場機会・抑制要因
第13章 競合情勢
- 概要
- 競合情勢
- 混乱の状況
- 産業のリスク
第14章 競合分析
- 企業プロファイル
- 企業ランキング指数
- 企業の市場ポジショニング
- Accenture PLC
- Cognizant Technology Solutions Corp.
- GeBBS Healthcare Solutions Inc.
- Genpact Ltd.
- HCL Technologies Ltd.
- Infosys Ltd.
- International Business Machines Corp.
- Invensis Technologies Pvt. Ltd.
- IQVIA Holdings Inc.
- OMH HealthEdge Holdings LLC
- R1 RCM Inc.
- Sutherland Global Services Inc.
- Tata Consultancy Services Ltd.
- Wipro Ltd.
- WNS Holdings Ltd.
第15章 付録
Exhibits:
- Exhibits1: Executive Summary - Chart on Market Overview
- Exhibits2: Executive Summary - Data Table on Market Overview
- Exhibits3: Executive Summary - Chart on Global Market Characteristics
- Exhibits4: Executive Summary - Chart on Market By Geographical Landscape
- Exhibits5: Executive Summary - Chart on Market Segmentation by Solution
- Exhibits6: Executive Summary - Chart on Market Segmentation by Service
- Exhibits7: Executive Summary - Chart on Incremental Growth
- Exhibits8: Executive Summary - Data Table on Incremental Growth
- Exhibits9: Executive Summary - Chart on Company Market Positioning
- Exhibits10: Analysis of price sensitivity, lifecycle, customer purchase basket, adoption rates, and purchase criteria
- Exhibits11: Overview on criticality of inputs and factors of differentiation
- Exhibits12: Overview on factors of disruption
- Exhibits13: Impact of drivers and challenges in 2024 and 2029
- Exhibits14: Parent Market
- Exhibits15: Data Table on - Parent Market
- Exhibits16: Market characteristics analysis
- Exhibits17: Value chain analysis
- Exhibits18: Offerings of companies included in the market definition
- Exhibits19: Market segments
- Exhibits20: Chart on Global - Market size and forecast 2024-2029 ($ million)
- Exhibits21: Data Table on Global - Market size and forecast 2024-2029 ($ million)
- Exhibits22: Chart on Global Market: Year-over-year growth 2024-2029 (%)
- Exhibits23: Data Table on Global Market: Year-over-year growth 2024-2029 (%)
- Exhibits24: Historic Market Size - Data Table on Global Healthcare Business Process Outsourcing (BPO) Market 2019 - 2023 ($ million)
- Exhibits25: Historic Market Size - Solution Segment 2019 - 2023 ($ million)
- Exhibits26: Historic Market Size - Service Segment 2019 - 2023 ($ million)
- Exhibits27: Historic Market Size - Geography Segment 2019 - 2023 ($ million)
- Exhibits28: Historic Market Size - Country Segment 2019 - 2023 ($ million)
- Exhibits29: Five forces analysis - Comparison between 2024 and 2029
- Exhibits30: Bargaining power of buyers - Impact of key factors 2024 and 2029
- Exhibits31: Bargaining power of suppliers - Impact of key factors in 2024 and 2029
- Exhibits32: Threat of new entrants - Impact of key factors in 2024 and 2029
- Exhibits33: Threat of substitutes - Impact of key factors in 2024 and 2029
- Exhibits34: Threat of rivalry - Impact of key factors in 2024 and 2029
- Exhibits35: Chart on Market condition - Five forces 2024 and 2029
- Exhibits36: Chart on Solution - Market share 2024-2029 (%)
- Exhibits37: Data Table on Solution - Market share 2024-2029 (%)
- Exhibits38: Chart on Comparison by Solution
- Exhibits39: Data Table on Comparison by Solution
- Exhibits40: Chart on RCM - Market size and forecast 2024-2029 ($ million)
- Exhibits41: Data Table on RCM - Market size and forecast 2024-2029 ($ million)
- Exhibits42: Chart on RCM - Year-over-year growth 2024-2029 (%)
- Exhibits43: Data Table on RCM - Year-over-year growth 2024-2029 (%)
- Exhibits44: Chart on Patient care services - Market size and forecast 2024-2029 ($ million)
- Exhibits45: Data Table on Patient care services - Market size and forecast 2024-2029 ($ million)
- Exhibits46: Chart on Patient care services - Year-over-year growth 2024-2029 (%)
- Exhibits47: Data Table on Patient care services - Year-over-year growth 2024-2029 (%)
- Exhibits48: Chart on Patient enrollment and strategic planning - Market size and forecast 2024-2029 ($ million)
- Exhibits49: Data Table on Patient enrollment and strategic planning - Market size and forecast 2024-2029 ($ million)
- Exhibits50: Chart on Patient enrollment and strategic planning - Year-over-year growth 2024-2029 (%)
- Exhibits51: Data Table on Patient enrollment and strategic planning - Year-over-year growth 2024-2029 (%)
- Exhibits52: Market opportunity by Solution ($ million)
- Exhibits53: Data Table on Market opportunity by Solution ($ million)
- Exhibits54: Chart on Service - Market share 2024-2029 (%)
- Exhibits55: Data Table on Service - Market share 2024-2029 (%)
- Exhibits56: Chart on Comparison by Service
- Exhibits57: Data Table on Comparison by Service
- Exhibits58: Chart on Manufacturing - Market size and forecast 2024-2029 ($ million)
- Exhibits59: Data Table on Manufacturing - Market size and forecast 2024-2029 ($ million)
- Exhibits60: Chart on Manufacturing - Year-over-year growth 2024-2029 (%)
- Exhibits61: Data Table on Manufacturing - Year-over-year growth 2024-2029 (%)
- Exhibits62: Chart on Research and development - Market size and forecast 2024-2029 ($ million)
- Exhibits63: Data Table on Research and development - Market size and forecast 2024-2029 ($ million)
- Exhibits64: Chart on Research and development - Year-over-year growth 2024-2029 (%)
- Exhibits65: Data Table on Research and development - Year-over-year growth 2024-2029 (%)
- Exhibits66: Chart on Non-clinical services - Market size and forecast 2024-2029 ($ million)
- Exhibits67: Data Table on Non-clinical services - Market size and forecast 2024-2029 ($ million)
- Exhibits68: Chart on Non-clinical services - Year-over-year growth 2024-2029 (%)
- Exhibits69: Data Table on Non-clinical services - Year-over-year growth 2024-2029 (%)
- Exhibits70: Market opportunity by Service ($ million)
- Exhibits71: Data Table on Market opportunity by Service ($ million)
- Exhibits72: Analysis of price sensitivity, lifecycle, customer purchase basket, adoption rates, and purchase criteria
- Exhibits73: Chart on Market share By Geographical Landscape 2024-2029 (%)
- Exhibits74: Data Table on Market share By Geographical Landscape 2024-2029 (%)
- Exhibits75: Chart on Geographic comparison
- Exhibits76: Data Table on Geographic comparison
- Exhibits77: Chart on North America - Market size and forecast 2024-2029 ($ million)
- Exhibits78: Data Table on North America - Market size and forecast 2024-2029 ($ million)
- Exhibits79: Chart on North America - Year-over-year growth 2024-2029 (%)
- Exhibits80: Data Table on North America - Year-over-year growth 2024-2029 (%)
- Exhibits81: Chart on APAC - Market size and forecast 2024-2029 ($ million)
- Exhibits82: Data Table on APAC - Market size and forecast 2024-2029 ($ million)
- Exhibits83: Chart on APAC - Year-over-year growth 2024-2029 (%)
- Exhibits84: Data Table on APAC - Year-over-year growth 2024-2029 (%)
- Exhibits85: Chart on Europe - Market size and forecast 2024-2029 ($ million)
- Exhibits86: Data Table on Europe - Market size and forecast 2024-2029 ($ million)
- Exhibits87: Chart on Europe - Year-over-year growth 2024-2029 (%)
- Exhibits88: Data Table on Europe - Year-over-year growth 2024-2029 (%)
- Exhibits89: Chart on Middle East and Africa - Market size and forecast 2024-2029 ($ million)
- Exhibits90: Data Table on Middle East and Africa - Market size and forecast 2024-2029 ($ million)
- Exhibits91: Chart on Middle East and Africa - Year-over-year growth 2024-2029 (%)
- Exhibits92: Data Table on Middle East and Africa - Year-over-year growth 2024-2029 (%)
- Exhibits93: Chart on South America - Market size and forecast 2024-2029 ($ million)
- Exhibits94: Data Table on South America - Market size and forecast 2024-2029 ($ million)
- Exhibits95: Chart on South America - Year-over-year growth 2024-2029 (%)
- Exhibits96: Data Table on South America - Year-over-year growth 2024-2029 (%)
- Exhibits97: Chart on US - Market size and forecast 2024-2029 ($ million)
- Exhibits98: Data Table on US - Market size and forecast 2024-2029 ($ million)
- Exhibits99: Chart on US - Year-over-year growth 2024-2029 (%)
- Exhibits100: Data Table on US - Year-over-year growth 2024-2029 (%)
- Exhibits101: Chart on Canada - Market size and forecast 2024-2029 ($ million)
- Exhibits102: Data Table on Canada - Market size and forecast 2024-2029 ($ million)
- Exhibits103: Chart on Canada - Year-over-year growth 2024-2029 (%)
- Exhibits104: Data Table on Canada - Year-over-year growth 2024-2029 (%)
- Exhibits105: Chart on China - Market size and forecast 2024-2029 ($ million)
- Exhibits106: Data Table on China - Market size and forecast 2024-2029 ($ million)
- Exhibits107: Chart on China - Year-over-year growth 2024-2029 (%)
- Exhibits108: Data Table on China - Year-over-year growth 2024-2029 (%)
- Exhibits109: Chart on UK - Market size and forecast 2024-2029 ($ million)
- Exhibits110: Data Table on UK - Market size and forecast 2024-2029 ($ million)
- Exhibits111: Chart on UK - Year-over-year growth 2024-2029 (%)
- Exhibits112: Data Table on UK - Year-over-year growth 2024-2029 (%)
- Exhibits113: Chart on Mexico - Market size and forecast 2024-2029 ($ million)
- Exhibits114: Data Table on Mexico - Market size and forecast 2024-2029 ($ million)
- Exhibits115: Chart on Mexico - Year-over-year growth 2024-2029 (%)
- Exhibits116: Data Table on Mexico - Year-over-year growth 2024-2029 (%)
- Exhibits117: Chart on Germany - Market size and forecast 2024-2029 ($ million)
- Exhibits118: Data Table on Germany - Market size and forecast 2024-2029 ($ million)
- Exhibits119: Chart on Germany - Year-over-year growth 2024-2029 (%)
- Exhibits120: Data Table on Germany - Year-over-year growth 2024-2029 (%)
- Exhibits121: Chart on India - Market size and forecast 2024-2029 ($ million)
- Exhibits122: Data Table on India - Market size and forecast 2024-2029 ($ million)
- Exhibits123: Chart on India - Year-over-year growth 2024-2029 (%)
- Exhibits124: Data Table on India - Year-over-year growth 2024-2029 (%)
- Exhibits125: Chart on Philippines - Market size and forecast 2024-2029 ($ million)
- Exhibits126: Data Table on Philippines - Market size and forecast 2024-2029 ($ million)
- Exhibits127: Chart on Philippines - Year-over-year growth 2024-2029 (%)
- Exhibits128: Data Table on Philippines - Year-over-year growth 2024-2029 (%)
- Exhibits129: Chart on Brazil - Market size and forecast 2024-2029 ($ million)
- Exhibits130: Data Table on Brazil - Market size and forecast 2024-2029 ($ million)
- Exhibits131: Chart on Brazil - Year-over-year growth 2024-2029 (%)
- Exhibits132: Data Table on Brazil - Year-over-year growth 2024-2029 (%)
- Exhibits133: Chart on France - Market size and forecast 2024-2029 ($ million)
- Exhibits134: Data Table on France - Market size and forecast 2024-2029 ($ million)
- Exhibits135: Chart on France - Year-over-year growth 2024-2029 (%)
- Exhibits136: Data Table on France - Year-over-year growth 2024-2029 (%)
- Exhibits137: Market opportunity By Geographical Landscape ($ million)
- Exhibits138: Data Tables on Market opportunity By Geographical Landscape ($ million)
- Exhibits139: Impact of drivers and challenges in 2024 and 2029
- Exhibits140: Overview on criticality of inputs and factors of differentiation
- Exhibits141: Overview on factors of disruption
- Exhibits142: Impact of key risks on business
- Exhibits143: Companies covered
- Exhibits144: Company ranking index
- Exhibits145: Matrix on companies position and classification
- Exhibits146: Accenture PLC - Overview
- Exhibits147: Accenture PLC - Business segments
- Exhibits148: Accenture PLC - Key news
- Exhibits149: Accenture PLC - Key offerings
- Exhibits150: Accenture PLC - Segment focus
- Exhibits151: SWOT
- Exhibits152: Cognizant Technology Solutions Corp. - Overview
- Exhibits153: Cognizant Technology Solutions Corp. - Business segments
- Exhibits154: Cognizant Technology Solutions Corp. - Key news
- Exhibits155: Cognizant Technology Solutions Corp. - Key offerings
- Exhibits156: Cognizant Technology Solutions Corp. - Segment focus
- Exhibits157: SWOT
- Exhibits158: GeBBS Healthcare Solutions Inc. - Overview
- Exhibits159: GeBBS Healthcare Solutions Inc. - Product / Service
- Exhibits160: GeBBS Healthcare Solutions Inc. - Key offerings
- Exhibits161: SWOT
- Exhibits162: Genpact Ltd. - Overview
- Exhibits163: Genpact Ltd. - Business segments
- Exhibits164: Genpact Ltd. - Key news
- Exhibits165: Genpact Ltd. - Key offerings
- Exhibits166: Genpact Ltd. - Segment focus
- Exhibits167: SWOT
- Exhibits168: HCL Technologies Ltd. - Overview
- Exhibits169: HCL Technologies Ltd. - Business segments
- Exhibits170: HCL Technologies Ltd. - Key news
- Exhibits171: HCL Technologies Ltd. - Key offerings
- Exhibits172: HCL Technologies Ltd. - Segment focus
- Exhibits173: SWOT
- Exhibits174: Infosys Ltd. - Overview
- Exhibits175: Infosys Ltd. - Business segments
- Exhibits176: Infosys Ltd. - Key news
- Exhibits177: Infosys Ltd. - Key offerings
- Exhibits178: Infosys Ltd. - Segment focus
- Exhibits179: SWOT
- Exhibits180: International Business Machines Corp. - Overview
- Exhibits181: International Business Machines Corp. - Business segments
- Exhibits182: International Business Machines Corp. - Key news
- Exhibits183: International Business Machines Corp. - Key offerings
- Exhibits184: International Business Machines Corp. - Segment focus
- Exhibits185: SWOT
- Exhibits186: Invensis Technologies Pvt. Ltd. - Overview
- Exhibits187: Invensis Technologies Pvt. Ltd. - Product / Service
- Exhibits188: Invensis Technologies Pvt. Ltd. - Key offerings
- Exhibits189: SWOT
- Exhibits190: IQVIA Holdings Inc. - Overview
- Exhibits191: IQVIA Holdings Inc. - Business segments
- Exhibits192: IQVIA Holdings Inc. - Key news
- Exhibits193: IQVIA Holdings Inc. - Key offerings
- Exhibits194: IQVIA Holdings Inc. - Segment focus
- Exhibits195: SWOT
- Exhibits196: OMH HealthEdge Holdings LLC - Overview
- Exhibits197: OMH HealthEdge Holdings LLC - Product / Service
- Exhibits198: OMH HealthEdge Holdings LLC - Key offerings
- Exhibits199: SWOT
- Exhibits200: R1 RCM Inc. - Overview
- Exhibits201: R1 RCM Inc. - Product / Service
- Exhibits202: R1 RCM Inc. - Key offerings
- Exhibits203: SWOT
- Exhibits204: Sutherland Global Services Inc. - Overview
- Exhibits205: Sutherland Global Services Inc. - Product / Service
- Exhibits206: Sutherland Global Services Inc. - Key offerings
- Exhibits207: SWOT
- Exhibits208: Tata Consultancy Services Ltd. - Overview
- Exhibits209: Tata Consultancy Services Ltd. - Business segments
- Exhibits210: Tata Consultancy Services Ltd. - Key news
- Exhibits211: Tata Consultancy Services Ltd. - Key offerings
- Exhibits212: Tata Consultancy Services Ltd. - Segment focus
- Exhibits213: SWOT
- Exhibits214: Wipro Ltd. - Overview
- Exhibits215: Wipro Ltd. - Business segments
- Exhibits216: Wipro Ltd. - Key news
- Exhibits217: Wipro Ltd. - Key offerings
- Exhibits218: Wipro Ltd. - Segment focus
- Exhibits219: SWOT
- Exhibits220: WNS Holdings Ltd. - Overview
- Exhibits221: WNS Holdings Ltd. - Business segments
- Exhibits222: WNS Holdings Ltd. - Key news
- Exhibits223: WNS Holdings Ltd. - Key offerings
- Exhibits224: WNS Holdings Ltd. - Segment focus
- Exhibits225: SWOT
- Exhibits226: Inclusions checklist
- Exhibits227: Exclusions checklist
- Exhibits228: Currency conversion rates for US$
- Exhibits229: Research methodology
- Exhibits230: Information sources
- Exhibits231: Data validation
- Exhibits232: Validation techniques employed for market sizing
- Exhibits233: Data synthesis
- Exhibits234: 360 degree market analysis
- Exhibits235: List of abbreviations
The healthcare business process outsourcing (BPO) market is forecasted to grow by USD 18320.4 mn during 2024-2029, accelerating at a CAGR of 10.6% during the forecast period. The report on the healthcare business process outsourcing (BPO) market provides a holistic analysis, market size and forecast, trends, growth drivers, and challenges, as well as vendor analysis covering around 25 vendors.
The report offers an up-to-date analysis regarding the current market scenario, the latest trends and drivers, and the overall market environment. The market is driven by focus on reducing operational costs, surging number of bpos, and presence of skilled professionals.
| Market Scope | |
|---|---|
| Base Year | 2025 |
| End Year | 2029 |
| Series Year | 2025-2029 |
| Growth Momentum | Accelerate |
| YOY 2025 | 9.8% |
| CAGR | 10.6% |
| Incremental Value | $18320.4 mn |
Technavio's healthcare business process outsourcing (BPO) market is segmented as below:
By Solution
- Manufacturing
- Research and development
- Non-clinical services
By Service
- Revenue cycle management
- Patient care services
- Patient enrollment and strategic planning
By Geographical Landscape
- North America
- APAC
- Europe
- Middle East and Africa
- South America
This study identifies the emergence of cloud-computing services as one of the prime reasons driving the healthcare business process outsourcing (BPO) market growth during the next few years. Also, rising emphasis on process automation and expansion and growth of several healthcare domains will lead to sizable demand in the market.
The report on the healthcare business process outsourcing (BPO) market covers the following areas:
- Healthcare Business Process Outsourcing (BPO) Market sizing
- Healthcare Business Process Outsourcing (BPO) Market forecast
- Healthcare Business Process Outsourcing (BPO) Market industry analysis
The robust vendor analysis is designed to help clients improve their market position, and in line with this, this report provides a detailed analysis of several leading healthcare business process outsourcing (BPO) market vendors that include Accenture PLC, Cognizant Technology Solutions Corp., DATAMARK Inc., Foundever Group, GeBBS Healthcare Solutions Inc., Genpact Ltd., HCL Technologies Ltd., Infosys Ltd., International Business Machines Corp., Invensis Technologies Pvt. Ltd., IQVIA Holdings Inc., Maxicus Inc., OMH HealthEdge Holdings LLC, Parexel International Corp., R1 RCM Inc., Sutherland Global Services Inc., Tata Consultancy Services Ltd., United Health Group Inc., Wipro Ltd., and WNS Holdings Ltd.. Also, the healthcare business process outsourcing (BPO) market analysis report includes information on upcoming trends and challenges that will influence market growth. This is to help companies strategize and leverage all forthcoming growth opportunities.
The study was conducted using an objective combination of primary and secondary information including inputs from key participants in the industry. The report contains a comprehensive market and vendor landscape in addition to an analysis of the key vendors.
The publisher presents a detailed picture of the market by the way of study, synthesis, and summation of data from multiple sources by an analysis of key parameters such as profit, pricing, competition, and promotions. It presents various market facets by identifying the key industry influencers. The data presented is comprehensive, reliable, and a result of extensive primary and secondary research. The market research reports provide a complete competitive landscape and an in-depth vendor selection methodology and analysis using qualitative and quantitative research to forecast accurate market growth.
Table of Contents
1 Executive Summary
- 1.1 Market overview
- Executive Summary - Chart on Market Overview
- Executive Summary - Data Table on Market Overview
- Executive Summary - Chart on Global Market Characteristics
- Executive Summary - Chart on Market By Geographical Landscape
- Executive Summary - Chart on Market Segmentation by Solution
- Executive Summary - Chart on Market Segmentation by Service
- Executive Summary - Chart on Incremental Growth
- Executive Summary - Data Table on Incremental Growth
- Executive Summary - Chart on Company Market Positioning
2 Technavio Analysis
- 2.1 Analysis of price sensitivity, lifecycle, customer purchase basket, adoption rates, and purchase criteria
- Analysis of price sensitivity, lifecycle, customer purchase basket, adoption rates, and purchase criteria
- 2.2 Criticality of inputs and Factors of differentiation
- Overview on criticality of inputs and factors of differentiation
- 2.3 Factors of disruption
- Overview on factors of disruption
- 2.4 Impact of drivers and challenges
- Impact of drivers and challenges in 2024 and 2029
3 Market Landscape
- 3.1 Market ecosystem
- Parent Market
- Data Table on - Parent Market
- 3.2 Market characteristics
- Market characteristics analysis
- 3.3 Value chain analysis
- Value chain analysis
4 Market Sizing
- 4.1 Market definition
- Offerings of companies included in the market definition
- 4.2 Market segment analysis
- Market segments
- 4.3 Market size 2024
- 4.4 Market outlook: Forecast for 2024-2029
- Chart on Global - Market size and forecast 2024-2029 ($ million)
- Data Table on Global - Market size and forecast 2024-2029 ($ million)
- Chart on Global Market: Year-over-year growth 2024-2029 (%)
- Data Table on Global Market: Year-over-year growth 2024-2029 (%)
5 Historic Market Size
- 5.1 Global Healthcare Business Process Outsourcing (BPO) Market 2019 - 2023
- Historic Market Size - Data Table on Global Healthcare Business Process Outsourcing (BPO) Market 2019 - 2023 ($ million)
- 5.2 Solution segment analysis 2019 - 2023
- Historic Market Size - Solution Segment 2019 - 2023 ($ million)
- 5.3 Service segment analysis 2019 - 2023
- Historic Market Size - Service Segment 2019 - 2023 ($ million)
- 5.4 Geography segment analysis 2019 - 2023
- Historic Market Size - Geography Segment 2019 - 2023 ($ million)
- 5.5 Country segment analysis 2019 - 2023
- Historic Market Size - Country Segment 2019 - 2023 ($ million)
6 Qualitative Analysis
- 6.1 Impact of AI on the Global Healthcare Business Process Outsourcing (BPO) Market
7 Five Forces Analysis
- 7.1 Five forces summary
- Five forces analysis - Comparison between 2024 and 2029
- 7.2 Bargaining power of buyers
- Bargaining power of buyers - Impact of key factors 2024 and 2029
- 7.3 Bargaining power of suppliers
- Bargaining power of suppliers - Impact of key factors in 2024 and 2029
- 7.4 Threat of new entrants
- Threat of new entrants - Impact of key factors in 2024 and 2029
- 7.5 Threat of substitutes
- Threat of substitutes - Impact of key factors in 2024 and 2029
- 7.6 Threat of rivalry
- Threat of rivalry - Impact of key factors in 2024 and 2029
- 7.7 Market condition
- Chart on Market condition - Five forces 2024 and 2029
8 Market Segmentation by Solution
- 8.1 Market segments
- Chart on Solution - Market share 2024-2029 (%)
- Data Table on Solution - Market share 2024-2029 (%)
- 8.2 Comparison by Solution
- Chart on Comparison by Solution
- Data Table on Comparison by Solution
- 8.3 RCM - Market size and forecast 2024-2029
- Chart on RCM - Market size and forecast 2024-2029 ($ million)
- Data Table on RCM - Market size and forecast 2024-2029 ($ million)
- Chart on RCM - Year-over-year growth 2024-2029 (%)
- Data Table on RCM - Year-over-year growth 2024-2029 (%)
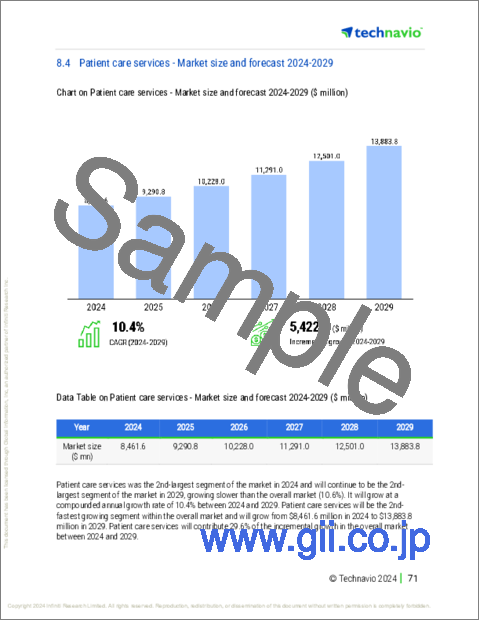
- 8.4 Patient care services - Market size and forecast 2024-2029
- Chart on Patient care services - Market size and forecast 2024-2029 ($ million)
- Data Table on Patient care services - Market size and forecast 2024-2029 ($ million)
- Chart on Patient care services - Year-over-year growth 2024-2029 (%)
- Data Table on Patient care services - Year-over-year growth 2024-2029 (%)
- 8.5 Patient enrollment and strategic planning - Market size and forecast 2024-2029
- Chart on Patient enrollment and strategic planning - Market size and forecast 2024-2029 ($ million)
- Data Table on Patient enrollment and strategic planning - Market size and forecast 2024-2029 ($ million)
- Chart on Patient enrollment and strategic planning - Year-over-year growth 2024-2029 (%)
- Data Table on Patient enrollment and strategic planning - Year-over-year growth 2024-2029 (%)
- 8.6 Market opportunity by Solution
- Market opportunity by Solution ($ million)
- Data Table on Market opportunity by Solution ($ million)
9 Market Segmentation by Service
- 9.1 Market segments
- Chart on Service - Market share 2024-2029 (%)
- Data Table on Service - Market share 2024-2029 (%)
- 9.2 Comparison by Service
- Chart on Comparison by Service
- Data Table on Comparison by Service
- 9.3 Manufacturing - Market size and forecast 2024-2029
- Chart on Manufacturing - Market size and forecast 2024-2029 ($ million)
- Data Table on Manufacturing - Market size and forecast 2024-2029 ($ million)
- Chart on Manufacturing - Year-over-year growth 2024-2029 (%)
- Data Table on Manufacturing - Year-over-year growth 2024-2029 (%)
- 9.4 Research and development - Market size and forecast 2024-2029
- Chart on Research and development - Market size and forecast 2024-2029 ($ million)
- Data Table on Research and development - Market size and forecast 2024-2029 ($ million)
- Chart on Research and development - Year-over-year growth 2024-2029 (%)
- Data Table on Research and development - Year-over-year growth 2024-2029 (%)
- 9.5 Non-clinical services - Market size and forecast 2024-2029
- Chart on Non-clinical services - Market size and forecast 2024-2029 ($ million)
- Data Table on Non-clinical services - Market size and forecast 2024-2029 ($ million)
- Chart on Non-clinical services - Year-over-year growth 2024-2029 (%)
- Data Table on Non-clinical services - Year-over-year growth 2024-2029 (%)
- 9.6 Market opportunity by Service
- Market opportunity by Service ($ million)
- Data Table on Market opportunity by Service ($ million)
10 Customer Landscape
- 10.1 Customer landscape overview
- Analysis of price sensitivity, lifecycle, customer purchase basket, adoption rates, and purchase criteria
11 Geographic Landscape
- 11.1 Geographic segmentation
- Chart on Market share By Geographical Landscape 2024-2029 (%)
- Data Table on Market share By Geographical Landscape 2024-2029 (%)
- 11.2 Geographic comparison
- Chart on Geographic comparison
- Data Table on Geographic comparison
- 11.3 North America - Market size and forecast 2024-2029
- Chart on North America - Market size and forecast 2024-2029 ($ million)
- Data Table on North America - Market size and forecast 2024-2029 ($ million)
- Chart on North America - Year-over-year growth 2024-2029 (%)
- Data Table on North America - Year-over-year growth 2024-2029 (%)
- 11.4 APAC - Market size and forecast 2024-2029
- Chart on APAC - Market size and forecast 2024-2029 ($ million)
- Data Table on APAC - Market size and forecast 2024-2029 ($ million)
- Chart on APAC - Year-over-year growth 2024-2029 (%)
- Data Table on APAC - Year-over-year growth 2024-2029 (%)
- 11.5 Europe - Market size and forecast 2024-2029
- Chart on Europe - Market size and forecast 2024-2029 ($ million)
- Data Table on Europe - Market size and forecast 2024-2029 ($ million)
- Chart on Europe - Year-over-year growth 2024-2029 (%)
- Data Table on Europe - Year-over-year growth 2024-2029 (%)
- 11.6 Middle East and Africa - Market size and forecast 2024-2029
- Chart on Middle East and Africa - Market size and forecast 2024-2029 ($ million)
- Data Table on Middle East and Africa - Market size and forecast 2024-2029 ($ million)
- Chart on Middle East and Africa - Year-over-year growth 2024-2029 (%)
- Data Table on Middle East and Africa - Year-over-year growth 2024-2029 (%)
- 11.7 South America - Market size and forecast 2024-2029
- Chart on South America - Market size and forecast 2024-2029 ($ million)
- Data Table on South America - Market size and forecast 2024-2029 ($ million)
- Chart on South America - Year-over-year growth 2024-2029 (%)
- Data Table on South America - Year-over-year growth 2024-2029 (%)
- 11.8 US - Market size and forecast 2024-2029
- Chart on US - Market size and forecast 2024-2029 ($ million)
- Data Table on US - Market size and forecast 2024-2029 ($ million)
- Chart on US - Year-over-year growth 2024-2029 (%)
- Data Table on US - Year-over-year growth 2024-2029 (%)
- 11.9 Canada - Market size and forecast 2024-2029
- Chart on Canada - Market size and forecast 2024-2029 ($ million)
- Data Table on Canada - Market size and forecast 2024-2029 ($ million)
- Chart on Canada - Year-over-year growth 2024-2029 (%)
- Data Table on Canada - Year-over-year growth 2024-2029 (%)
- 11.10 China - Market size and forecast 2024-2029
- Chart on China - Market size and forecast 2024-2029 ($ million)
- Data Table on China - Market size and forecast 2024-2029 ($ million)
- Chart on China - Year-over-year growth 2024-2029 (%)
- Data Table on China - Year-over-year growth 2024-2029 (%)
- 11.11 UK - Market size and forecast 2024-2029
- Chart on UK - Market size and forecast 2024-2029 ($ million)
- Data Table on UK - Market size and forecast 2024-2029 ($ million)
- Chart on UK - Year-over-year growth 2024-2029 (%)
- Data Table on UK - Year-over-year growth 2024-2029 (%)
- 11.12 Mexico - Market size and forecast 2024-2029
- Chart on Mexico - Market size and forecast 2024-2029 ($ million)
- Data Table on Mexico - Market size and forecast 2024-2029 ($ million)
- Chart on Mexico - Year-over-year growth 2024-2029 (%)
- Data Table on Mexico - Year-over-year growth 2024-2029 (%)
- 11.13 Germany - Market size and forecast 2024-2029
- Chart on Germany - Market size and forecast 2024-2029 ($ million)
- Data Table on Germany - Market size and forecast 2024-2029 ($ million)
- Chart on Germany - Year-over-year growth 2024-2029 (%)
- Data Table on Germany - Year-over-year growth 2024-2029 (%)
- 11.14 India - Market size and forecast 2024-2029
- Chart on India - Market size and forecast 2024-2029 ($ million)
- Data Table on India - Market size and forecast 2024-2029 ($ million)
- Chart on India - Year-over-year growth 2024-2029 (%)
- Data Table on India - Year-over-year growth 2024-2029 (%)
- 11.15 Philippines - Market size and forecast 2024-2029
- Chart on Philippines - Market size and forecast 2024-2029 ($ million)
- Data Table on Philippines - Market size and forecast 2024-2029 ($ million)
- Chart on Philippines - Year-over-year growth 2024-2029 (%)
- Data Table on Philippines - Year-over-year growth 2024-2029 (%)
- 11.16 Brazil - Market size and forecast 2024-2029
- Chart on Brazil - Market size and forecast 2024-2029 ($ million)
- Data Table on Brazil - Market size and forecast 2024-2029 ($ million)
- Chart on Brazil - Year-over-year growth 2024-2029 (%)
- Data Table on Brazil - Year-over-year growth 2024-2029 (%)
- 11.17 France - Market size and forecast 2024-2029
- Chart on France - Market size and forecast 2024-2029 ($ million)
- Data Table on France - Market size and forecast 2024-2029 ($ million)
- Chart on France - Year-over-year growth 2024-2029 (%)
- Data Table on France - Year-over-year growth 2024-2029 (%)
- 11.18 Market opportunity By Geographical Landscape
- Market opportunity By Geographical Landscape ($ million)
- Data Tables on Market opportunity By Geographical Landscape ($ million)
12 Drivers, Challenges, and Opportunity/Restraints
- 12.1 Market drivers
- 12.2 Market challenges
- 12.3 Impact of drivers and challenges
- Impact of drivers and challenges in 2024 and 2029
- 12.4 Market opportunities/restraints
13 Competitive Landscape
- 13.1 Overview
- 13.2 Competitive Landscape
- Overview on criticality of inputs and factors of differentiation
- 13.3 Landscape disruption
- Overview on factors of disruption
- 13.4 Industry risks
- Impact of key risks on business
14 Competitive Analysis
- 14.1 Companies profiled
- Companies covered
- 14.2 Company ranking index
- Company ranking index
- 14.3 Market positioning of companies
- Matrix on companies position and classification
- 14.4 Accenture PLC
- Accenture PLC - Overview
- Accenture PLC - Business segments
- Accenture PLC - Key news
- Accenture PLC - Key offerings
- Accenture PLC - Segment focus
- SWOT
- 14.5 Cognizant Technology Solutions Corp.
- Cognizant Technology Solutions Corp. - Overview
- Cognizant Technology Solutions Corp. - Business segments
- Cognizant Technology Solutions Corp. - Key news
- Cognizant Technology Solutions Corp. - Key offerings
- Cognizant Technology Solutions Corp. - Segment focus
- SWOT
- 14.6 GeBBS Healthcare Solutions Inc.
- GeBBS Healthcare Solutions Inc. - Overview
- GeBBS Healthcare Solutions Inc. - Product / Service
- GeBBS Healthcare Solutions Inc. - Key offerings
- SWOT
- 14.7 Genpact Ltd.
- Genpact Ltd. - Overview
- Genpact Ltd. - Business segments
- Genpact Ltd. - Key news
- Genpact Ltd. - Key offerings
- Genpact Ltd. - Segment focus
- SWOT
- 14.8 HCL Technologies Ltd.
- HCL Technologies Ltd. - Overview
- HCL Technologies Ltd. - Business segments
- HCL Technologies Ltd. - Key news
- HCL Technologies Ltd. - Key offerings
- HCL Technologies Ltd. - Segment focus
- SWOT
- 14.9 Infosys Ltd.
- Infosys Ltd. - Overview
- Infosys Ltd. - Business segments
- Infosys Ltd. - Key news
- Infosys Ltd. - Key offerings
- Infosys Ltd. - Segment focus
- SWOT
- 14.10 International Business Machines Corp.
- International Business Machines Corp. - Overview
- International Business Machines Corp. - Business segments
- International Business Machines Corp. - Key news
- International Business Machines Corp. - Key offerings
- International Business Machines Corp. - Segment focus
- SWOT
- 14.11 Invensis Technologies Pvt. Ltd.
- Invensis Technologies Pvt. Ltd. - Overview
- Invensis Technologies Pvt. Ltd. - Product / Service
- Invensis Technologies Pvt. Ltd. - Key offerings
- SWOT
- 14.12 IQVIA Holdings Inc.
- IQVIA Holdings Inc. - Overview
- IQVIA Holdings Inc. - Business segments
- IQVIA Holdings Inc. - Key news
- IQVIA Holdings Inc. - Key offerings
- IQVIA Holdings Inc. - Segment focus
- SWOT
- 14.13 OMH HealthEdge Holdings LLC
- OMH HealthEdge Holdings LLC - Overview
- OMH HealthEdge Holdings LLC - Product / Service
- OMH HealthEdge Holdings LLC - Key offerings
- SWOT
- 14.14 R1 RCM Inc.
- R1 RCM Inc. - Overview
- R1 RCM Inc. - Product / Service
- R1 RCM Inc. - Key offerings
- SWOT
- 14.15 Sutherland Global Services Inc.
- Sutherland Global Services Inc. - Overview
- Sutherland Global Services Inc. - Product / Service
- Sutherland Global Services Inc. - Key offerings
- SWOT
- 14.16 Tata Consultancy Services Ltd.
- Tata Consultancy Services Ltd. - Overview
- Tata Consultancy Services Ltd. - Business segments
- Tata Consultancy Services Ltd. - Key news
- Tata Consultancy Services Ltd. - Key offerings
- Tata Consultancy Services Ltd. - Segment focus
- SWOT
- 14.17 Wipro Ltd.
- Wipro Ltd. - Overview
- Wipro Ltd. - Business segments
- Wipro Ltd. - Key news
- Wipro Ltd. - Key offerings
- Wipro Ltd. - Segment focus
- SWOT
- 14.18 WNS Holdings Ltd.
- WNS Holdings Ltd. - Overview
- WNS Holdings Ltd. - Business segments
- WNS Holdings Ltd. - Key news
- WNS Holdings Ltd. - Key offerings
- WNS Holdings Ltd. - Segment focus
- SWOT
15 Appendix
- 15.1 Scope of the report
- 15.2 Inclusions and exclusions checklist
- Inclusions checklist
- Exclusions checklist
- 15.3 Currency conversion rates for US$
- Currency conversion rates for US$
- 15.4 Research methodology
- Research methodology
- 15.5 Data procurement
- Information sources
- 15.6 Data validation
- Data validation
- 15.7 Validation techniques employed for market sizing
- Validation techniques employed for market sizing
- 15.8 Data synthesis
- Data synthesis
- 15.9 360 degree market analysis
- 360 degree market analysis
- 15.10 List of abbreviations
- List of abbreviations
