|
|
市場調査レポート
商品コード
1645549
プリンターの世界市場 2025~2029年Global Printers Market 2025-2029 |
||||||

|
|||||||
カスタマイズ可能
|
|||||||


| プリンターの世界市場 2025~2029年 |
|
出版日: 2025年01月17日
発行: TechNavio
ページ情報: 英文 210 Pages
納期: 即納可能
|

全表示
- 概要
- 図表
- 目次
プリンター市場は2024~2029年に112億4,660万米ドル、予測期間中のCAGRは3.5%で成長すると予測されます。
当レポートでは、プリンター市場の全体的な分析、市場規模・予測、動向、成長促進要因、課題、約25のベンダーを網羅したベンダー分析などを掲載しています。
現在の市場シナリオ、最新動向と促進要因、市場環境全体に関する最新分析を提供しています。プリンター市場は、中小企業のプリンター需要の増加、繊維・広告産業の大判プリンター需要の増加、小型ポータブルプリンター需要の増加が牽引しています。
| 市場範囲 | |
|---|---|
| 基準年 | 2025年 |
| 終了年 | 2029年 |
| 予測期間 | 2025~2029年 |
| 成長モメンタム | 加速 |
| 前年比[2025年] | 3.4% |
| CAGR | 3.5% |
| 増分額 | 112億4,660万米ドル |
本調査では、プリンターにおける3d技術の採用増加が、今後数年間のプリンター市場成長を牽引する主要因の1つであると分析しています。また、プリンターに先進的セキュリティ機能がイントロダクションされ、無機的な成長戦略への注目が高まっていることも、市場の大きな需要につながると考えられます。
目次
第1章 エグゼクティブサマリー
- 市場概要
第2章 Technavio分析
- 価格・ライフサイクル・顧客購入バスケット・採用率・購入基準の分析
- インプットの重要性と差別化の要因
- 混乱の要因
- 促進要因と課題の影響
第3章 市場情勢
- 市場エコシステム
- 市場の特徴
- バリューチェーン分析
第4章 市場規模
- 市場の定義
- 市場セグメント分析
- 市場規模 2024年
- 市場の展望 2024~2029年
第5章 市場規模実績
- プリンターの世界市場 2019~2023年
- 技術別セグメント分析 2019~2023年
- タイプ別セグメント分析 2019~2023年
- 地域別セグメント分析 2019~2023年
- 国別セグメント分析 2019~2023年
第6章 定性分析
- AIの影響:プリンターの世界市場
第7章 ファイブフォース分析
- ファイブフォースの要約
- 買い手の交渉力
- 供給企業の交渉力
- 新規参入業者の脅威
- 代替品の脅威
- 競争の脅威
- 市況
第8章 市場セグメンテーション:技術別
- 市場セグメント
- 比較:技術別
- レーザー:市場規模と予測 2024~2029年
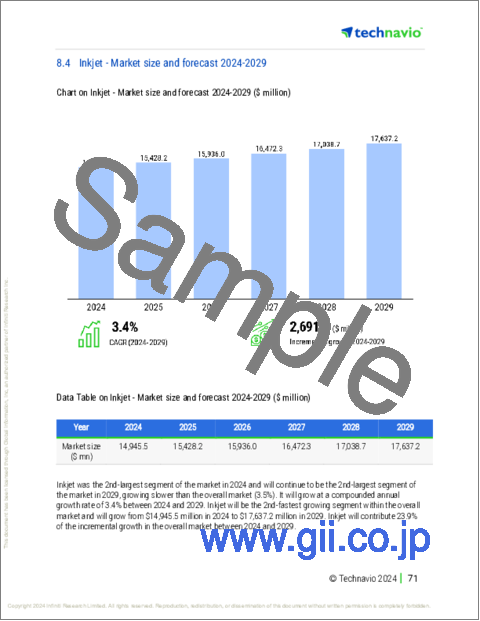
- インクジェット:市場規模と予測 2024~2029年
- その他:市場規模と予測 2024~2029年
- 市場機会:技術別
第9章 市場セグメンテーション:タイプ別
- 市場セグメント
- 比較:タイプ別
- 多機能プリンター:市場規模と予測 2024~2029年
- 単機能プリンター:市場規模と予測 2024~2029年
- 市場機会:タイプ別
第10章 顧客情勢
- 顧客情勢概要
第11章 地域別情勢
- 地域別セグメンテーション
- 比較:地域別
- アジア太平洋:市場規模と予測 2024~2029年
- 欧州:市場規模と予測 2024~2029年
- 北米:市場規模と予測 2024~2029年
- 南米:市場規模と予測 2024~2029年
- 中東・アフリカ:市場規模と予測 2024~2029年
- 米国:市場規模と予測 2024~2029年
- 中国:市場規模と予測 2024~2029年
- ドイツ:市場規模と予測 2024~2029年
- 日本:市場規模と予測 2024~2029年
- インド:市場規模と予測 2024~2029年
- 英国:市場規模と予測 2024~2029年
- 韓国:市場規模と予測 2024~2029年
- フランス:市場規模と予測 2024~2029年
- ブラジル:市場規模と予測 2024~2029年
- イタリア:市場規模と予測 2024~2029年
- 地域情勢による市場機会
第12章 促進要因・課題・機会・抑制要因
- 市場促進要因
- 市場課題
- 促進要因と課題の影響
- 市場機会・抑制要因
第13章 競合情勢
- 概要
- 競合情勢
- 混乱の状況
- 産業のリスク
第14章 競合分析
- 企業プロファイル
- 企業ランキング指数
- 企業の市場ポジショニング
- Brother Industries Ltd.
- Canon Inc.
- Dell Technologies Inc.
- Fujitsu Ltd.
- HP Inc.
- Konica Minolta Inc.
- KYOCERA Corp.
- Lexmark International Inc.
- Oki Electric Industry Co. Ltd.
- Panasonic Holdings Corp.
- Ricoh Co. Ltd.
- Seiko Epson Corp.
- Sharp Corp.
- Toshiba Corp.
- Xerox Holdings Corp.
第15章 付録
Exhibits:
- Exhibits1: Executive Summary - Chart on Market Overview
- Exhibits2: Executive Summary - Data Table on Market Overview
- Exhibits3: Executive Summary - Chart on Global Market Characteristics
- Exhibits4: Executive Summary - Chart on Market By Geographical Landscape
- Exhibits5: Executive Summary - Chart on Market Segmentation by Technology
- Exhibits6: Executive Summary - Chart on Market Segmentation by Type
- Exhibits7: Executive Summary - Chart on Incremental Growth
- Exhibits8: Executive Summary - Data Table on Incremental Growth
- Exhibits9: Executive Summary - Chart on Company Market Positioning
- Exhibits10: Analysis of price sensitivity, lifecycle, customer purchase basket, adoption rates, and purchase criteria
- Exhibits11: Overview on criticality of inputs and factors of differentiation
- Exhibits12: Overview on factors of disruption
- Exhibits13: Impact of drivers and challenges in 2024 and 2029
- Exhibits14: Parent Market
- Exhibits15: Data Table on - Parent Market
- Exhibits16: Market characteristics analysis
- Exhibits17: Value chain analysis
- Exhibits18: Offerings of companies included in the market definition
- Exhibits19: Market segments
- Exhibits20: Chart on Global - Market size and forecast 2024-2029 ($ million)
- Exhibits21: Data Table on Global - Market size and forecast 2024-2029 ($ million)
- Exhibits22: Chart on Global Market: Year-over-year growth 2024-2029 (%)
- Exhibits23: Data Table on Global Market: Year-over-year growth 2024-2029 (%)
- Exhibits24: Historic Market Size - Data Table on Global Printers Market 2019 - 2023 ($ million)
- Exhibits25: Historic Market Size - Technology Segment 2019 - 2023 ($ million)
- Exhibits26: Historic Market Size - Type Segment 2019 - 2023 ($ million)
- Exhibits27: Historic Market Size - Geography Segment 2019 - 2023 ($ million)
- Exhibits28: Historic Market Size - Country Segment 2019 - 2023 ($ million)
- Exhibits29: Five forces analysis - Comparison between 2024 and 2029
- Exhibits30: Bargaining power of buyers - Impact of key factors 2024 and 2029
- Exhibits31: Bargaining power of suppliers - Impact of key factors in 2024 and 2029
- Exhibits32: Threat of new entrants - Impact of key factors in 2024 and 2029
- Exhibits33: Threat of substitutes - Impact of key factors in 2024 and 2029
- Exhibits34: Threat of rivalry - Impact of key factors in 2024 and 2029
- Exhibits35: Chart on Market condition - Five forces 2024 and 2029
- Exhibits36: Chart on Technology - Market share 2024-2029 (%)
- Exhibits37: Data Table on Technology - Market share 2024-2029 (%)
- Exhibits38: Chart on Comparison by Technology
- Exhibits39: Data Table on Comparison by Technology
- Exhibits40: Chart on Laser - Market size and forecast 2024-2029 ($ million)
- Exhibits41: Data Table on Laser - Market size and forecast 2024-2029 ($ million)
- Exhibits42: Chart on Laser - Year-over-year growth 2024-2029 (%)
- Exhibits43: Data Table on Laser - Year-over-year growth 2024-2029 (%)
- Exhibits44: Chart on Inkjet - Market size and forecast 2024-2029 ($ million)
- Exhibits45: Data Table on Inkjet - Market size and forecast 2024-2029 ($ million)
- Exhibits46: Chart on Inkjet - Year-over-year growth 2024-2029 (%)
- Exhibits47: Data Table on Inkjet - Year-over-year growth 2024-2029 (%)
- Exhibits48: Chart on Others - Market size and forecast 2024-2029 ($ million)
- Exhibits49: Data Table on Others - Market size and forecast 2024-2029 ($ million)
- Exhibits50: Chart on Others - Year-over-year growth 2024-2029 (%)
- Exhibits51: Data Table on Others - Year-over-year growth 2024-2029 (%)
- Exhibits52: Market opportunity by Technology ($ million)
- Exhibits53: Data Table on Market opportunity by Technology ($ million)
- Exhibits54: Chart on Type - Market share 2024-2029 (%)
- Exhibits55: Data Table on Type - Market share 2024-2029 (%)
- Exhibits56: Chart on Comparison by Type
- Exhibits57: Data Table on Comparison by Type
- Exhibits58: Chart on Multifunction printers - Market size and forecast 2024-2029 ($ million)
- Exhibits59: Data Table on Multifunction printers - Market size and forecast 2024-2029 ($ million)
- Exhibits60: Chart on Multifunction printers - Year-over-year growth 2024-2029 (%)
- Exhibits61: Data Table on Multifunction printers - Year-over-year growth 2024-2029 (%)
- Exhibits62: Chart on Single function printers - Market size and forecast 2024-2029 ($ million)
- Exhibits63: Data Table on Single function printers - Market size and forecast 2024-2029 ($ million)
- Exhibits64: Chart on Single function printers - Year-over-year growth 2024-2029 (%)
- Exhibits65: Data Table on Single function printers - Year-over-year growth 2024-2029 (%)
- Exhibits66: Market opportunity by Type ($ million)
- Exhibits67: Data Table on Market opportunity by Type ($ million)
- Exhibits68: Analysis of price sensitivity, lifecycle, customer purchase basket, adoption rates, and purchase criteria
- Exhibits69: Chart on Market share By Geographical Landscape 2024-2029 (%)
- Exhibits70: Data Table on Market share By Geographical Landscape 2024-2029 (%)
- Exhibits71: Chart on Geographic comparison
- Exhibits72: Data Table on Geographic comparison
- Exhibits73: Chart on APAC - Market size and forecast 2024-2029 ($ million)
- Exhibits74: Data Table on APAC - Market size and forecast 2024-2029 ($ million)
- Exhibits75: Chart on APAC - Year-over-year growth 2024-2029 (%)
- Exhibits76: Data Table on APAC - Year-over-year growth 2024-2029 (%)
- Exhibits77: Chart on Europe - Market size and forecast 2024-2029 ($ million)
- Exhibits78: Data Table on Europe - Market size and forecast 2024-2029 ($ million)
- Exhibits79: Chart on Europe - Year-over-year growth 2024-2029 (%)
- Exhibits80: Data Table on Europe - Year-over-year growth 2024-2029 (%)
- Exhibits81: Chart on North America - Market size and forecast 2024-2029 ($ million)
- Exhibits82: Data Table on North America - Market size and forecast 2024-2029 ($ million)
- Exhibits83: Chart on North America - Year-over-year growth 2024-2029 (%)
- Exhibits84: Data Table on North America - Year-over-year growth 2024-2029 (%)
- Exhibits85: Chart on South America - Market size and forecast 2024-2029 ($ million)
- Exhibits86: Data Table on South America - Market size and forecast 2024-2029 ($ million)
- Exhibits87: Chart on South America - Year-over-year growth 2024-2029 (%)
- Exhibits88: Data Table on South America - Year-over-year growth 2024-2029 (%)
- Exhibits89: Chart on Middle East and Africa - Market size and forecast 2024-2029 ($ million)
- Exhibits90: Data Table on Middle East and Africa - Market size and forecast 2024-2029 ($ million)
- Exhibits91: Chart on Middle East and Africa - Year-over-year growth 2024-2029 (%)
- Exhibits92: Data Table on Middle East and Africa - Year-over-year growth 2024-2029 (%)
- Exhibits93: Chart on US - Market size and forecast 2024-2029 ($ million)
- Exhibits94: Data Table on US - Market size and forecast 2024-2029 ($ million)
- Exhibits95: Chart on US - Year-over-year growth 2024-2029 (%)
- Exhibits96: Data Table on US - Year-over-year growth 2024-2029 (%)
- Exhibits97: Chart on China - Market size and forecast 2024-2029 ($ million)
- Exhibits98: Data Table on China - Market size and forecast 2024-2029 ($ million)
- Exhibits99: Chart on China - Year-over-year growth 2024-2029 (%)
- Exhibits100: Data Table on China - Year-over-year growth 2024-2029 (%)
- Exhibits101: Chart on Germany - Market size and forecast 2024-2029 ($ million)
- Exhibits102: Data Table on Germany - Market size and forecast 2024-2029 ($ million)
- Exhibits103: Chart on Germany - Year-over-year growth 2024-2029 (%)
- Exhibits104: Data Table on Germany - Year-over-year growth 2024-2029 (%)
- Exhibits105: Chart on Japan - Market size and forecast 2024-2029 ($ million)
- Exhibits106: Data Table on Japan - Market size and forecast 2024-2029 ($ million)
- Exhibits107: Chart on Japan - Year-over-year growth 2024-2029 (%)
- Exhibits108: Data Table on Japan - Year-over-year growth 2024-2029 (%)
- Exhibits109: Chart on India - Market size and forecast 2024-2029 ($ million)
- Exhibits110: Data Table on India - Market size and forecast 2024-2029 ($ million)
- Exhibits111: Chart on India - Year-over-year growth 2024-2029 (%)
- Exhibits112: Data Table on India - Year-over-year growth 2024-2029 (%)
- Exhibits113: Chart on UK - Market size and forecast 2024-2029 ($ million)
- Exhibits114: Data Table on UK - Market size and forecast 2024-2029 ($ million)
- Exhibits115: Chart on UK - Year-over-year growth 2024-2029 (%)
- Exhibits116: Data Table on UK - Year-over-year growth 2024-2029 (%)
- Exhibits117: Chart on South Korea - Market size and forecast 2024-2029 ($ million)
- Exhibits118: Data Table on South Korea - Market size and forecast 2024-2029 ($ million)
- Exhibits119: Chart on South Korea - Year-over-year growth 2024-2029 (%)
- Exhibits120: Data Table on South Korea - Year-over-year growth 2024-2029 (%)
- Exhibits121: Chart on France - Market size and forecast 2024-2029 ($ million)
- Exhibits122: Data Table on France - Market size and forecast 2024-2029 ($ million)
- Exhibits123: Chart on France - Year-over-year growth 2024-2029 (%)
- Exhibits124: Data Table on France - Year-over-year growth 2024-2029 (%)
- Exhibits125: Chart on Brazil - Market size and forecast 2024-2029 ($ million)
- Exhibits126: Data Table on Brazil - Market size and forecast 2024-2029 ($ million)
- Exhibits127: Chart on Brazil - Year-over-year growth 2024-2029 (%)
- Exhibits128: Data Table on Brazil - Year-over-year growth 2024-2029 (%)
- Exhibits129: Chart on Italy - Market size and forecast 2024-2029 ($ million)
- Exhibits130: Data Table on Italy - Market size and forecast 2024-2029 ($ million)
- Exhibits131: Chart on Italy - Year-over-year growth 2024-2029 (%)
- Exhibits132: Data Table on Italy - Year-over-year growth 2024-2029 (%)
- Exhibits133: Market opportunity By Geographical Landscape ($ million)
- Exhibits134: Data Tables on Market opportunity By Geographical Landscape ($ million)
- Exhibits135: Impact of drivers and challenges in 2024 and 2029
- Exhibits136: Overview on criticality of inputs and factors of differentiation
- Exhibits137: Overview on factors of disruption
- Exhibits138: Impact of key risks on business
- Exhibits139: Companies covered
- Exhibits140: Company ranking index
- Exhibits141: Matrix on companies position and classification
- Exhibits142: Brother Industries Ltd. - Overview
- Exhibits143: Brother Industries Ltd. - Business segments
- Exhibits144: Brother Industries Ltd. - Key news
- Exhibits145: Brother Industries Ltd. - Key offerings
- Exhibits146: Brother Industries Ltd. - Segment focus
- Exhibits147: SWOT
- Exhibits148: Canon Inc. - Overview
- Exhibits149: Canon Inc. - Business segments
- Exhibits150: Canon Inc. - Key news
- Exhibits151: Canon Inc. - Key offerings
- Exhibits152: Canon Inc. - Segment focus
- Exhibits153: SWOT
- Exhibits154: Dell Technologies Inc. - Overview
- Exhibits155: Dell Technologies Inc. - Business segments
- Exhibits156: Dell Technologies Inc. - Key news
- Exhibits157: Dell Technologies Inc. - Key offerings
- Exhibits158: Dell Technologies Inc. - Segment focus
- Exhibits159: SWOT
- Exhibits160: Fujitsu Ltd. - Overview
- Exhibits161: Fujitsu Ltd. - Business segments
- Exhibits162: Fujitsu Ltd. - Key news
- Exhibits163: Fujitsu Ltd. - Key offerings
- Exhibits164: Fujitsu Ltd. - Segment focus
- Exhibits165: SWOT
- Exhibits166: HP Inc. - Overview
- Exhibits167: HP Inc. - Business segments
- Exhibits168: HP Inc. - Key news
- Exhibits169: HP Inc. - Key offerings
- Exhibits170: HP Inc. - Segment focus
- Exhibits171: SWOT
- Exhibits172: Konica Minolta Inc. - Overview
- Exhibits173: Konica Minolta Inc. - Business segments
- Exhibits174: Konica Minolta Inc. - Key news
- Exhibits175: Konica Minolta Inc. - Key offerings
- Exhibits176: Konica Minolta Inc. - Segment focus
- Exhibits177: SWOT
- Exhibits178: KYOCERA Corp. - Overview
- Exhibits179: KYOCERA Corp. - Business segments
- Exhibits180: KYOCERA Corp. - Key news
- Exhibits181: KYOCERA Corp. - Key offerings
- Exhibits182: KYOCERA Corp. - Segment focus
- Exhibits183: SWOT
- Exhibits184: Lexmark International Inc. - Overview
- Exhibits185: Lexmark International Inc. - Product / Service
- Exhibits186: Lexmark International Inc. - Key news
- Exhibits187: Lexmark International Inc. - Key offerings
- Exhibits188: SWOT
- Exhibits189: Oki Electric Industry Co. Ltd. - Overview
- Exhibits190: Oki Electric Industry Co. Ltd. - Business segments
- Exhibits191: Oki Electric Industry Co. Ltd. - Key news
- Exhibits192: Oki Electric Industry Co. Ltd. - Key offerings
- Exhibits193: Oki Electric Industry Co. Ltd. - Segment focus
- Exhibits194: SWOT
- Exhibits195: Panasonic Holdings Corp. - Overview
- Exhibits196: Panasonic Holdings Corp. - Business segments
- Exhibits197: Panasonic Holdings Corp. - Key news
- Exhibits198: Panasonic Holdings Corp. - Key offerings
- Exhibits199: Panasonic Holdings Corp. - Segment focus
- Exhibits200: SWOT
- Exhibits201: Ricoh Co. Ltd. - Overview
- Exhibits202: Ricoh Co. Ltd. - Business segments
- Exhibits203: Ricoh Co. Ltd. - Key news
- Exhibits204: Ricoh Co. Ltd. - Key offerings
- Exhibits205: Ricoh Co. Ltd. - Segment focus
- Exhibits206: SWOT
- Exhibits207: Seiko Epson Corp. - Overview
- Exhibits208: Seiko Epson Corp. - Business segments
- Exhibits209: Seiko Epson Corp. - Key news
- Exhibits210: Seiko Epson Corp. - Key offerings
- Exhibits211: Seiko Epson Corp. - Segment focus
- Exhibits212: SWOT
- Exhibits213: Sharp Corp. - Overview
- Exhibits214: Sharp Corp. - Business segments
- Exhibits215: Sharp Corp. - Key news
- Exhibits216: Sharp Corp. - Key offerings
- Exhibits217: Sharp Corp. - Segment focus
- Exhibits218: SWOT
- Exhibits219: Toshiba Corp. - Overview
- Exhibits220: Toshiba Corp. - Business segments
- Exhibits221: Toshiba Corp. - Key news
- Exhibits222: Toshiba Corp. - Key offerings
- Exhibits223: Toshiba Corp. - Segment focus
- Exhibits224: SWOT
- Exhibits225: Xerox Holdings Corp. - Overview
- Exhibits226: Xerox Holdings Corp. - Business segments
- Exhibits227: Xerox Holdings Corp. - Key news
- Exhibits228: Xerox Holdings Corp. - Key offerings
- Exhibits229: Xerox Holdings Corp. - Segment focus
- Exhibits230: SWOT
- Exhibits231: Inclusions checklist
- Exhibits232: Exclusions checklist
- Exhibits233: Currency conversion rates for US$
- Exhibits234: Research methodology
- Exhibits235: Information sources
- Exhibits236: Data validation
- Exhibits237: Validation techniques employed for market sizing
- Exhibits238: Data synthesis
- Exhibits239: 360 degree market analysis
- Exhibits240: List of abbreviations
The printers market is forecasted to grow by USD 11246.6 mn during 2024-2029, accelerating at a CAGR of 3.5% during the forecast period. The report on the printers market provides a holistic analysis, market size and forecast, trends, growth drivers, and challenges, as well as vendor analysis covering around 25 vendors.
The report offers an up-to-date analysis regarding the current market scenario, the latest trends and drivers, and the overall market environment. The market is driven by rising demand for printers from smes, growing demand for large-format printers from textile and advertising industries, and increasing demand for compact portable printers.
| Market Scope | |
|---|---|
| Base Year | 2025 |
| End Year | 2029 |
| Series Year | 2025-2029 |
| Growth Momentum | Accelerate |
| YOY 2025 | 3.4% |
| CAGR | 3.5% |
| Incremental Value | $11246.6 mn |
Technavio's printers market is segmented as below:
By Technology
- Laser
- Inkjet
- Others
By Type
- Multifunction printers
- Single function printers
By Geographical Landscape
- APAC
- Europe
- North America
- South America
- Middle East and Africa
This study identifies the increasing adoption of 3d technology in printers as one of the prime reasons driving the printers market growth during the next few years. Also, introduction of advanced security features in printers and growing focus on inorganic growth strategies will lead to sizable demand in the market.
The report on the printers market covers the following areas:
- Printers Market sizing
- Printers Market forecast
- Printers Market industry analysis
The robust vendor analysis is designed to help clients improve their market position, and in line with this, this report provides a detailed analysis of several leading printers market vendors that include BIXOLON CO. LTD., Brady Corp., Brother Industries Ltd., Canon Inc., Citizen Systems Europe GmbH, Dell Technologies Inc., Fujitsu Ltd., Honeywell International Inc., HP Inc., Konica Minolta Inc., KYOCERA Corp., Lenovo Group Ltd., Lexmark International Inc., Oki Electric Industry Co. Ltd., Panasonic Holdings Corp., Ricoh Co. Ltd., Seiko Epson Corp., Sharp Corp., Toshiba Corp., Xerox Holdings Corp., and Zebra Technologies Corp.. Also, the printers market analysis report includes information on upcoming trends and challenges that will influence market growth. This is to help companies strategize and leverage all forthcoming growth opportunities.
The study was conducted using an objective combination of primary and secondary information including inputs from key participants in the industry. The report contains a comprehensive market and vendor landscape in addition to an analysis of the key vendors.
The publisher presents a detailed picture of the market by the way of study, synthesis, and summation of data from multiple sources by an analysis of key parameters such as profit, pricing, competition, and promotions. It presents various market facets by identifying the key industry influencers. The data presented is comprehensive, reliable, and a result of extensive primary and secondary research. The market research reports provide a complete competitive landscape and an in-depth vendor selection methodology and analysis using qualitative and quantitative research to forecast accurate market growth.
Table of Contents
1 Executive Summary
- 1.1 Market overview
- Executive Summary - Chart on Market Overview
- Executive Summary - Data Table on Market Overview
- Executive Summary - Chart on Global Market Characteristics
- Executive Summary - Chart on Market By Geographical Landscape
- Executive Summary - Chart on Market Segmentation by Technology
- Executive Summary - Chart on Market Segmentation by Type
- Executive Summary - Chart on Incremental Growth
- Executive Summary - Data Table on Incremental Growth
- Executive Summary - Chart on Company Market Positioning
2 Technavio Analysis
- 2.1 Analysis of price sensitivity, lifecycle, customer purchase basket, adoption rates, and purchase criteria
- Analysis of price sensitivity, lifecycle, customer purchase basket, adoption rates, and purchase criteria
- 2.2 Criticality of inputs and Factors of differentiation
- Overview on criticality of inputs and factors of differentiation
- 2.3 Factors of disruption
- Overview on factors of disruption
- 2.4 Impact of drivers and challenges
- Impact of drivers and challenges in 2024 and 2029
3 Market Landscape
- 3.1 Market ecosystem
- Parent Market
- Data Table on - Parent Market
- 3.2 Market characteristics
- Market characteristics analysis
- 3.3 Value chain analysis
- Value chain analysis
4 Market Sizing
- 4.1 Market definition
- Offerings of companies included in the market definition
- 4.2 Market segment analysis
- Market segments
- 4.3 Market size 2024
- 4.4 Market outlook: Forecast for 2024-2029
- Chart on Global - Market size and forecast 2024-2029 ($ million)
- Data Table on Global - Market size and forecast 2024-2029 ($ million)
- Chart on Global Market: Year-over-year growth 2024-2029 (%)
- Data Table on Global Market: Year-over-year growth 2024-2029 (%)
5 Historic Market Size
- 5.1 Global Printers Market 2019 - 2023
- Historic Market Size - Data Table on Global Printers Market 2019 - 2023 ($ million)
- 5.2 Technology segment analysis 2019 - 2023
- Historic Market Size - Technology Segment 2019 - 2023 ($ million)
- 5.3 Type segment analysis 2019 - 2023
- Historic Market Size - Type Segment 2019 - 2023 ($ million)
- 5.4 Geography segment analysis 2019 - 2023
- Historic Market Size - Geography Segment 2019 - 2023 ($ million)
- 5.5 Country segment analysis 2019 - 2023
- Historic Market Size - Country Segment 2019 - 2023 ($ million)
6 Qualitative Analysis
- 6.1 The AI impact on Global Printers Market
7 Five Forces Analysis
- 7.1 Five forces summary
- Five forces analysis - Comparison between 2024 and 2029
- 7.2 Bargaining power of buyers
- Bargaining power of buyers - Impact of key factors 2024 and 2029
- 7.3 Bargaining power of suppliers
- Bargaining power of suppliers - Impact of key factors in 2024 and 2029
- 7.4 Threat of new entrants
- Threat of new entrants - Impact of key factors in 2024 and 2029
- 7.5 Threat of substitutes
- Threat of substitutes - Impact of key factors in 2024 and 2029
- 7.6 Threat of rivalry
- Threat of rivalry - Impact of key factors in 2024 and 2029
- 7.7 Market condition
- Chart on Market condition - Five forces 2024 and 2029
8 Market Segmentation by Technology
- 8.1 Market segments
- Chart on Technology - Market share 2024-2029 (%)
- Data Table on Technology - Market share 2024-2029 (%)
- 8.2 Comparison by Technology
- Chart on Comparison by Technology
- Data Table on Comparison by Technology
- 8.3 Laser - Market size and forecast 2024-2029
- Chart on Laser - Market size and forecast 2024-2029 ($ million)
- Data Table on Laser - Market size and forecast 2024-2029 ($ million)
- Chart on Laser - Year-over-year growth 2024-2029 (%)
- Data Table on Laser - Year-over-year growth 2024-2029 (%)
- 8.4 Inkjet - Market size and forecast 2024-2029
- Chart on Inkjet - Market size and forecast 2024-2029 ($ million)
- Data Table on Inkjet - Market size and forecast 2024-2029 ($ million)
- Chart on Inkjet - Year-over-year growth 2024-2029 (%)
- Data Table on Inkjet - Year-over-year growth 2024-2029 (%)
- 8.5 Others - Market size and forecast 2024-2029
- Chart on Others - Market size and forecast 2024-2029 ($ million)
- Data Table on Others - Market size and forecast 2024-2029 ($ million)
- Chart on Others - Year-over-year growth 2024-2029 (%)
- Data Table on Others - Year-over-year growth 2024-2029 (%)
- 8.6 Market opportunity by Technology
- Market opportunity by Technology ($ million)
- Data Table on Market opportunity by Technology ($ million)
9 Market Segmentation by Type
- 9.1 Market segments
- Chart on Type - Market share 2024-2029 (%)
- Data Table on Type - Market share 2024-2029 (%)
- 9.2 Comparison by Type
- Chart on Comparison by Type
- Data Table on Comparison by Type
- 9.3 Multifunction printers - Market size and forecast 2024-2029
- Chart on Multifunction printers - Market size and forecast 2024-2029 ($ million)
- Data Table on Multifunction printers - Market size and forecast 2024-2029 ($ million)
- Chart on Multifunction printers - Year-over-year growth 2024-2029 (%)
- Data Table on Multifunction printers - Year-over-year growth 2024-2029 (%)
- 9.4 Single function printers - Market size and forecast 2024-2029
- Chart on Single function printers - Market size and forecast 2024-2029 ($ million)
- Data Table on Single function printers - Market size and forecast 2024-2029 ($ million)
- Chart on Single function printers - Year-over-year growth 2024-2029 (%)
- Data Table on Single function printers - Year-over-year growth 2024-2029 (%)
- 9.5 Market opportunity by Type
- Market opportunity by Type ($ million)
- Data Table on Market opportunity by Type ($ million)
10 Customer Landscape
- 10.1 Customer landscape overview
- Analysis of price sensitivity, lifecycle, customer purchase basket, adoption rates, and purchase criteria
11 Geographic Landscape
- 11.1 Geographic segmentation
- Chart on Market share By Geographical Landscape 2024-2029 (%)
- Data Table on Market share By Geographical Landscape 2024-2029 (%)
- 11.2 Geographic comparison
- Chart on Geographic comparison
- Data Table on Geographic comparison
- 11.3 APAC - Market size and forecast 2024-2029
- Chart on APAC - Market size and forecast 2024-2029 ($ million)
- Data Table on APAC - Market size and forecast 2024-2029 ($ million)
- Chart on APAC - Year-over-year growth 2024-2029 (%)
- Data Table on APAC - Year-over-year growth 2024-2029 (%)
- 11.4 Europe - Market size and forecast 2024-2029
- Chart on Europe - Market size and forecast 2024-2029 ($ million)
- Data Table on Europe - Market size and forecast 2024-2029 ($ million)
- Chart on Europe - Year-over-year growth 2024-2029 (%)
- Data Table on Europe - Year-over-year growth 2024-2029 (%)
- 11.5 North America - Market size and forecast 2024-2029
- Chart on North America - Market size and forecast 2024-2029 ($ million)
- Data Table on North America - Market size and forecast 2024-2029 ($ million)
- Chart on North America - Year-over-year growth 2024-2029 (%)
- Data Table on North America - Year-over-year growth 2024-2029 (%)
- 11.6 South America - Market size and forecast 2024-2029
- Chart on South America - Market size and forecast 2024-2029 ($ million)
- Data Table on South America - Market size and forecast 2024-2029 ($ million)
- Chart on South America - Year-over-year growth 2024-2029 (%)
- Data Table on South America - Year-over-year growth 2024-2029 (%)
- 11.7 Middle East and Africa - Market size and forecast 2024-2029
- Chart on Middle East and Africa - Market size and forecast 2024-2029 ($ million)
- Data Table on Middle East and Africa - Market size and forecast 2024-2029 ($ million)
- Chart on Middle East and Africa - Year-over-year growth 2024-2029 (%)
- Data Table on Middle East and Africa - Year-over-year growth 2024-2029 (%)
- 11.8 US - Market size and forecast 2024-2029
- Chart on US - Market size and forecast 2024-2029 ($ million)
- Data Table on US - Market size and forecast 2024-2029 ($ million)
- Chart on US - Year-over-year growth 2024-2029 (%)
- Data Table on US - Year-over-year growth 2024-2029 (%)
- 11.9 China - Market size and forecast 2024-2029
- Chart on China - Market size and forecast 2024-2029 ($ million)
- Data Table on China - Market size and forecast 2024-2029 ($ million)
- Chart on China - Year-over-year growth 2024-2029 (%)
- Data Table on China - Year-over-year growth 2024-2029 (%)
- 11.10 Germany - Market size and forecast 2024-2029
- Chart on Germany - Market size and forecast 2024-2029 ($ million)
- Data Table on Germany - Market size and forecast 2024-2029 ($ million)
- Chart on Germany - Year-over-year growth 2024-2029 (%)
- Data Table on Germany - Year-over-year growth 2024-2029 (%)
- 11.11 Japan - Market size and forecast 2024-2029
- Chart on Japan - Market size and forecast 2024-2029 ($ million)
- Data Table on Japan - Market size and forecast 2024-2029 ($ million)
- Chart on Japan - Year-over-year growth 2024-2029 (%)
- Data Table on Japan - Year-over-year growth 2024-2029 (%)
- 11.12 India - Market size and forecast 2024-2029
- Chart on India - Market size and forecast 2024-2029 ($ million)
- Data Table on India - Market size and forecast 2024-2029 ($ million)
- Chart on India - Year-over-year growth 2024-2029 (%)
- Data Table on India - Year-over-year growth 2024-2029 (%)
- 11.13 UK - Market size and forecast 2024-2029
- Chart on UK - Market size and forecast 2024-2029 ($ million)
- Data Table on UK - Market size and forecast 2024-2029 ($ million)
- Chart on UK - Year-over-year growth 2024-2029 (%)
- Data Table on UK - Year-over-year growth 2024-2029 (%)
- 11.14 South Korea - Market size and forecast 2024-2029
- Chart on South Korea - Market size and forecast 2024-2029 ($ million)
- Data Table on South Korea - Market size and forecast 2024-2029 ($ million)
- Chart on South Korea - Year-over-year growth 2024-2029 (%)
- Data Table on South Korea - Year-over-year growth 2024-2029 (%)
- 11.15 France - Market size and forecast 2024-2029
- Chart on France - Market size and forecast 2024-2029 ($ million)
- Data Table on France - Market size and forecast 2024-2029 ($ million)
- Chart on France - Year-over-year growth 2024-2029 (%)
- Data Table on France - Year-over-year growth 2024-2029 (%)
- 11.16 Brazil - Market size and forecast 2024-2029
- Chart on Brazil - Market size and forecast 2024-2029 ($ million)
- Data Table on Brazil - Market size and forecast 2024-2029 ($ million)
- Chart on Brazil - Year-over-year growth 2024-2029 (%)
- Data Table on Brazil - Year-over-year growth 2024-2029 (%)
- 11.17 Italy - Market size and forecast 2024-2029
- Chart on Italy - Market size and forecast 2024-2029 ($ million)
- Data Table on Italy - Market size and forecast 2024-2029 ($ million)
- Chart on Italy - Year-over-year growth 2024-2029 (%)
- Data Table on Italy - Year-over-year growth 2024-2029 (%)
- 11.18 Market opportunity By Geographical Landscape
- Market opportunity By Geographical Landscape ($ million)
- Data Tables on Market opportunity By Geographical Landscape ($ million)
12 Drivers, Challenges, and Opportunity/Restraints
- 12.1 Market drivers
- 12.2 Market challenges
- 12.3 Impact of drivers and challenges
- Impact of drivers and challenges in 2024 and 2029
- 12.4 Market opportunities/restraints
13 Competitive Landscape
- 13.1 Overview
- 13.2 Competitive Landscape
- Overview on criticality of inputs and factors of differentiation
- 13.3 Landscape disruption
- Overview on factors of disruption
- 13.4 Industry risks
- Impact of key risks on business
14 Competitive Analysis
- 14.1 Companies profiled
- Companies covered
- 14.2 Company ranking index
- Company ranking index
- 14.3 Market positioning of companies
- Matrix on companies position and classification
- 14.4 Brother Industries Ltd.
- Brother Industries Ltd. - Overview
- Brother Industries Ltd. - Business segments
- Brother Industries Ltd. - Key news
- Brother Industries Ltd. - Key offerings
- Brother Industries Ltd. - Segment focus
- SWOT
- 14.5 Canon Inc.
- Canon Inc. - Overview
- Canon Inc. - Business segments
- Canon Inc. - Key news
- Canon Inc. - Key offerings
- Canon Inc. - Segment focus
- SWOT
- 14.6 Dell Technologies Inc.
- Dell Technologies Inc. - Overview
- Dell Technologies Inc. - Business segments
- Dell Technologies Inc. - Key news
- Dell Technologies Inc. - Key offerings
- Dell Technologies Inc. - Segment focus
- SWOT
- 14.7 Fujitsu Ltd.
- Fujitsu Ltd. - Overview
- Fujitsu Ltd. - Business segments
- Fujitsu Ltd. - Key news
- Fujitsu Ltd. - Key offerings
- Fujitsu Ltd. - Segment focus
- SWOT
- 14.8 HP Inc.
- HP Inc. - Overview
- HP Inc. - Business segments
- HP Inc. - Key news
- HP Inc. - Key offerings
- HP Inc. - Segment focus
- SWOT
- 14.9 Konica Minolta Inc.
- Konica Minolta Inc. - Overview
- Konica Minolta Inc. - Business segments
- Konica Minolta Inc. - Key news
- Konica Minolta Inc. - Key offerings
- Konica Minolta Inc. - Segment focus
- SWOT
- 14.10 KYOCERA Corp.
- KYOCERA Corp. - Overview
- KYOCERA Corp. - Business segments
- KYOCERA Corp. - Key news
- KYOCERA Corp. - Key offerings
- KYOCERA Corp. - Segment focus
- SWOT
- 14.11 Lexmark International Inc.
- Lexmark International Inc. - Overview
- Lexmark International Inc. - Product / Service
- Lexmark International Inc. - Key news
- Lexmark International Inc. - Key offerings
- SWOT
- 14.12 Oki Electric Industry Co. Ltd.
- Oki Electric Industry Co. Ltd. - Overview
- Oki Electric Industry Co. Ltd. - Business segments
- Oki Electric Industry Co. Ltd. - Key news
- Oki Electric Industry Co. Ltd. - Key offerings
- Oki Electric Industry Co. Ltd. - Segment focus
- SWOT
- 14.13 Panasonic Holdings Corp.
- Panasonic Holdings Corp. - Overview
- Panasonic Holdings Corp. - Business segments
- Panasonic Holdings Corp. - Key news
- Panasonic Holdings Corp. - Key offerings
- Panasonic Holdings Corp. - Segment focus
- SWOT
- 14.14 Ricoh Co. Ltd.
- Ricoh Co. Ltd. - Overview
- Ricoh Co. Ltd. - Business segments
- Ricoh Co. Ltd. - Key news
- Ricoh Co. Ltd. - Key offerings
- Ricoh Co. Ltd. - Segment focus
- SWOT
- 14.15 Seiko Epson Corp.
- Seiko Epson Corp. - Overview
- Seiko Epson Corp. - Business segments
- Seiko Epson Corp. - Key news
- Seiko Epson Corp. - Key offerings
- Seiko Epson Corp. - Segment focus
- SWOT
- 14.16 Sharp Corp.
- Sharp Corp. - Overview
- Sharp Corp. - Business segments
- Sharp Corp. - Key news
- Sharp Corp. - Key offerings
- Sharp Corp. - Segment focus
- SWOT
- 14.17 Toshiba Corp.
- Toshiba Corp. - Overview
- Toshiba Corp. - Business segments
- Toshiba Corp. - Key news
- Toshiba Corp. - Key offerings
- Toshiba Corp. - Segment focus
- SWOT
- 14.18 Xerox Holdings Corp.
- Xerox Holdings Corp. - Overview
- Xerox Holdings Corp. - Business segments
- Xerox Holdings Corp. - Key news
- Xerox Holdings Corp. - Key offerings
- Xerox Holdings Corp. - Segment focus
- SWOT
15 Appendix
- 15.1 Scope of the report
- 15.2 Inclusions and exclusions checklist
- Inclusions checklist
- Exclusions checklist
- 15.3 Currency conversion rates for US$
- Currency conversion rates for US$
- 15.4 Research methodology
- Research methodology
- 15.5 Data procurement
- Information sources
- 15.6 Data validation
- Data validation
- 15.7 Validation techniques employed for market sizing
- Validation techniques employed for market sizing
- 15.8 Data synthesis
- Data synthesis
- 15.9 360 degree market analysis
- 360 degree market analysis
- 15.10 List of abbreviations
- List of abbreviations
