|
|
市場調査レポート
商品コード
1502233
ホワイトボックス・サーバーの世界市場 2024-2028Global white-box server market 2024-2028 |
||||||
|
|||||||
カスタマイズ可能
|
|||||||

| ホワイトボックス・サーバーの世界市場 2024-2028 |
|
出版日: 2024年05月17日
発行: TechNavio
ページ情報: 英文 170 Pages
納期: 即納可能
|

全表示
- 概要
- 図表
- 目次
Technavio社はホワイトボックス・サーバー市場を調査し、2023年から2028年にかけて722億180万米ドル、予測期間中のCAGRは26.97%で成長すると予測しています。
当レポートでは、ホワイトボックス・サーバー市場の全体的な分析、市場規模・予測、動向、成長促進要因、課題、約25のベンダーを網羅したベンダー分析などを掲載しています。
現在の市場シナリオ、最新動向と促進要因、市場環境全体に関する最新分析を提供しています。ミニデータセンターの出現、オープンコンピュートプロジェクト基盤による新興国市場の開発の増加、ホワイトボックスサーバーによるエネルギー消費の削減などが市場を牽引しています。
| 市場範囲 | |
|---|---|
| 基準年 | 2024 |
| 終了年 | 2028 |
| 予測期間 | 2024-2028 |
| 成長モメンタム | 加速 |
| 前年比2024年 | 20.86% |
| CAGR | 26.97% |
| 増分額 | 722億180万米ドル |
本調査では、グリーンでエネルギー効率に優れたデータセンターの建設が、今後数年間のホワイトボックス・サーバー市場成長を牽引する主要因の1つであると分析しています。また、大規模な反復タスクを実行するためのホワイトボックスサーバーの採用が大企業で増加していることや、SSDCの迅速な導入が市場の大きな需要につながると思われます。
目次
第1章 エグゼクティブサマリー
- 市場概要
第2章 市場情勢
- 市場エコシステム
- 市場の特徴
- バリューチェーン分析
第3章 市場規模の評価
- 市場の定義
- 市場セグメント分析
- 市場規模 2023
- 市場の見通し 2023-2028
第4章 市場規模実績
- 世界ホワイトボックス・サーバー市場 2018-2022
- エンドユーザー別セグメント分析 2018-2022
- タイプ別セグメント分析 2018-2022
- 地域別セグメント分析 2018-2022
- 国別セグメント分析 2018-2022
第5章 ファイブフォース分析
- ファイブフォースの要約
- 買い手の交渉力
- 供給企業の交渉力
- 新規参入業者の脅威
- 代替品の脅威
- 競争の脅威
- 市況
第6章 市場セグメンテーション:エンドユーザー別
- 市場セグメンテーション
- 比較:エンドユーザー別
- データセンター:市場規模と予測 2023-2028
- 中小企業と大企業:市場規模と予測 2023-2028
- 市場機会:エンドユーザー別
第7章 市場セグメンテーション:タイプ別
- 市場セグメンテーション
- 比較:タイプ別
- ラックサーバーとタワーサーバー:市場規模と予測 2023-2028
- ブレードサーバー:市場規模と予測 2023-2028
- 密度最適化サーバー:市場規模と予測 2023-2028
- 市場機会:タイプ別
第8章 顧客情勢
- 顧客情勢の概要
第9章 地域別情勢
- 地域別セグメンテーション
- 地域別比較
- 北米:市場規模と予測 2023-2028
- アジア太平洋:市場規模と予測 2023-2028
- 欧州:市場規模と予測 2023-2028
- 南米:市場規模と予測 2023-2028
- 中東・アフリカ:市場規模と予測 2023-2028
- 米国:市場規模と予測 2023-2028
- 中国:市場規模と予測 2023-2028
- 日本:市場規模と予測 2023-2028
- 英国:市場規模と予測 2023-2028
- インド:市場規模と予測 2023-2028
- 市場機会:地域別
第10章 促進要因・課題・機会・抑制要因
- 市場促進要因
- 市場の課題
- 促進要因と課題の影響
- 市場の機会・抑制要因
第11章 競合情勢
- 概要
- 競合情勢
- 混乱の状況
- 業界のリスク
第12章 競合分析
- 企業プロファイル
- 企業の市場ポジショニング
- Cisco Systems Inc.
- Equus Computer Systems Inc.
- Fujitsu Ltd.
- Happyware Server Europe GmbH
- Hon Hai Precision Industry Co. Ltd.
- Huawei Technologies Co. Ltd.
- Inspur Systems Inc.
- Intel Corp.
- Inventec Corp.
- Jabil Inc.
- MiTAC Holdings Corp.
- Servers Direct
- Super Micro Computer Inc.
- Whitestack
- Wistron Corp.
第13章 付録
Exhibits:
- Exhibits1: Executive Summary - Chart on Market Overview
- Exhibits2: Executive Summary - Data Table on Market Overview
- Exhibits3: Executive Summary - Chart on Global Market Characteristics
- Exhibits4: Executive Summary - Chart on Market by Geography
- Exhibits5: Executive Summary - Chart on Market Segmentation by End-user
- Exhibits6: Executive Summary - Chart on Market Segmentation by Type
- Exhibits7: Executive Summary - Chart on Incremental Growth
- Exhibits8: Executive Summary - Data Table on Incremental Growth
- Exhibits9: Executive Summary - Chart on Company Market Positioning
- Exhibits10: Parent Market
- Exhibits11: Data Table on - Parent Market
- Exhibits12: Market characteristics analysis
- Exhibits13: Value Chain Analysis
- Exhibits14: Offerings of companies included in the market definition
- Exhibits15: Market segments
- Exhibits16: Chart on Global - Market size and forecast 2023-2028 ($ million)
- Exhibits17: Data Table on Global - Market size and forecast 2023-2028 ($ million)
- Exhibits18: Chart on Global Market: Year-over-year growth 2023-2028 (%)
- Exhibits19: Data Table on Global Market: Year-over-year growth 2023-2028 (%)
- Exhibits20: Historic Market Size - Data Table on Global White-Box Server Market 2018 - 2022 ($ million)
- Exhibits21: Historic Market Size - End-user Segment 2018 - 2022 ($ million)
- Exhibits22: Historic Market Size - Type Segment 2018 - 2022 ($ million)
- Exhibits23: Historic Market Size - Geography Segment 2018 - 2022 ($ million)
- Exhibits24: Historic Market Size - Country Segment 2018 - 2022 ($ million)
- Exhibits25: Five forces analysis - Comparison between 2023 and 2028
- Exhibits26: Bargaining power of buyers - Impact of key factors 2023 and 2028
- Exhibits27: Bargaining power of suppliers - Impact of key factors in 2023 and 2028
- Exhibits28: Threat of new entrants - Impact of key factors in 2023 and 2028
- Exhibits29: Threat of substitutes - Impact of key factors in 2023 and 2028
- Exhibits30: Threat of rivalry - Impact of key factors in 2023 and 2028
- Exhibits31: Chart on Market condition - Five forces 2023 and 2028
- Exhibits32: Chart on End-user - Market share 2023-2028 (%)
- Exhibits33: Data Table on End-user - Market share 2023-2028 (%)
- Exhibits34: Chart on Comparison by End-user
- Exhibits35: Data Table on Comparison by End-user
- Exhibits36: Chart on Data centers - Market size and forecast 2023-2028 ($ million)
- Exhibits37: Data Table on Data centers - Market size and forecast 2023-2028 ($ million)
- Exhibits38: Chart on Data centers - Year-over-year growth 2023-2028 (%)
- Exhibits39: Data Table on Data centers - Year-over-year growth 2023-2028 (%)
- Exhibits40: Chart on SME and large enterprises - Market size and forecast 2023-2028 ($ million)
- Exhibits41: Data Table on SME and large enterprises - Market size and forecast 2023-2028 ($ million)
- Exhibits42: Chart on SME and large enterprises - Year-over-year growth 2023-2028 (%)
- Exhibits43: Data Table on SME and large enterprises - Year-over-year growth 2023-2028 (%)
- Exhibits44: Market opportunity by End-user ($ million)
- Exhibits45: Data Table on Market opportunity by End-user ($ million)
- Exhibits46: Chart on Type - Market share 2023-2028 (%)
- Exhibits47: Data Table on Type - Market share 2023-2028 (%)
- Exhibits48: Chart on Comparison by Type
- Exhibits49: Data Table on Comparison by Type
- Exhibits50: Chart on Rack and tower servers - Market size and forecast 2023-2028 ($ million)
- Exhibits51: Data Table on Rack and tower servers - Market size and forecast 2023-2028 ($ million)
- Exhibits52: Chart on Rack and tower servers - Year-over-year growth 2023-2028 (%)
- Exhibits53: Data Table on Rack and tower servers - Year-over-year growth 2023-2028 (%)
- Exhibits54: Chart on Blade servers - Market size and forecast 2023-2028 ($ million)
- Exhibits55: Data Table on Blade servers - Market size and forecast 2023-2028 ($ million)
- Exhibits56: Chart on Blade servers - Year-over-year growth 2023-2028 (%)
- Exhibits57: Data Table on Blade servers - Year-over-year growth 2023-2028 (%)
- Exhibits58: Chart on Density optimized servers - Market size and forecast 2023-2028 ($ million)
- Exhibits59: Data Table on Density optimized servers - Market size and forecast 2023-2028 ($ million)
- Exhibits60: Chart on Density optimized servers - Year-over-year growth 2023-2028 (%)
- Exhibits61: Data Table on Density optimized servers - Year-over-year growth 2023-2028 (%)
- Exhibits62: Market opportunity by Type ($ million)
- Exhibits63: Data Table on Market opportunity by Type ($ million)
- Exhibits64: Analysis of price sensitivity, lifecycle, customer purchase basket, adoption rates, and purchase criteria
- Exhibits65: Chart on Market share By Geographical Landscape2023-2028 (%)
- Exhibits66: Data Table on Market share By Geographical Landscape2023-2028 (%)
- Exhibits67: Chart on Geographic comparison
- Exhibits68: Data Table on Geographic comparison
- Exhibits69: Chart on North America - Market size and forecast 2023-2028 ($ million)
- Exhibits70: Data Table on North America - Market size and forecast 2023-2028 ($ million)
- Exhibits71: Chart on North America - Year-over-year growth 2023-2028 (%)
- Exhibits72: Data Table on North America - Year-over-year growth 2023-2028 (%)
- Exhibits73: Chart on APAC - Market size and forecast 2023-2028 ($ million)
- Exhibits74: Data Table on APAC - Market size and forecast 2023-2028 ($ million)
- Exhibits75: Chart on APAC - Year-over-year growth 2023-2028 (%)
- Exhibits76: Data Table on APAC - Year-over-year growth 2023-2028 (%)
- Exhibits77: Chart on Europe - Market size and forecast 2023-2028 ($ million)
- Exhibits78: Data Table on Europe - Market size and forecast 2023-2028 ($ million)
- Exhibits79: Chart on Europe - Year-over-year growth 2023-2028 (%)
- Exhibits80: Data Table on Europe - Year-over-year growth 2023-2028 (%)
- Exhibits81: Chart on South America - Market size and forecast 2023-2028 ($ million)
- Exhibits82: Data Table on South America - Market size and forecast 2023-2028 ($ million)
- Exhibits83: Chart on South America - Year-over-year growth 2023-2028 (%)
- Exhibits84: Data Table on South America - Year-over-year growth 2023-2028 (%)
- Exhibits85: Chart on Middle East and Africa - Market size and forecast 2023-2028 ($ million)
- Exhibits86: Data Table on Middle East and Africa - Market size and forecast 2023-2028 ($ million)
- Exhibits87: Chart on Middle East and Africa - Year-over-year growth 2023-2028 (%)
- Exhibits88: Data Table on Middle East and Africa - Year-over-year growth 2023-2028 (%)
- Exhibits89: Chart on US - Market size and forecast 2023-2028 ($ million)
- Exhibits90: Data Table on US - Market size and forecast 2023-2028 ($ million)
- Exhibits91: Chart on US - Year-over-year growth 2023-2028 (%)
- Exhibits92: Data Table on US - Year-over-year growth 2023-2028 (%)
- Exhibits93: Chart on China - Market size and forecast 2023-2028 ($ million)
- Exhibits94: Data Table on China - Market size and forecast 2023-2028 ($ million)
- Exhibits95: Chart on China - Year-over-year growth 2023-2028 (%)
- Exhibits96: Data Table on China - Year-over-year growth 2023-2028 (%)
- Exhibits97: Chart on Japan - Market size and forecast 2023-2028 ($ million)
- Exhibits98: Data Table on Japan - Market size and forecast 2023-2028 ($ million)
- Exhibits99: Chart on Japan - Year-over-year growth 2023-2028 (%)
- Exhibits100: Data Table on Japan - Year-over-year growth 2023-2028 (%)
- Exhibits101: Chart on UK - Market size and forecast 2023-2028 ($ million)
- Exhibits102: Data Table on UK - Market size and forecast 2023-2028 ($ million)
- Exhibits103: Chart on UK - Year-over-year growth 2023-2028 (%)
- Exhibits104: Data Table on UK - Year-over-year growth 2023-2028 (%)
- Exhibits105: Chart on India - Market size and forecast 2023-2028 ($ million)
- Exhibits106: Data Table on India - Market size and forecast 2023-2028 ($ million)
- Exhibits107: Chart on India - Year-over-year growth 2023-2028 (%)
- Exhibits108: Data Table on India - Year-over-year growth 2023-2028 (%)
- Exhibits109: Market opportunity By Geographical Landscape($ million)
- Exhibits110: Data Tables on Market opportunity By Geographical Landscape($ million)
- Exhibits111: Impact of drivers and challenges in 2023 and 2028
- Exhibits112: Overview on criticality of inputs and factors of differentiation
- Exhibits113: Overview on factors of disruption
- Exhibits114: Impact of key risks on business
- Exhibits115: Companies covered
- Exhibits116: Matrix on companies position and classification
- Exhibits117: Cisco Systems Inc. - Overview
- Exhibits118: Cisco Systems Inc. - Business segments
- Exhibits119: Cisco Systems Inc. - Key news
- Exhibits120: Cisco Systems Inc. - Key offerings
- Exhibits121: Cisco Systems Inc. - Segment focus
- Exhibits122: Equus Computer Systems Inc. - Overview
- Exhibits123: Equus Computer Systems Inc. - Product / Service
- Exhibits124: Equus Computer Systems Inc. - Key offerings
- Exhibits125: Fujitsu Ltd. - Overview
- Exhibits126: Fujitsu Ltd. - Business segments
- Exhibits127: Fujitsu Ltd. - Key news
- Exhibits128: Fujitsu Ltd. - Key offerings
- Exhibits129: Fujitsu Ltd. - Segment focus
- Exhibits130: Happyware Server Europe GmbH - Overview
- Exhibits131: Happyware Server Europe GmbH - Product / Service
- Exhibits132: Happyware Server Europe GmbH - Key offerings
- Exhibits133: Hon Hai Precision Industry Co. Ltd. - Overview
- Exhibits134: Hon Hai Precision Industry Co. Ltd. - Product / Service
- Exhibits135: Hon Hai Precision Industry Co. Ltd. - Key offerings
- Exhibits136: Huawei Technologies Co. Ltd. - Overview
- Exhibits137: Huawei Technologies Co. Ltd. - Product / Service
- Exhibits138: Huawei Technologies Co. Ltd. - Key news
- Exhibits139: Huawei Technologies Co. Ltd. - Key offerings
- Exhibits140: Inspur Systems Inc. - Overview
- Exhibits141: Inspur Systems Inc. - Product / Service
- Exhibits142: Inspur Systems Inc. - Key offerings
- Exhibits143: Intel Corp. - Overview
- Exhibits144: Intel Corp. - Business segments
- Exhibits145: Intel Corp. - Key news
- Exhibits146: Intel Corp. - Key offerings
- Exhibits147: Intel Corp. - Segment focus
- Exhibits148: Inventec Corp. - Overview
- Exhibits149: Inventec Corp. - Business segments
- Exhibits150: Inventec Corp. - Key offerings
- Exhibits151: Inventec Corp. - Segment focus
- Exhibits152: Jabil Inc. - Overview
- Exhibits153: Jabil Inc. - Business segments
- Exhibits154: Jabil Inc. - Key news
- Exhibits155: Jabil Inc. - Key offerings
- Exhibits156: Jabil Inc. - Segment focus
- Exhibits157: MiTAC Holdings Corp. - Overview
- Exhibits158: MiTAC Holdings Corp. - Business segments
- Exhibits159: MiTAC Holdings Corp. - Key news
- Exhibits160: MiTAC Holdings Corp. - Key offerings
- Exhibits161: MiTAC Holdings Corp. - Segment focus
- Exhibits162: Servers Direct - Overview
- Exhibits163: Servers Direct - Product / Service
- Exhibits164: Servers Direct - Key offerings
- Exhibits165: Super Micro Computer Inc. - Overview
- Exhibits166: Super Micro Computer Inc. - Business segments
- Exhibits167: Super Micro Computer Inc. - Key news
- Exhibits168: Super Micro Computer Inc. - Key offerings
- Exhibits169: Super Micro Computer Inc. - Segment focus
- Exhibits170: Whitestack - Overview
- Exhibits171: Whitestack - Product / Service
- Exhibits172: Whitestack - Key offerings
- Exhibits173: Wistron Corp. - Overview
- Exhibits174: Wistron Corp. - Business segments
- Exhibits175: Wistron Corp. - Key offerings
- Exhibits176: Wistron Corp. - Segment focus
- Exhibits177: Inclusions checklist
- Exhibits178: Exclusions checklist
- Exhibits179: Currency conversion rates for US$
- Exhibits180: Research methodology
- Exhibits181: Information sources
- Exhibits182: Data validation
- Exhibits183: Validation techniques employed for market sizing
- Exhibits184: Data synthesis
- Exhibits185: 360 degree market analysis
- Exhibits186: List of abbreviations
Technavio has been monitoring the white-box server market and is forecast to grow by USD 72201.8 mn during 2023-2028, accelerating at a CAGR of 26.97% during the forecast period. Our report on the white-box server market provides a holistic analysis, market size and forecast, trends, growth drivers, and challenges, as well as vendor analysis covering around 25 vendors.
The report offers an up-to-date analysis regarding the current market scenario, the latest trends and drivers, and the overall market environment. The market is driven by emergence of mini data centers, increasing developments through open compute project foundation, and reduced energy consumption by white-box servers.
Technavio's white-box server market is segmented as below:
| Market Scope | |
|---|---|
| Base Year | 2024 |
| End Year | 2028 |
| Series Year | 2024-2028 |
| Growth Momentum | Accelerate |
| YOY 2024 | 20.86% |
| CAGR | 26.97% |
| Incremental Value | $72201.8mn |
By End-user
- Data centers
- SME and large enterprises
By Type
- Rack and tower servers
- Blade servers
- Density optimized servers
By Geography
- North America
- APAC
- Europe
- South America
- Middle East and Africa
This study identifies the construction of green and energy-efficient data centers as one of the prime reasons driving the white-box server market growth during the next few years. Also, increasing adoption of white-box servers among larger organizations to perform mass-scale repetitive tasks and rapid implementation of ssdcs will lead to sizable demand in the market.
Technavio presents a detailed picture of the market by the way of study, synthesis, and summation of data from multiple sources by an analysis of key parameters. Our report on the white-box server market covers the following areas:
- White-box server market sizing
- White-box server market forecast
- White-box server market industry analysis
Technavio's robust vendor analysis is designed to help clients improve their market position, and in line with this, this report provides a detailed analysis of several leading white-box server market vendors that include Cisco Systems Inc., Equus Computer Systems Inc., Fujitsu Ltd., Happyware Server Europe GmbH, Hon Hai Precision Industry Co. Ltd., Huawei Technologies Co. Ltd., Hyve Solutions Corp., Inspur Systems Inc., Intel Corp., Inventec Corp., Jabil Inc., MiTAC Holdings Corp., Penguin Solutions, Quanta Computer Inc., Servers Direct, Silicon Mechanics, Super Micro Computer Inc., Whitestack, Wistron Corp., and ZT Systems. Also, the white-box server market analysis report includes information on upcoming trends and challenges that will influence market growth. This is to help companies strategize and leverage all forthcoming growth opportunities.
The study was conducted using an objective combination of primary and secondary information including inputs from key participants in the industry. The report contains a comprehensive market and vendor landscape in addition to an analysis of the key vendors.
Technavio presents a detailed picture of the market by the way of study, synthesis, and summation of data from multiple sources by an analysis of key parameters such as profit, pricing, competition, and promotions. It presents various market facets by identifying the key industry influencers. The data presented is comprehensive, reliable, and a result of extensive research - both primary and secondary. Technavio's market research reports provide a complete competitive landscape and an in-depth vendor selection methodology and analysis using qualitative and quantitative research to forecast accurate market growth.
Table of Contents
1 Executive Summary
- 1.1 Market overview
- Executive Summary - Chart on Market Overview
- Executive Summary - Data Table on Market Overview
- Executive Summary - Chart on Global Market Characteristics
- Executive Summary - Chart on Market by Geography
- Executive Summary - Chart on Market Segmentation by End-user
- Executive Summary - Chart on Market Segmentation by Type
- Executive Summary - Chart on Incremental Growth
- Executive Summary - Data Table on Incremental Growth
- Executive Summary - Chart on Company Market Positioning
2 Market Landscape
- 2.1 Market ecosystem
- Parent Market
- Data Table on - Parent Market
- 2.2 Market characteristics
- Market characteristics analysis
- 2.3 Value chain analysis
- Value Chain Analysis
3 Market Sizing
- 3.1 Market definition
- Offerings of companies included in the market definition
- 3.2 Market segment analysis
- Market segments
- 3.3 Market size 2023
- 3.4 Market outlook: Forecast for 2023-2028
- Chart on Global - Market size and forecast 2023-2028 ($ million)
- Data Table on Global - Market size and forecast 2023-2028 ($ million)
- Chart on Global Market: Year-over-year growth 2023-2028 (%)
- Data Table on Global Market: Year-over-year growth 2023-2028 (%)
4 Historic Market Size
- 4.1 Global White-Box Server Market 2018 - 2022
- Historic Market Size - Data Table on Global White-Box Server Market 2018 - 2022 ($ million)
- 4.2 End-user segment analysis 2018 - 2022
- Historic Market Size - End-user Segment 2018 - 2022 ($ million)
- 4.3 Type segment analysis 2018 - 2022
- Historic Market Size - Type Segment 2018 - 2022 ($ million)
- 4.4 Geography segment analysis 2018 - 2022
- Historic Market Size - Geography Segment 2018 - 2022 ($ million)
- 4.5 Country segment analysis 2018 - 2022
- Historic Market Size - Country Segment 2018 - 2022 ($ million)
5 Five Forces Analysis
- 5.1 Five forces summary
- Five forces analysis - Comparison between 2023 and 2028
- 5.2 Bargaining power of buyers
- Bargaining power of buyers - Impact of key factors 2023 and 2028
- 5.3 Bargaining power of suppliers
- Bargaining power of suppliers - Impact of key factors in 2023 and 2028
- 5.4 Threat of new entrants
- Threat of new entrants - Impact of key factors in 2023 and 2028
- 5.5 Threat of substitutes
- Threat of substitutes - Impact of key factors in 2023 and 2028
- 5.6 Threat of rivalry
- Threat of rivalry - Impact of key factors in 2023 and 2028
- 5.7 Market condition
- Chart on Market condition - Five forces 2023 and 2028
6 Market Segmentation by End-user
- 6.1 Market segments
- Chart on End-user - Market share 2023-2028 (%)
- Data Table on End-user - Market share 2023-2028 (%)
- 6.2 Comparison by End-user
- Chart on Comparison by End-user
- Data Table on Comparison by End-user
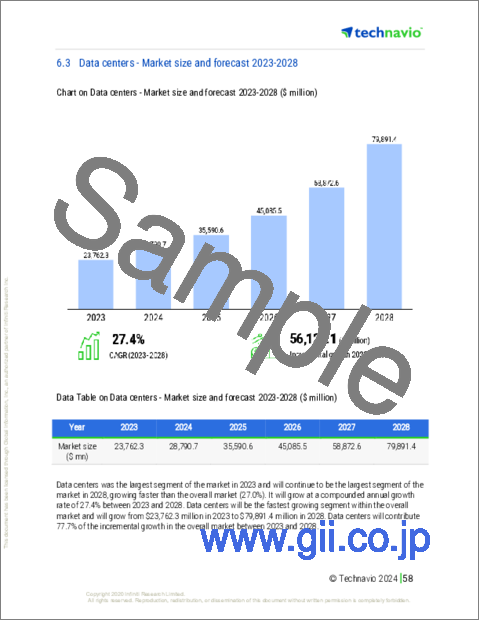
- 6.3 Data centers - Market size and forecast 2023-2028
- Chart on Data centers - Market size and forecast 2023-2028 ($ million)
- Data Table on Data centers - Market size and forecast 2023-2028 ($ million)
- Chart on Data centers - Year-over-year growth 2023-2028 (%)
- Data Table on Data centers - Year-over-year growth 2023-2028 (%)
- 6.4 SME and large enterprises - Market size and forecast 2023-2028
- Chart on SME and large enterprises - Market size and forecast 2023-2028 ($ million)
- Data Table on SME and large enterprises - Market size and forecast 2023-2028 ($ million)
- Chart on SME and large enterprises - Year-over-year growth 2023-2028 (%)
- Data Table on SME and large enterprises - Year-over-year growth 2023-2028 (%)
- 6.5 Market opportunity by End-user
- Market opportunity by End-user ($ million)
- Data Table on Market opportunity by End-user ($ million)
7 Market Segmentation by Type
- 7.1 Market segments
- Chart on Type - Market share 2023-2028 (%)
- Data Table on Type - Market share 2023-2028 (%)
- 7.2 Comparison by Type
- Chart on Comparison by Type
- Data Table on Comparison by Type
- 7.3 Rack and tower servers - Market size and forecast 2023-2028
- Chart on Rack and tower servers - Market size and forecast 2023-2028 ($ million)
- Data Table on Rack and tower servers - Market size and forecast 2023-2028 ($ million)
- Chart on Rack and tower servers - Year-over-year growth 2023-2028 (%)
- Data Table on Rack and tower servers - Year-over-year growth 2023-2028 (%)
- 7.4 Blade servers - Market size and forecast 2023-2028
- Chart on Blade servers - Market size and forecast 2023-2028 ($ million)
- Data Table on Blade servers - Market size and forecast 2023-2028 ($ million)
- Chart on Blade servers - Year-over-year growth 2023-2028 (%)
- Data Table on Blade servers - Year-over-year growth 2023-2028 (%)
- 7.5 Density optimized servers - Market size and forecast 2023-2028
- Chart on Density optimized servers - Market size and forecast 2023-2028 ($ million)
- Data Table on Density optimized servers - Market size and forecast 2023-2028 ($ million)
- Chart on Density optimized servers - Year-over-year growth 2023-2028 (%)
- Data Table on Density optimized servers - Year-over-year growth 2023-2028 (%)
- 7.6 Market opportunity by Type
- Market opportunity by Type ($ million)
- Data Table on Market opportunity by Type ($ million)
8 Customer Landscape
- 8.1 Customer landscape overview
- Analysis of price sensitivity, lifecycle, customer purchase basket, adoption rates, and purchase criteria
9 Geographic Landscape
- 9.1 Geographic segmentation
- Chart on Market share By Geographical Landscape2023-2028 (%)
- Data Table on Market share By Geographical Landscape2023-2028 (%)
- 9.2 Geographic comparison
- Chart on Geographic comparison
- Data Table on Geographic comparison
- 9.3 North America - Market size and forecast 2023-2028
- Chart on North America - Market size and forecast 2023-2028 ($ million)
- Data Table on North America - Market size and forecast 2023-2028 ($ million)
- Chart on North America - Year-over-year growth 2023-2028 (%)
- Data Table on North America - Year-over-year growth 2023-2028 (%)
- 9.4 APAC - Market size and forecast 2023-2028
- Chart on APAC - Market size and forecast 2023-2028 ($ million)
- Data Table on APAC - Market size and forecast 2023-2028 ($ million)
- Chart on APAC - Year-over-year growth 2023-2028 (%)
- Data Table on APAC - Year-over-year growth 2023-2028 (%)
- 9.5 Europe - Market size and forecast 2023-2028
- Chart on Europe - Market size and forecast 2023-2028 ($ million)
- Data Table on Europe - Market size and forecast 2023-2028 ($ million)
- Chart on Europe - Year-over-year growth 2023-2028 (%)
- Data Table on Europe - Year-over-year growth 2023-2028 (%)
- 9.6 South America - Market size and forecast 2023-2028
- Chart on South America - Market size and forecast 2023-2028 ($ million)
- Data Table on South America - Market size and forecast 2023-2028 ($ million)
- Chart on South America - Year-over-year growth 2023-2028 (%)
- Data Table on South America - Year-over-year growth 2023-2028 (%)
- 9.7 Middle East and Africa - Market size and forecast 2023-2028
- Chart on Middle East and Africa - Market size and forecast 2023-2028 ($ million)
- Data Table on Middle East and Africa - Market size and forecast 2023-2028 ($ million)
- Chart on Middle East and Africa - Year-over-year growth 2023-2028 (%)
- Data Table on Middle East and Africa - Year-over-year growth 2023-2028 (%)
- 9.8 US - Market size and forecast 2023-2028
- Chart on US - Market size and forecast 2023-2028 ($ million)
- Data Table on US - Market size and forecast 2023-2028 ($ million)
- Chart on US - Year-over-year growth 2023-2028 (%)
- Data Table on US - Year-over-year growth 2023-2028 (%)
- 9.9 China - Market size and forecast 2023-2028
- Chart on China - Market size and forecast 2023-2028 ($ million)
- Data Table on China - Market size and forecast 2023-2028 ($ million)
- Chart on China - Year-over-year growth 2023-2028 (%)
- Data Table on China - Year-over-year growth 2023-2028 (%)
- 9.10 Japan - Market size and forecast 2023-2028
- Chart on Japan - Market size and forecast 2023-2028 ($ million)
- Data Table on Japan - Market size and forecast 2023-2028 ($ million)
- Chart on Japan - Year-over-year growth 2023-2028 (%)
- Data Table on Japan - Year-over-year growth 2023-2028 (%)
- 9.11 UK - Market size and forecast 2023-2028
- Chart on UK - Market size and forecast 2023-2028 ($ million)
- Data Table on UK - Market size and forecast 2023-2028 ($ million)
- Chart on UK - Year-over-year growth 2023-2028 (%)
- Data Table on UK - Year-over-year growth 2023-2028 (%)
- 9.12 India - Market size and forecast 2023-2028
- Chart on India - Market size and forecast 2023-2028 ($ million)
- Data Table on India - Market size and forecast 2023-2028 ($ million)
- Chart on India - Year-over-year growth 2023-2028 (%)
- Data Table on India - Year-over-year growth 2023-2028 (%)
- 9.13 Market opportunity by geography
- Market opportunity By Geographical Landscape($ million)
- Data Tables on Market opportunity By Geographical Landscape($ million)
10 Drivers, Challenges, and Opportunity/Restraints
- 10.1 Market drivers
- 10.2 Market challenges
- 10.3 Impact of drivers and challenges
- Impact of drivers and challenges in 2023 and 2028
- 10.4 Market opportunities/restraints
11 Competitive Landscape
- 11.1 Overview
- 11.2 Competitive Landscape
- Overview on criticality of inputs and factors of differentiation
- 11.3 Landscape disruption
- Overview on factors of disruption
- 11.4 Industry risks
- Impact of key risks on business
12 Competitive Analysis
- 12.1 Companies profiled
- Companies covered
- 12.2 Market positioning of companies
- Matrix on companies position and classification
- 12.3 Cisco Systems Inc.
- Cisco Systems Inc. - Overview
- Cisco Systems Inc. - Business segments
- Cisco Systems Inc. - Key news
- Cisco Systems Inc. - Key offerings
- Cisco Systems Inc. - Segment focus
- 12.4 Equus Computer Systems Inc.
- Equus Computer Systems Inc. - Overview
- Equus Computer Systems Inc. - Product / Service
- Equus Computer Systems Inc. - Key offerings
- 12.5 Fujitsu Ltd.
- Fujitsu Ltd. - Overview
- Fujitsu Ltd. - Business segments
- Fujitsu Ltd. - Key news
- Fujitsu Ltd. - Key offerings
- Fujitsu Ltd. - Segment focus
- 12.6 Happyware Server Europe GmbH
- Happyware Server Europe GmbH - Overview
- Happyware Server Europe GmbH - Product / Service
- Happyware Server Europe GmbH - Key offerings
- 12.7 Hon Hai Precision Industry Co. Ltd.
- Hon Hai Precision Industry Co. Ltd. - Overview
- Hon Hai Precision Industry Co. Ltd. - Product / Service
- Hon Hai Precision Industry Co. Ltd. - Key offerings
- 12.8 Huawei Technologies Co. Ltd.
- Huawei Technologies Co. Ltd. - Overview
- Huawei Technologies Co. Ltd. - Product / Service
- Huawei Technologies Co. Ltd. - Key news
- Huawei Technologies Co. Ltd. - Key offerings
- 12.9 Inspur Systems Inc.
- Inspur Systems Inc. - Overview
- Inspur Systems Inc. - Product / Service
- Inspur Systems Inc. - Key offerings
- 12.10 Intel Corp.
- Intel Corp. - Overview
- Intel Corp. - Business segments
- Intel Corp. - Key news
- Intel Corp. - Key offerings
- Intel Corp. - Segment focus
- 12.11 Inventec Corp.
- Inventec Corp. - Overview
- Inventec Corp. - Business segments
- Inventec Corp. - Key offerings
- Inventec Corp. - Segment focus
- 12.12 Jabil Inc.
- Jabil Inc. - Overview
- Jabil Inc. - Business segments
- Jabil Inc. - Key news
- Jabil Inc. - Key offerings
- Jabil Inc. - Segment focus
- 12.13 MiTAC Holdings Corp.
- MiTAC Holdings Corp. - Overview
- MiTAC Holdings Corp. - Business segments
- MiTAC Holdings Corp. - Key news
- MiTAC Holdings Corp. - Key offerings
- MiTAC Holdings Corp. - Segment focus
- 12.14 Servers Direct
- Servers Direct - Overview
- Servers Direct - Product / Service
- Servers Direct - Key offerings
- 12.15 Super Micro Computer Inc.
- Super Micro Computer Inc. - Overview
- Super Micro Computer Inc. - Business segments
- Super Micro Computer Inc. - Key news
- Super Micro Computer Inc. - Key offerings
- Super Micro Computer Inc. - Segment focus
- 12.16 Whitestack
- Whitestack - Overview
- Whitestack - Product / Service
- Whitestack - Key offerings
- 12.17 Wistron Corp.
- Wistron Corp. - Overview
- Wistron Corp. - Business segments
- Wistron Corp. - Key offerings
- Wistron Corp. - Segment focus
13 Appendix
- 13.1 Scope of the report
- 13.2 Inclusions and exclusions checklist
- Inclusions checklist
- Exclusions checklist
- 13.3 Currency conversion rates for US$
- Currency conversion rates for US$
- 13.4 Research methodology
- Research methodology
- 13.5 Data procurement
- Information sources
- 13.6 Data validation
- Data validation
- 13.7 Validation techniques employed for market sizing
- Validation techniques employed for market sizing
- 13.8 Data synthesis
- Data synthesis
- 13.9 360 degree market analysis
- 360 degree market analysis
- 13.10 List of abbreviations
- List of abbreviations

