|
|
市場調査レポート
商品コード
1502212
デジタル印刷・染色機の世界市場 2024-2028Global digital printing and dyeing machines market 2024-2028 |
||||||

|
|||||||
カスタマイズ可能
|
|||||||

| デジタル印刷・染色機の世界市場 2024-2028 |
|
出版日: 2024年05月17日
発行: TechNavio
ページ情報: 英文 165 Pages
納期: 即納可能
|

全表示
- 概要
- 図表
- 目次
デジタル印刷・染色機市場は2023-2028年に 105億1,740万米ドル、予測期間中のCAGRは10.22%で成長すると予測されます。
当レポートでは、デジタル印刷・染色機市場の全体的な分析、市場規模・予測、動向、成長促進要因、課題、約25のベンダーを網羅したベンダー分析などを掲載しています。
現在の市場シナリオ、最新動向と促進要因、市場環境全体に関する最新分析を提供しています。市場は、世界のテキスタイル需要の拡大、デジタルテキスタイルプリンティング需要の増加、不織布需要の増加によって牽引されています。
| 市場範囲 | |
|---|---|
| 基準年 | 2024 |
| 終了年 | 2028 |
| 予測期間 | 2024-2028 |
| 成長モメンタム | 加速 |
| 前年比2024年 | 9.02% |
| CAGR | 10.22% |
| 増分額 | 105億1,740万米ドル |
本調査では、染色工程の自動化が今後数年間のデジタル印刷・染色機市場成長を牽引する主要因の1つであると分析しています。また、紫外線(UV)硬化型インキの重要性が高まり、印刷インキにおける有機顔料の使用が増加することで、市場の大きな需要が見込まれます。
目次
第1章 エグゼクティブサマリー
- 市場概要
第2章 市場情勢
- 市場エコシステム
- 市場の特徴
- バリューチェーン分析
第3章 市場規模の評価
- 市場の定義
- 市場セグメント分析
- 市場規模 2023
- 市場の見通し 2023-2028
第4章 市場規模実績
- 世界デジタル印刷・染色機市場 2018-2022
- 流通チャネル別セグメント分析 2018-2022
- タイプ別セグメント分析 2018-2022
- 地域別セグメント分析 2018-2022
- 国別セグメント分析 2018-2022
第5章 ファイブフォース分析
- ファイブフォースの要約
- 買い手の交渉力
- 供給企業の交渉力
- 新規参入業者の脅威
- 代替品の脅威
- 競争の脅威
- 市況
第6章 市場セグメンテーション:流通チャネル別
- 市場セグメンテーション
- 比較:流通チャネル別
- メーカー:市場規模と予測 2023-2028
- 間接販売:市場規模と予測 2023-2028
- 市場機会:流通チャネル別
第7章 市場セグメンテーション:タイプ別
- 市場セグメンテーション
- 比較:タイプ別
- デジタル印刷機:市場規模と予測 2023-2028
- 染色機械:市場規模と予測 2023-2028
- 市場機会:タイプ別
第8章 顧客情勢
- 顧客情勢の概要
第9章 地域別情勢
- 地域別セグメンテーション
- 地域別比較
- アジア太平洋:市場規模と予測 2023-2028
- 欧州:市場規模と予測 2023-2028
- 北米:市場規模と予測 2023-2028
- 南米:市場規模と予測 2023-2028
- 中東・アフリカ:市場規模と予測 2023-2028
- 中国:市場規模と予測 2023-2028
- 米国:市場規模と予測 2023-2028
- インド:市場規模と予測 2023-2028
- 英国:市場規模と予測 2023-2028
- ブラジル:市場規模と予測 2023-2028
- 市場機会:地域別
第10章 促進要因・課題・機会・抑制要因
- 市場促進要因
- 市場の課題
- 促進要因と課題の影響
- 市場の機会・抑制要因
第11章 競合情勢
- 概要
- 競合情勢
- 混乱の状況
- 業界のリスク
第12章 競合分析
- 企業プロファイル
- 企業の市場ポジショニング
- Acme Machinery Co. Pvt. Ltd.
- Alliance Machines Textiles
- Applied Separations Inc.
- Colorjet Group
- Flainox Srl
- FONGS Europe GmbH
- FUJIFILM Corp.
- HGS Machines Pvt. Ltd.
- Konica Minolta Inc.
- Kornit Digital Ltd.
- Mimaki Engineering Co. Ltd.
- Ricoh Co. Ltd.
- Roland DG Corp.
- Seiko Epson Corp.
- Xerox Holdings Corp.
第13章 付録
Exhibits:
- Exhibits1: Executive Summary - Chart on Market Overview
- Exhibits2: Executive Summary - Data Table on Market Overview
- Exhibits3: Executive Summary - Chart on Global Market Characteristics
- Exhibits4: Executive Summary - Chart on Market by Geography
- Exhibits5: Executive Summary - Chart on Market Segmentation by Distribution Channel
- Exhibits6: Executive Summary - Chart on Market Segmentation by Type
- Exhibits7: Executive Summary - Chart on Incremental Growth
- Exhibits8: Executive Summary - Data Table on Incremental Growth
- Exhibits9: Executive Summary - Chart on Company Market Positioning
- Exhibits10: Parent Market
- Exhibits11: Data Table on - Parent Market
- Exhibits12: Market characteristics analysis
- Exhibits13: Value Chain Analysis
- Exhibits14: Offerings of companies included in the market definition
- Exhibits15: Market segments
- Exhibits16: Chart on Global - Market size and forecast 2023-2028 ($ million)
- Exhibits17: Data Table on Global - Market size and forecast 2023-2028 ($ million)
- Exhibits18: Chart on Global Market: Year-over-year growth 2023-2028 (%)
- Exhibits19: Data Table on Global Market: Year-over-year growth 2023-2028 (%)
- Exhibits20: Historic Market Size - Data Table on Global Digital Printing And Dyeing Machines Market 2018 - 2022 ($ million)
- Exhibits21: Historic Market Size - Distribution Channel Segment 2018 - 2022 ($ million)
- Exhibits22: Historic Market Size - Type Segment 2018 - 2022 ($ million)
- Exhibits23: Historic Market Size - Geography Segment 2018 - 2022 ($ million)
- Exhibits24: Historic Market Size - Country Segment 2018 - 2022 ($ million)
- Exhibits25: Five forces analysis - Comparison between 2023 and 2028
- Exhibits26: Bargaining power of buyers - Impact of key factors 2023 and 2028
- Exhibits27: Bargaining power of suppliers - Impact of key factors in 2023 and 2028
- Exhibits28: Threat of new entrants - Impact of key factors in 2023 and 2028
- Exhibits29: Threat of substitutes - Impact of key factors in 2023 and 2028
- Exhibits30: Threat of rivalry - Impact of key factors in 2023 and 2028
- Exhibits31: Chart on Market condition - Five forces 2023 and 2028
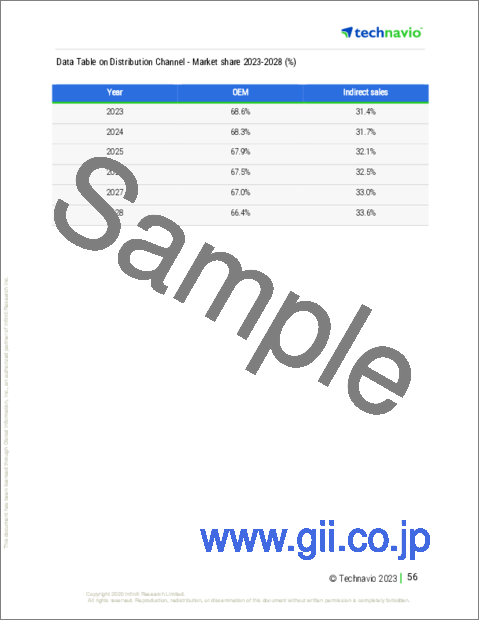
- Exhibits32: Chart on Distribution Channel - Market share 2023-2028 (%)
- Exhibits33: Data Table on Distribution Channel - Market share 2023-2028 (%)
- Exhibits34: Chart on Comparison by Distribution Channel
- Exhibits35: Data Table on Comparison by Distribution Channel
- Exhibits36: Chart on OEM - Market size and forecast 2023-2028 ($ million)
- Exhibits37: Data Table on OEM - Market size and forecast 2023-2028 ($ million)
- Exhibits38: Chart on OEM - Year-over-year growth 2023-2028 (%)
- Exhibits39: Data Table on OEM - Year-over-year growth 2023-2028 (%)
- Exhibits40: Chart on Indirect sales - Market size and forecast 2023-2028 ($ million)
- Exhibits41: Data Table on Indirect sales - Market size and forecast 2023-2028 ($ million)
- Exhibits42: Chart on Indirect sales - Year-over-year growth 2023-2028 (%)
- Exhibits43: Data Table on Indirect sales - Year-over-year growth 2023-2028 (%)
- Exhibits44: Market opportunity by Distribution Channel ($ million)
- Exhibits45: Data Table on Market opportunity by Distribution Channel ($ million)
- Exhibits46: Chart on Type - Market share 2023-2028 (%)
- Exhibits47: Data Table on Type - Market share 2023-2028 (%)
- Exhibits48: Chart on Comparison by Type
- Exhibits49: Data Table on Comparison by Type
- Exhibits50: Chart on Digital printing machines - Market size and forecast 2023-2028 ($ million)
- Exhibits51: Data Table on Digital printing machines - Market size and forecast 2023-2028 ($ million)
- Exhibits52: Chart on Digital printing machines - Year-over-year growth 2023-2028 (%)
- Exhibits53: Data Table on Digital printing machines - Year-over-year growth 2023-2028 (%)
- Exhibits54: Chart on Dyeing machines - Market size and forecast 2023-2028 ($ million)
- Exhibits55: Data Table on Dyeing machines - Market size and forecast 2023-2028 ($ million)
- Exhibits56: Chart on Dyeing machines - Year-over-year growth 2023-2028 (%)
- Exhibits57: Data Table on Dyeing machines - Year-over-year growth 2023-2028 (%)
- Exhibits58: Market opportunity by Type ($ million)
- Exhibits59: Data Table on Market opportunity by Type ($ million)
- Exhibits60: Analysis of price sensitivity, lifecycle, customer purchase basket, adoption rates, and purchase criteria
- Exhibits61: Chart on Market share By Geographical Landscape2023-2028 (%)
- Exhibits62: Data Table on Market share By Geographical Landscape2023-2028 (%)
- Exhibits63: Chart on Geographic comparison
- Exhibits64: Data Table on Geographic comparison
- Exhibits65: Chart on APAC - Market size and forecast 2023-2028 ($ million)
- Exhibits66: Data Table on APAC - Market size and forecast 2023-2028 ($ million)
- Exhibits67: Chart on APAC - Year-over-year growth 2023-2028 (%)
- Exhibits68: Data Table on APAC - Year-over-year growth 2023-2028 (%)
- Exhibits69: Chart on Europe - Market size and forecast 2023-2028 ($ million)
- Exhibits70: Data Table on Europe - Market size and forecast 2023-2028 ($ million)
- Exhibits71: Chart on Europe - Year-over-year growth 2023-2028 (%)
- Exhibits72: Data Table on Europe - Year-over-year growth 2023-2028 (%)
- Exhibits73: Chart on North America - Market size and forecast 2023-2028 ($ million)
- Exhibits74: Data Table on North America - Market size and forecast 2023-2028 ($ million)
- Exhibits75: Chart on North America - Year-over-year growth 2023-2028 (%)
- Exhibits76: Data Table on North America - Year-over-year growth 2023-2028 (%)
- Exhibits77: Chart on South America - Market size and forecast 2023-2028 ($ million)
- Exhibits78: Data Table on South America - Market size and forecast 2023-2028 ($ million)
- Exhibits79: Chart on South America - Year-over-year growth 2023-2028 (%)
- Exhibits80: Data Table on South America - Year-over-year growth 2023-2028 (%)
- Exhibits81: Chart on Middle East and Africa - Market size and forecast 2023-2028 ($ million)
- Exhibits82: Data Table on Middle East and Africa - Market size and forecast 2023-2028 ($ million)
- Exhibits83: Chart on Middle East and Africa - Year-over-year growth 2023-2028 (%)
- Exhibits84: Data Table on Middle East and Africa - Year-over-year growth 2023-2028 (%)
- Exhibits85: Chart on China - Market size and forecast 2023-2028 ($ million)
- Exhibits86: Data Table on China - Market size and forecast 2023-2028 ($ million)
- Exhibits87: Chart on China - Year-over-year growth 2023-2028 (%)
- Exhibits88: Data Table on China - Year-over-year growth 2023-2028 (%)
- Exhibits89: Chart on US - Market size and forecast 2023-2028 ($ million)
- Exhibits90: Data Table on US - Market size and forecast 2023-2028 ($ million)
- Exhibits91: Chart on US - Year-over-year growth 2023-2028 (%)
- Exhibits92: Data Table on US - Year-over-year growth 2023-2028 (%)
- Exhibits93: Chart on India - Market size and forecast 2023-2028 ($ million)
- Exhibits94: Data Table on India - Market size and forecast 2023-2028 ($ million)
- Exhibits95: Chart on India - Year-over-year growth 2023-2028 (%)
- Exhibits96: Data Table on India - Year-over-year growth 2023-2028 (%)
- Exhibits97: Chart on UK - Market size and forecast 2023-2028 ($ million)
- Exhibits98: Data Table on UK - Market size and forecast 2023-2028 ($ million)
- Exhibits99: Chart on UK - Year-over-year growth 2023-2028 (%)
- Exhibits100: Data Table on UK - Year-over-year growth 2023-2028 (%)
- Exhibits101: Chart on Brazil - Market size and forecast 2023-2028 ($ million)
- Exhibits102: Data Table on Brazil - Market size and forecast 2023-2028 ($ million)
- Exhibits103: Chart on Brazil - Year-over-year growth 2023-2028 (%)
- Exhibits104: Data Table on Brazil - Year-over-year growth 2023-2028 (%)
- Exhibits105: Market opportunity By Geographical Landscape($ million)
- Exhibits106: Data Tables on Market opportunity By Geographical Landscape($ million)
- Exhibits107: Impact of drivers and challenges in 2023 and 2028
- Exhibits108: Overview on criticality of inputs and factors of differentiation
- Exhibits109: Overview on factors of disruption
- Exhibits110: Impact of key risks on business
- Exhibits111: Companies covered
- Exhibits112: Matrix on companies position and classification
- Exhibits113: Acme Machinery Co. Pvt. Ltd. - Overview
- Exhibits114: Acme Machinery Co. Pvt. Ltd. - Product / Service
- Exhibits115: Acme Machinery Co. Pvt. Ltd. - Key offerings
- Exhibits116: Alliance Machines Textiles - Overview
- Exhibits117: Alliance Machines Textiles - Product / Service
- Exhibits118: Alliance Machines Textiles - Key offerings
- Exhibits119: Applied Separations Inc. - Overview
- Exhibits120: Applied Separations Inc. - Product / Service
- Exhibits121: Applied Separations Inc. - Key offerings
- Exhibits122: Colorjet Group - Overview
- Exhibits123: Colorjet Group - Product / Service
- Exhibits124: Colorjet Group - Key offerings
- Exhibits125: Flainox Srl - Overview
- Exhibits126: Flainox Srl - Product / Service
- Exhibits127: Flainox Srl - Key offerings
- Exhibits128: FONGS Europe GmbH - Overview
- Exhibits129: FONGS Europe GmbH - Product / Service
- Exhibits130: FONGS Europe GmbH - Key offerings
- Exhibits131: FUJIFILM Corp. - Overview
- Exhibits132: FUJIFILM Corp. - Business segments
- Exhibits133: FUJIFILM Corp. - Key news
- Exhibits134: FUJIFILM Corp. - Key offerings
- Exhibits135: FUJIFILM Corp. - Segment focus
- Exhibits136: HGS Machines Pvt. Ltd. - Overview
- Exhibits137: HGS Machines Pvt. Ltd. - Product / Service
- Exhibits138: HGS Machines Pvt. Ltd. - Key offerings
- Exhibits139: Konica Minolta Inc. - Overview
- Exhibits140: Konica Minolta Inc. - Business segments
- Exhibits141: Konica Minolta Inc. - Key news
- Exhibits142: Konica Minolta Inc. - Key offerings
- Exhibits143: Konica Minolta Inc. - Segment focus
- Exhibits144: Kornit Digital Ltd. - Overview
- Exhibits145: Kornit Digital Ltd. - Product / Service
- Exhibits146: Kornit Digital Ltd. - Key offerings
- Exhibits147: Mimaki Engineering Co. Ltd. - Overview
- Exhibits148: Mimaki Engineering Co. Ltd. - Product / Service
- Exhibits149: Mimaki Engineering Co. Ltd. - Key offerings
- Exhibits150: Ricoh Co. Ltd. - Overview
- Exhibits151: Ricoh Co. Ltd. - Business segments
- Exhibits152: Ricoh Co. Ltd. - Key news
- Exhibits153: Ricoh Co. Ltd. - Key offerings
- Exhibits154: Ricoh Co. Ltd. - Segment focus
- Exhibits155: Roland DG Corp. - Overview
- Exhibits156: Roland DG Corp. - Product / Service
- Exhibits157: Roland DG Corp. - Key offerings
- Exhibits158: Seiko Epson Corp. - Overview
- Exhibits159: Seiko Epson Corp. - Business segments
- Exhibits160: Seiko Epson Corp. - Key news
- Exhibits161: Seiko Epson Corp. - Key offerings
- Exhibits162: Seiko Epson Corp. - Segment focus
- Exhibits163: Xerox Holdings Corp. - Overview
- Exhibits164: Xerox Holdings Corp. - Business segments
- Exhibits165: Xerox Holdings Corp. - Key news
- Exhibits166: Xerox Holdings Corp. - Key offerings
- Exhibits167: Xerox Holdings Corp. - Segment focus
- Exhibits168: Inclusions checklist
- Exhibits169: Exclusions checklist
- Exhibits170: Currency conversion rates for US$
- Exhibits171: Research methodology
- Exhibits172: Information sources
- Exhibits173: Data validation
- Exhibits174: Validation techniques employed for market sizing
- Exhibits175: Data synthesis
- Exhibits176: 360 degree market analysis
- Exhibits177: List of abbreviations
The digital printing and dyeing machines market is forecasted to grow by USD 10517.4 mn during 2023-2028, accelerating at a CAGR of 10.22% during the forecast period. The report on the digital printing and dyeing machines market provides a holistic analysis, market size and forecast, trends, growth drivers, and challenges, as well as vendor analysis covering around 25 vendors.
The report offers an up-to-date analysis regarding the current market scenario, the latest trends and drivers, and the overall market environment. The market is driven by growing global demand for textiles, rise in demand for digital textile printing, and rising demand for non-woven fabrics.
Technavio's digital printing and dyeing machines market is segmented as below:
| Market Scope | |
|---|---|
| Base Year | 2024 |
| End Year | 2028 |
| Series Year | 2024-2028 |
| Growth Momentum | Accelerate |
| YOY 2024 | 9.02% |
| CAGR | 10.22% |
| Incremental Value | $10517.4mn |
By Distribution Channel
- OEM
- Indirect sales
By Type
- Digital printing machines
- Dyeing machines
By Geography
- APAC
- Europe
- North America
- South America
- Middle East and Africa
This study identifies the automation of dyeing process as one of the prime reasons driving the digital printing and dyeing machines market growth during the next few years. Also, increasing significance of ultraviolet (uv)-cured inks and rising use of organic pigments in printing inks will lead to sizable demand in the market.
The report on the digital printing and dyeing machines market covers the following areas:
- Digital printing and dyeing machines market sizing
- Digital printing and dyeing machines market forecast
- Digital printing and dyeing machines market industry analysis
The robust vendor analysis is designed to help clients improve their market position, and in line with this, this report provides a detailed analysis of several leading digital printing and dyeing machines market vendors that include Acme Machinery Co. Pvt. Ltd., Alliance Machines Textiles, Applied Separations Inc., Colorjet Group, Cubotex Srl, Flainox Srl, FONGS Europe GmbH, FUJIFILM Corp., HGS Machines Pvt. Ltd., J. Zimmer Maschinenbau GmbH, Konica Minolta Inc., Kornit Digital Ltd., La Meccanica Spa, Loris Bellini Srl, Mimaki Engineering Co. Ltd., Ricoh Co. Ltd., Roland DG Corp., Seiko Epson Corp., SPGPrints, and Xerox Holdings Corp.. Also, the digital printing and dyeing machines market analysis report includes information on upcoming trends and challenges that will influence market growth. This is to help companies strategize and leverage all forthcoming growth opportunities.
The study was conducted using an objective combination of primary and secondary information including inputs from key participants in the industry. The report contains a comprehensive market and vendor landscape in addition to an analysis of the key vendors.
The publisher presents a detailed picture of the market by the way of study, synthesis, and summation of data from multiple sources by an analysis of key parameters such as profit, pricing, competition, and promotions. It presents various market facets by identifying the key industry influencers. The data presented is comprehensive, reliable, and a result of extensive research - both primary and secondary. The market research reports provide a complete competitive landscape and an in-depth vendor selection methodology and analysis using qualitative and quantitative research to forecast the accurate market growth.
Table of Contents
1 Executive Summary
- 1.1 Market overview
- Executive Summary - Chart on Market Overview
- Executive Summary - Data Table on Market Overview
- Executive Summary - Chart on Global Market Characteristics
- Executive Summary - Chart on Market by Geography
- Executive Summary - Chart on Market Segmentation by Distribution Channel
- Executive Summary - Chart on Market Segmentation by Type
- Executive Summary - Chart on Incremental Growth
- Executive Summary - Data Table on Incremental Growth
- Executive Summary - Chart on Company Market Positioning
2 Market Landscape
- 2.1 Market ecosystem
- Parent Market
- Data Table on - Parent Market
- 2.2 Market characteristics
- Market characteristics analysis
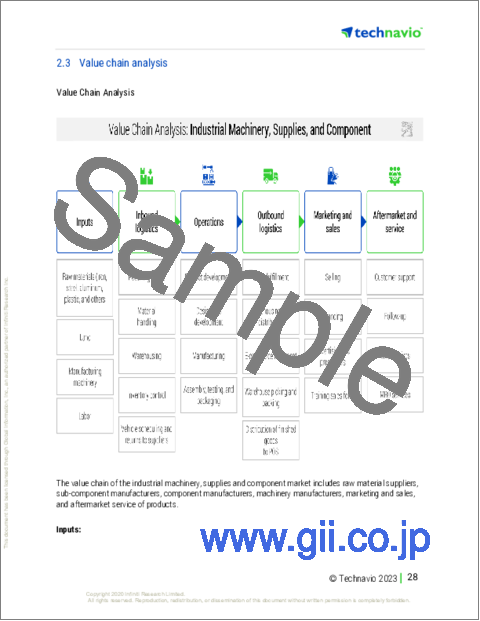
- 2.3 Value chain analysis
- Value Chain Analysis
3 Market Sizing
- 3.1 Market definition
- Offerings of companies included in the market definition
- 3.2 Market segment analysis
- Market segments
- 3.3 Market size 2023
- 3.4 Market outlook: Forecast for 2023-2028
- Chart on Global - Market size and forecast 2023-2028 ($ million)
- Data Table on Global - Market size and forecast 2023-2028 ($ million)
- Chart on Global Market: Year-over-year growth 2023-2028 (%)
- Data Table on Global Market: Year-over-year growth 2023-2028 (%)
4 Historic Market Size
- 4.1 Global Digital Printing And Dyeing Machines Market 2018 - 2022
- Historic Market Size - Data Table on Global Digital Printing And Dyeing Machines Market 2018 - 2022 ($ million)
- 4.2 Distribution Channel segment analysis 2018 - 2022
- Historic Market Size - Distribution Channel Segment 2018 - 2022 ($ million)
- 4.3 Type segment analysis 2018 - 2022
- Historic Market Size - Type Segment 2018 - 2022 ($ million)
- 4.4 Geography segment analysis 2018 - 2022
- Historic Market Size - Geography Segment 2018 - 2022 ($ million)
- 4.5 Country segment analysis 2018 - 2022
- Historic Market Size - Country Segment 2018 - 2022 ($ million)
5 Five Forces Analysis
- 5.1 Five forces summary
- Five forces analysis - Comparison between 2023 and 2028
- 5.2 Bargaining power of buyers
- Bargaining power of buyers - Impact of key factors 2023 and 2028
- 5.3 Bargaining power of suppliers
- Bargaining power of suppliers - Impact of key factors in 2023 and 2028
- 5.4 Threat of new entrants
- Threat of new entrants - Impact of key factors in 2023 and 2028
- 5.5 Threat of substitutes
- Threat of substitutes - Impact of key factors in 2023 and 2028
- 5.6 Threat of rivalry
- Threat of rivalry - Impact of key factors in 2023 and 2028
- 5.7 Market condition
- Chart on Market condition - Five forces 2023 and 2028
6 Market Segmentation by Distribution Channel
- 6.1 Market segments
- Chart on Distribution Channel - Market share 2023-2028 (%)
- Data Table on Distribution Channel - Market share 2023-2028 (%)
- 6.2 Comparison by Distribution Channel
- Chart on Comparison by Distribution Channel
- Data Table on Comparison by Distribution Channel
- 6.3 OEM - Market size and forecast 2023-2028
- Chart on OEM - Market size and forecast 2023-2028 ($ million)
- Data Table on OEM - Market size and forecast 2023-2028 ($ million)
- Chart on OEM - Year-over-year growth 2023-2028 (%)
- Data Table on OEM - Year-over-year growth 2023-2028 (%)
- 6.4 Indirect sales - Market size and forecast 2023-2028
- Chart on Indirect sales - Market size and forecast 2023-2028 ($ million)
- Data Table on Indirect sales - Market size and forecast 2023-2028 ($ million)
- Chart on Indirect sales - Year-over-year growth 2023-2028 (%)
- Data Table on Indirect sales - Year-over-year growth 2023-2028 (%)
- 6.5 Market opportunity by Distribution Channel
- Market opportunity by Distribution Channel ($ million)
- Data Table on Market opportunity by Distribution Channel ($ million)
7 Market Segmentation by Type
- 7.1 Market segments
- Chart on Type - Market share 2023-2028 (%)
- Data Table on Type - Market share 2023-2028 (%)
- 7.2 Comparison by Type
- Chart on Comparison by Type
- Data Table on Comparison by Type
- 7.3 Digital printing machines - Market size and forecast 2023-2028
- Chart on Digital printing machines - Market size and forecast 2023-2028 ($ million)
- Data Table on Digital printing machines - Market size and forecast 2023-2028 ($ million)
- Chart on Digital printing machines - Year-over-year growth 2023-2028 (%)
- Data Table on Digital printing machines - Year-over-year growth 2023-2028 (%)
- 7.4 Dyeing machines - Market size and forecast 2023-2028
- Chart on Dyeing machines - Market size and forecast 2023-2028 ($ million)
- Data Table on Dyeing machines - Market size and forecast 2023-2028 ($ million)
- Chart on Dyeing machines - Year-over-year growth 2023-2028 (%)
- Data Table on Dyeing machines - Year-over-year growth 2023-2028 (%)
- 7.5 Market opportunity by Type
- Market opportunity by Type ($ million)
- Data Table on Market opportunity by Type ($ million)
8 Customer Landscape
- 8.1 Customer landscape overview
- Analysis of price sensitivity, lifecycle, customer purchase basket, adoption rates, and purchase criteria
9 Geographic Landscape
- 9.1 Geographic segmentation
- Chart on Market share By Geographical Landscape2023-2028 (%)
- Data Table on Market share By Geographical Landscape2023-2028 (%)
- 9.2 Geographic comparison
- Chart on Geographic comparison
- Data Table on Geographic comparison
- 9.3 APAC - Market size and forecast 2023-2028
- Chart on APAC - Market size and forecast 2023-2028 ($ million)
- Data Table on APAC - Market size and forecast 2023-2028 ($ million)
- Chart on APAC - Year-over-year growth 2023-2028 (%)
- Data Table on APAC - Year-over-year growth 2023-2028 (%)
- 9.4 Europe - Market size and forecast 2023-2028
- Chart on Europe - Market size and forecast 2023-2028 ($ million)
- Data Table on Europe - Market size and forecast 2023-2028 ($ million)
- Chart on Europe - Year-over-year growth 2023-2028 (%)
- Data Table on Europe - Year-over-year growth 2023-2028 (%)
- 9.5 North America - Market size and forecast 2023-2028
- Chart on North America - Market size and forecast 2023-2028 ($ million)
- Data Table on North America - Market size and forecast 2023-2028 ($ million)
- Chart on North America - Year-over-year growth 2023-2028 (%)
- Data Table on North America - Year-over-year growth 2023-2028 (%)
- 9.6 South America - Market size and forecast 2023-2028
- Chart on South America - Market size and forecast 2023-2028 ($ million)
- Data Table on South America - Market size and forecast 2023-2028 ($ million)
- Chart on South America - Year-over-year growth 2023-2028 (%)
- Data Table on South America - Year-over-year growth 2023-2028 (%)
- 9.7 Middle East and Africa - Market size and forecast 2023-2028
- Chart on Middle East and Africa - Market size and forecast 2023-2028 ($ million)
- Data Table on Middle East and Africa - Market size and forecast 2023-2028 ($ million)
- Chart on Middle East and Africa - Year-over-year growth 2023-2028 (%)
- Data Table on Middle East and Africa - Year-over-year growth 2023-2028 (%)
- 9.8 China - Market size and forecast 2023-2028
- Chart on China - Market size and forecast 2023-2028 ($ million)
- Data Table on China - Market size and forecast 2023-2028 ($ million)
- Chart on China - Year-over-year growth 2023-2028 (%)
- Data Table on China - Year-over-year growth 2023-2028 (%)
- 9.9 US - Market size and forecast 2023-2028
- Chart on US - Market size and forecast 2023-2028 ($ million)
- Data Table on US - Market size and forecast 2023-2028 ($ million)
- Chart on US - Year-over-year growth 2023-2028 (%)
- Data Table on US - Year-over-year growth 2023-2028 (%)
- 9.10 India - Market size and forecast 2023-2028
- Chart on India - Market size and forecast 2023-2028 ($ million)
- Data Table on India - Market size and forecast 2023-2028 ($ million)
- Chart on India - Year-over-year growth 2023-2028 (%)
- Data Table on India - Year-over-year growth 2023-2028 (%)
- 9.11 UK - Market size and forecast 2023-2028
- Chart on UK - Market size and forecast 2023-2028 ($ million)
- Data Table on UK - Market size and forecast 2023-2028 ($ million)
- Chart on UK - Year-over-year growth 2023-2028 (%)
- Data Table on UK - Year-over-year growth 2023-2028 (%)
- 9.12 Brazil - Market size and forecast 2023-2028
- Chart on Brazil - Market size and forecast 2023-2028 ($ million)
- Data Table on Brazil - Market size and forecast 2023-2028 ($ million)
- Chart on Brazil - Year-over-year growth 2023-2028 (%)
- Data Table on Brazil - Year-over-year growth 2023-2028 (%)
- 9.13 Market opportunity by geography
- Market opportunity By Geographical Landscape($ million)
- Data Tables on Market opportunity By Geographical Landscape($ million)
10 Drivers, Challenges, and Opportunity/Restraints
- 10.1 Market drivers
- 10.2 Market challenges
- 10.3 Impact of drivers and challenges
- Impact of drivers and challenges in 2023 and 2028
- 10.4 Market opportunities/restraints
11 Competitive Landscape
- 11.1 Overview
- 11.2 Competitive Landscape
- Overview on criticality of inputs and factors of differentiation
- 11.3 Landscape disruption
- Overview on factors of disruption
- 11.4 Industry risks
- Impact of key risks on business
12 Competitive Analysis
- 12.1 Companies profiled
- Companies covered
- 12.2 Market positioning of companies
- Matrix on companies position and classification
- 12.3 Acme Machinery Co. Pvt. Ltd.
- Acme Machinery Co. Pvt. Ltd. - Overview
- Acme Machinery Co. Pvt. Ltd. - Product / Service
- Acme Machinery Co. Pvt. Ltd. - Key offerings
- 12.4 Alliance Machines Textiles
- Alliance Machines Textiles - Overview
- Alliance Machines Textiles - Product / Service
- Alliance Machines Textiles - Key offerings
- 12.5 Applied Separations Inc.
- Applied Separations Inc. - Overview
- Applied Separations Inc. - Product / Service
- Applied Separations Inc. - Key offerings
- 12.6 Colorjet Group
- Colorjet Group - Overview
- Colorjet Group - Product / Service
- Colorjet Group - Key offerings
- 12.7 Flainox Srl
- Flainox Srl - Overview
- Flainox Srl - Product / Service
- Flainox Srl - Key offerings
- 12.8 FONGS Europe GmbH
- FONGS Europe GmbH - Overview
- FONGS Europe GmbH - Product / Service
- FONGS Europe GmbH - Key offerings
- 12.9 FUJIFILM Corp.
- FUJIFILM Corp. - Overview
- FUJIFILM Corp. - Business segments
- FUJIFILM Corp. - Key news
- FUJIFILM Corp. - Key offerings
- FUJIFILM Corp. - Segment focus
- 12.10 HGS Machines Pvt. Ltd.
- HGS Machines Pvt. Ltd. - Overview
- HGS Machines Pvt. Ltd. - Product / Service
- HGS Machines Pvt. Ltd. - Key offerings
- 12.11 Konica Minolta Inc.
- Konica Minolta Inc. - Overview
- Konica Minolta Inc. - Business segments
- Konica Minolta Inc. - Key news
- Konica Minolta Inc. - Key offerings
- Konica Minolta Inc. - Segment focus
- 12.12 Kornit Digital Ltd.
- Kornit Digital Ltd. - Overview
- Kornit Digital Ltd. - Product / Service
- Kornit Digital Ltd. - Key offerings
- 12.13 Mimaki Engineering Co. Ltd.
- Mimaki Engineering Co. Ltd. - Overview
- Mimaki Engineering Co. Ltd. - Product / Service
- Mimaki Engineering Co. Ltd. - Key offerings
- 12.14 Ricoh Co. Ltd.
- Ricoh Co. Ltd. - Overview
- Ricoh Co. Ltd. - Business segments
- Ricoh Co. Ltd. - Key news
- Ricoh Co. Ltd. - Key offerings
- Ricoh Co. Ltd. - Segment focus
- 12.15 Roland DG Corp.
- Roland DG Corp. - Overview
- Roland DG Corp. - Product / Service
- Roland DG Corp. - Key offerings
- 12.16 Seiko Epson Corp.
- Seiko Epson Corp. - Overview
- Seiko Epson Corp. - Business segments
- Seiko Epson Corp. - Key news
- Seiko Epson Corp. - Key offerings
- Seiko Epson Corp. - Segment focus
- 12.17 Xerox Holdings Corp.
- Xerox Holdings Corp. - Overview
- Xerox Holdings Corp. - Business segments
- Xerox Holdings Corp. - Key news
- Xerox Holdings Corp. - Key offerings
- Xerox Holdings Corp. - Segment focus
13 Appendix
- 13.1 Scope of the report
- 13.2 Inclusions and exclusions checklist
- Inclusions checklist
- Exclusions checklist
- 13.3 Currency conversion rates for US$
- Currency conversion rates for US$
- 13.4 Research methodology
- Research methodology
- 13.5 Data procurement
- Information sources
- 13.6 Data validation
- Data validation
- 13.7 Validation techniques employed for market sizing
- Validation techniques employed for market sizing
- 13.8 Data synthesis
- Data synthesis
- 13.9 360 degree market analysis
- 360 degree market analysis
- 13.10 List of abbreviations
- List of abbreviations
