|
|
市場調査レポート
商品コード
1490755
航空試験装置の世界市場 2024-2028Global Aviation Test Equipment Market 2024-2028 |
||||||

|
|||||||
カスタマイズ可能
|
|||||||


| 航空試験装置の世界市場 2024-2028 |
|
出版日: 2024年05月09日
発行: TechNavio
ページ情報: 英文 180 Pages
納期: 即納可能
|

全表示
- 概要
- 図表
- 目次
航空試験装置市場は2023-2028年に20億3,069万米ドル、予測期間中のCAGRは4.6%で成長すると予測されます。
当レポートでは、航空試験装置市場の全体的な分析、市場規模・予測、動向、成長促進要因、課題、約25のベンダーを網羅したベンダー分析などを掲載しています。
現在の市場シナリオ、最新動向と促進要因、市場環境全体に関する最新分析を提供しています。市場は、航空機の試験活動の増加、航空機に関連する厳しい規制要件や新興国市場の規格の進化、電気航空機やハイブリッド航空機の市場開拓の急増によって牽引されています。
| 市場範囲 | |
|---|---|
| 基準年 | 2024 |
| 終了年 | 2028 |
| 予測期間 | 2024-2028 |
| 成長モメンタム | 加速 |
| 前年比2024年 | 3.96% |
| CAGR | 4.6% |
| 増分額 | 20億3,069万米ドル |
本調査では、今後数年間の航空試験装置市場成長を促進する主な理由の1つとして、新しい航空機試験ラボの開設を挙げています。また、航空機用の先端材料や複合材への注目の高まり、航空機試験ラボにおけるAI&MLの統合は、市場の大きな需要につながります。
目次
第1章 エグゼクティブサマリー
- 市場概要
第2章 市場情勢
- 市場エコシステム
第3章 市場規模の評価
- 市場の定義
- 市場セグメント分析
- 市場規模 2023
- 市場の見通し 2023-2028
第4章 市場規模実績
- 航空試験装置の世界市場 2018-2022
- 用途別セグメント分析 2018-2022
- タイプセグメント分析 2018-2022
- 地域別セグメント分析 2018-2022
- 国別セグメント分析 2018-2022
第5章 ファイブフォース分析
- ファイブフォースの要約
- 買い手の交渉力
- 供給企業の交渉力
- 新規参入業者の脅威
- 代替品の脅威
- 競争の脅威
- 市況
第6章 アプリケーション別の市場セグメンテーション
- 市場セグメント
- 比較:用途別
- 商業用:市場規模と予測 2023-2028
- 軍事用:市場規模と予測 2023-2028
- 市場機会:用途別
第7章 タイプ別市場セグメンテーション
- 市場セグメント
- 比較:タイプ別
- 電気式:市場規模と予測 2023-2028
- 油圧式:市場規模と予測 2023-2028
- 空気圧:市場規模と予測 2023-2028
- 市場機会:タイプ別
第8章 顧客情勢
- 顧客情勢の概要
第9章 地域別情勢
- 地域別セグメンテーション
- 地域別比較
- 北米:市場規模と予測 2023-2028
- 欧州:市場規模と予測 2023-2028
- アジア太平洋:市場規模と予測 2023-2028
- 南米:市場規模と予測 2023-2028
- 中東・アフリカ:市場規模と予測 2023-2028
- 米国:市場規模と予測 2023-2028
- 中国:市場規模と予測 2023-2028
- ロシア:市場規模と予測 2023-2028
- カナダ:市場規模と予測 2023-2028
- 英国:市場規模と予測 2023-2028
- 市場機会:地域情勢別
第10章 促進要因、課題、および動向
- 市場促進要因
- 市場の課題
- 促進要因と課題の影響
- 市場動向
第11章 ベンダー情勢
- 概要
- ベンダー情勢
- 混乱の状況
- 業界のリスク
第12章 ベンダー分析
- 対象ベンダー
- ベンダーの市場ポジショニング
- Airbus SE
- AMETEK Inc.
- BAE Systems Plc
- General Electric Co.
- Honeywell International Inc.
- L3Harris Technologies Inc.
- Leonardo DRS
- Lockheed Martin Corp.
- Northrop Grumman Corp.
- Rolls Royce Holdings Plc
- RTX Corp.
- Safran SA
- Textron Inc.
- Thales Group
- The Boeing Co
第13章 付録
Exhibits:
- Exhibits1: Executive Summary - Chart on Market Overview
- Exhibits2: Executive Summary - Data Table on Market Overview
- Exhibits3: Executive Summary - Chart on Global Market Characteristics
- Exhibits4: Executive Summary - Chart on Market By Geographical Landscape
- Exhibits5: Executive Summary - Chart on Market Segmentation by Application
- Exhibits6: Executive Summary - Chart on Market Segmentation by Type
- Exhibits7: Executive Summary - Chart on Incremental Growth
- Exhibits8: Executive Summary - Data Table on Incremental Growth
- Exhibits9: Executive Summary - Chart on Vendor Market Positioning
- Exhibits10: Parent market
- Exhibits11: Market Characteristics
- Exhibits12: Offerings of vendors included in the market definition
- Exhibits13: Market segments
- Exhibits14: Chart on Global - Market size and forecast 2023-2028 ($ million)
- Exhibits15: Data Table on Global - Market size and forecast 2023-2028 ($ million)
- Exhibits16: Chart on Global Market: Year-over-year growth 2023-2028 (%)
- Exhibits17: Data Table on Global Market: Year-over-year growth 2023-2028 (%)
- Exhibits18: Historic Market Size - Data Table on global aviation test equipment market 2018 - 2022 ($ million)
- Exhibits19: Historic Market Size - Application Segment 2018 - 2022 ($ million)
- Exhibits20: Historic Market Size - Type Segment 2018 - 2022 ($ million)
- Exhibits21: Historic Market Size - Geography Segment 2018 - 2022 ($ million)
- Exhibits22: Historic Market Size - Country Segment 2018 - 2022 ($ million)
- Exhibits23: Five forces analysis - Comparison between 2023 and 2028
- Exhibits24: Chart on Bargaining power of buyers - Impact of key factors 2023 and 2028
- Exhibits25: Bargaining power of suppliers - Impact of key factors in 2023 and 2028
- Exhibits26: Threat of new entrants - Impact of key factors in 2023 and 2028
- Exhibits27: Threat of substitutes - Impact of key factors in 2023 and 2028
- Exhibits28: Threat of rivalry - Impact of key factors in 2023 and 2028
- Exhibits29: Chart on Market condition - Five forces 2023 and 2028
- Exhibits30: Chart on Application - Market share 2023-2028 (%)
- Exhibits31: Data Table on Application - Market share 2023-2028 (%)
- Exhibits32: Chart on Comparison by Application
- Exhibits33: Data Table on Comparison by Application
- Exhibits34: Chart on Commercial - Market size and forecast 2023-2028 ($ million)
- Exhibits35: Data Table on Commercial - Market size and forecast 2023-2028 ($ million)
- Exhibits36: Chart on Commercial - Year-over-year growth 2023-2028 (%)
- Exhibits37: Data Table on Commercial - Year-over-year growth 2023-2028 (%)
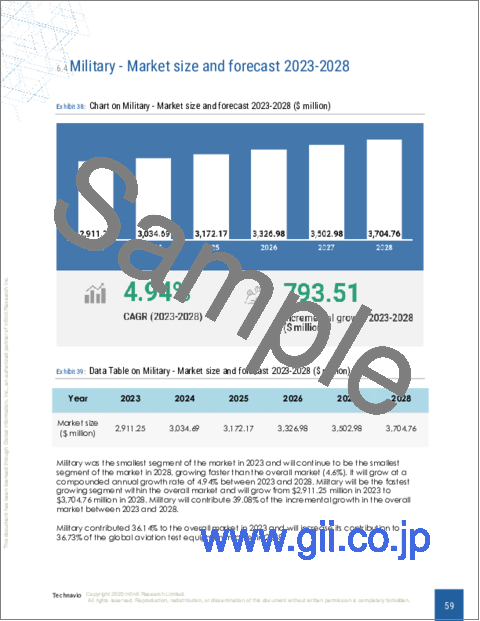
- Exhibits38: Chart on Military - Market size and forecast 2023-2028 ($ million)
- Exhibits39: Data Table on Military - Market size and forecast 2023-2028 ($ million)
- Exhibits40: Chart on Military - Year-over-year growth 2023-2028 (%)
- Exhibits41: Data Table on Military - Year-over-year growth 2023-2028 (%)
- Exhibits42: Market opportunity by Application ($ million)
- Exhibits43: Data Table on Market opportunity by Application ($ million)
- Exhibits44: Chart on Type - Market share 2023-2028 (%)
- Exhibits45: Data Table on Type - Market share 2023-2028 (%)
- Exhibits46: Chart on Comparison by Type
- Exhibits47: Data Table on Comparison by Type
- Exhibits48: Chart on Electric - Market size and forecast 2023-2028 ($ million)
- Exhibits49: Data Table on Electric - Market size and forecast 2023-2028 ($ million)
- Exhibits50: Chart on Electric - Year-over-year growth 2023-2028 (%)
- Exhibits51: Data Table on Electric - Year-over-year growth 2023-2028 (%)
- Exhibits52: Chart on Hydraulic - Market size and forecast 2023-2028 ($ million)
- Exhibits53: Data Table on Hydraulic - Market size and forecast 2023-2028 ($ million)
- Exhibits54: Chart on Hydraulic - Year-over-year growth 2023-2028 (%)
- Exhibits55: Data Table on Hydraulic - Year-over-year growth 2023-2028 (%)
- Exhibits56: Chart on Pneumatic - Market size and forecast 2023-2028 ($ million)
- Exhibits57: Data Table on Pneumatic - Market size and forecast 2023-2028 ($ million)
- Exhibits58: Chart on Pneumatic - Year-over-year growth 2023-2028 (%)
- Exhibits59: Data Table on Pneumatic - Year-over-year growth 2023-2028 (%)
- Exhibits60: Market opportunity by Type ($ million)
- Exhibits61: Data Table on Market opportunity by Type ($ million)
- Exhibits62: Analysis of price sensitivity, lifecycle, customer purchase basket, adoption rates, and purchase criteria
- Exhibits63: Chart on Market share By Geographical Landscape 2023-2028 (%)
- Exhibits64: Data Table on Market share By Geographical Landscape 2023-2028 (%)
- Exhibits65: Chart on Geographic comparison
- Exhibits66: Data Table on Geographic comparison
- Exhibits67: Chart on North America - Market size and forecast 2023-2028 ($ million)
- Exhibits68: Data Table on North America - Market size and forecast 2023-2028 ($ million)
- Exhibits69: Chart on North America - Year-over-year growth 2023-2028 (%)
- Exhibits70: Data Table on North America - Year-over-year growth 2023-2028 (%)
- Exhibits71: Chart on Europe - Market size and forecast 2023-2028 ($ million)
- Exhibits72: Data Table on Europe - Market size and forecast 2023-2028 ($ million)
- Exhibits73: Chart on Europe - Year-over-year growth 2023-2028 (%)
- Exhibits74: Data Table on Europe - Year-over-year growth 2023-2028 (%)
- Exhibits75: Chart on APAC - Market size and forecast 2023-2028 ($ million)
- Exhibits76: Data Table on APAC - Market size and forecast 2023-2028 ($ million)
- Exhibits77: Chart on APAC - Year-over-year growth 2023-2028 (%)
- Exhibits78: Data Table on APAC - Year-over-year growth 2023-2028 (%)
- Exhibits79: Chart on South America - Market size and forecast 2023-2028 ($ million)
- Exhibits80: Data Table on South America - Market size and forecast 2023-2028 ($ million)
- Exhibits81: Chart on South America - Year-over-year growth 2023-2028 (%)
- Exhibits82: Data Table on South America - Year-over-year growth 2023-2028 (%)
- Exhibits83: Chart on Middle East and Africa - Market size and forecast 2023-2028 ($ million)
- Exhibits84: Data Table on Middle East and Africa - Market size and forecast 2023-2028 ($ million)
- Exhibits85: Chart on Middle East and Africa - Year-over-year growth 2023-2028 (%)
- Exhibits86: Data Table on Middle East and Africa - Year-over-year growth 2023-2028 (%)
- Exhibits87: Chart on US - Market size and forecast 2023-2028 ($ million)
- Exhibits88: Data Table on US - Market size and forecast 2023-2028 ($ million)
- Exhibits89: Chart on US - Year-over-year growth 2023-2028 (%)
- Exhibits90: Data Table on US - Year-over-year growth 2023-2028 (%)
- Exhibits91: Chart on China - Market size and forecast 2023-2028 ($ million)
- Exhibits92: Data Table on China - Market size and forecast 2023-2028 ($ million)
- Exhibits93: Chart on China - Year-over-year growth 2023-2028 (%)
- Exhibits94: Data Table on China - Year-over-year growth 2023-2028 (%)
- Exhibits95: Chart on Russia - Market size and forecast 2023-2028 ($ million)
- Exhibits96: Data Table on Russia - Market size and forecast 2023-2028 ($ million)
- Exhibits97: Chart on Russia - Year-over-year growth 2023-2028 (%)
- Exhibits98: Data Table on Russia - Year-over-year growth 2023-2028 (%)
- Exhibits99: Chart on Canada - Market size and forecast 2023-2028 ($ million)
- Exhibits100: Data Table on Canada - Market size and forecast 2023-2028 ($ million)
- Exhibits101: Chart on Canada - Year-over-year growth 2023-2028 (%)
- Exhibits102: Data Table on Canada - Year-over-year growth 2023-2028 (%)
- Exhibits103: Chart on UK - Market size and forecast 2023-2028 ($ million)
- Exhibits104: Data Table on UK - Market size and forecast 2023-2028 ($ million)
- Exhibits105: Chart on UK - Year-over-year growth 2023-2028 (%)
- Exhibits106: Data Table on UK - Year-over-year growth 2023-2028 (%)
- Exhibits107: Market opportunity By Geographical Landscape ($ million)
- Exhibits108: Data Tables on Market opportunity By Geographical Landscape ($ million)
- Exhibits109: Impact of drivers and challenges in 2023 and 2028
- Exhibits110: Overview on Criticality of inputs and Factors of differentiation
- Exhibits111: Overview on factors of disruption
- Exhibits112: Impact of key risks on business
- Exhibits113: Vendors covered
- Exhibits114: Matrix on vendor position and classification
- Exhibits115: Airbus SE - Overview
- Exhibits116: Airbus SE - Business segments
- Exhibits117: Airbus SE - Key news
- Exhibits118: Airbus SE - Key offerings
- Exhibits119: Airbus SE - Segment focus
- Exhibits120: AMETEK Inc. - Overview
- Exhibits121: AMETEK Inc. - Business segments
- Exhibits122: AMETEK Inc. - Key news
- Exhibits123: AMETEK Inc. - Key offerings
- Exhibits124: AMETEK Inc. - Segment focus
- Exhibits125: BAE Systems Plc - Overview
- Exhibits126: BAE Systems Plc - Business segments
- Exhibits127: BAE Systems Plc - Key offerings
- Exhibits128: BAE Systems Plc - Segment focus
- Exhibits129: General Electric Co. - Overview
- Exhibits130: General Electric Co. - Business segments
- Exhibits131: General Electric Co. - Key news
- Exhibits132: General Electric Co. - Key offerings
- Exhibits133: General Electric Co. - Segment focus
- Exhibits134: Honeywell International Inc. - Overview
- Exhibits135: Honeywell International Inc. - Business segments
- Exhibits136: Honeywell International Inc. - Key news
- Exhibits137: Honeywell International Inc. - Key offerings
- Exhibits138: Honeywell International Inc. - Segment focus
- Exhibits139: L3Harris Technologies Inc. - Overview
- Exhibits140: L3Harris Technologies Inc. - Business segments
- Exhibits141: L3Harris Technologies Inc. - Key news
- Exhibits142: L3Harris Technologies Inc. - Key offerings
- Exhibits143: L3Harris Technologies Inc. - Segment focus
- Exhibits144: Leonardo DRS - Overview
- Exhibits145: Leonardo DRS - Product / Service
- Exhibits146: Leonardo DRS - Key offerings
- Exhibits147: Lockheed Martin Corp. - Overview
- Exhibits148: Lockheed Martin Corp. - Business segments
- Exhibits149: Lockheed Martin Corp. - Key offerings
- Exhibits150: Lockheed Martin Corp. - Segment focus
- Exhibits151: Northrop Grumman Corp. - Overview
- Exhibits152: Northrop Grumman Corp. - Business segments
- Exhibits153: Northrop Grumman Corp. - Key offerings
- Exhibits154: Northrop Grumman Corp. - Segment focus
- Exhibits155: Rolls Royce Holdings Plc - Overview
- Exhibits156: Rolls Royce Holdings Plc - Business segments
- Exhibits157: Rolls Royce Holdings Plc - Key offerings
- Exhibits158: Rolls Royce Holdings Plc - Segment focus
- Exhibits159: RTX Corp. - Overview
- Exhibits160: RTX Corp. - Business segments
- Exhibits161: RTX Corp. - Key news
- Exhibits162: RTX Corp. - Key offerings
- Exhibits163: RTX Corp. - Segment focus
- Exhibits164: Safran SA - Overview
- Exhibits165: Safran SA - Business segments
- Exhibits166: Safran SA - Key news
- Exhibits167: Safran SA - Key offerings
- Exhibits168: Safran SA - Segment focus
- Exhibits169: Textron Inc. - Overview
- Exhibits170: Textron Inc. - Business segments
- Exhibits171: Textron Inc. - Key offerings
- Exhibits172: Textron Inc. - Segment focus
- Exhibits173: Thales Group - Overview
- Exhibits174: Thales Group - Business segments
- Exhibits175: Thales Group - Key offerings
- Exhibits176: Thales Group - Segment focus
- Exhibits177: The Boeing Co - Overview
- Exhibits178: The Boeing Co - Business segments
- Exhibits179: The Boeing Co - Key offerings
- Exhibits180: The Boeing Co - Segment focus
- Exhibits181: Inclusions checklist
- Exhibits182: Exclusions checklist
- Exhibits183: Currency conversion rates for US$
- Exhibits184: Research methodology
- Exhibits185: Validation techniques employed for market sizing
- Exhibits186: Information sources
- Exhibits187: List of abbreviations
The aviation test equipment market is forecasted to grow by USD 2030.69 mn during 2023-2028, accelerating at a CAGR of 4.6% during the forecast period. The report on the aviation test equipment market provides a holistic analysis, market size and forecast, trends, growth drivers, and challenges, as well as vendor analysis covering around 25 vendors.
The report offers an up-to-date analysis regarding the current market scenario, the latest trends and drivers, and the overall market environment. The market is driven by increasing aircraft testing activities, stringent regulatory requirements and evolving standards associated with aircraft, and surge in development of electric and hybrid aircraft.
Technavio's aviation test equipment market is segmented as below:
| Market Scope | |
|---|---|
| Base Year | 2024 |
| End Year | 2028 |
| Series Year | 2024-2028 |
| Growth Momentum | Accelerate |
| YOY 2024 | 3.96% |
| CAGR | 4.6% |
| Incremental Value | $2030.69mn |
By Application
- Commercial
- Military
By Type
- Electric
- Hydraulic
- Pneumatic
By Geographical Landscape
- North America
- Europe
- APAC
- South America
- Middle East and Africa
This study identifies the opening of new aircraft testing labs as one of the prime reasons driving the aviation test equipment market growth during the next few years. Also, rising focus on advanced materials and composites for aircraft and integration of ai and ml in aircraft testing labs will lead to sizable demand in the market.
The report on the aviation test equipment market covers the following areas:
- Aviation test equipment market sizing
- Aviation test equipment market forecast
- Aviation test equipment market industry analysis
The robust vendor analysis is designed to help clients improve their market position, and in line with this, this report provides a detailed analysis of several leading aviation test equipment market vendors that include Airbus SE, AMETEK Inc., ATEQ AVIATION, BAE Systems Plc, Cobham Ltd., Curtiss Wright Corp., dSPACE GmbH, General Electric Co., Honeywell International Inc., L3Harris Technologies Inc., Leonardo DRS, Lockheed Martin Corp., Moog Inc., Northrop Grumman Corp., Rolls Royce Holdings Plc, RTX Corp., Safran SA, Textron Inc., Thales Group, and The Boeing Co. Also, the aviation test equipment market analysis report includes information on upcoming trends and challenges that will influence market growth. This is to help companies strategize and leverage all forthcoming growth opportunities.
The study was conducted using an objective combination of primary and secondary information including inputs from key participants in the industry. The report contains a comprehensive market and vendor landscape in addition to an analysis of the key vendors.
The publisher presents a detailed picture of the market by the way of study, synthesis, and summation of data from multiple sources by an analysis of key parameters such as profit, pricing, competition, and promotions. It presents various market facets by identifying the key industry influencers. The data presented is comprehensive, reliable, and a result of extensive research - both primary and secondary. The market research reports provide a complete competitive landscape and an in-depth vendor selection methodology and analysis using qualitative and quantitative research to forecast the accurate market growth.
Table of Contents
1 Executive Summary
- 1.1 Market overview
2 Market Landscape
- 2.1 Market ecosystem
3 Market Sizing
- 3.1 Market definition
- 3.2 Market segment analysis
- 3.3 Market size 2023
- 3.4 Market outlook: Forecast for 2023-2028
4 Historic Market Size
- 4.1 Global aviation test equipment market 2018 - 2022
- 4.2 Application Segment Analysis 2018 - 2022
- 4.3 Type Segment Analysis 2018 - 2022
- 4.4 Geography Segment Analysis 2018 - 2022
- 4.5 Country Segment Analysis 2018 - 2022
5 Five Forces Analysis
- 5.1 Five forces summary
- 5.2 Bargaining power of buyers
- 5.3 Bargaining power of suppliers
- 5.4 Threat of new entrants
- 5.5 Threat of substitutes
- 5.6 Threat of rivalry
- 5.7 Market condition
6 Market Segmentation by Application
- 6.1 Market segments
- 6.2 Comparison by Application
- 6.3 Commercial - Market size and forecast 2023-2028
- 6.4 Military - Market size and forecast 2023-2028
- 6.5 Market opportunity by Application
7 Market Segmentation by Type
- 7.1 Market segments
- 7.2 Comparison by Type
- 7.3 Electric - Market size and forecast 2023-2028
- 7.4 Hydraulic - Market size and forecast 2023-2028
- 7.5 Pneumatic - Market size and forecast 2023-2028
- 7.6 Market opportunity by Type
8 Customer Landscape
- 8.1 Customer landscape overview
9 Geographic Landscape
- 9.1 Geographic segmentation
- 9.2 Geographic comparison
- 9.3 North America - Market size and forecast 2023-2028
- 9.4 Europe - Market size and forecast 2023-2028
- 9.5 APAC - Market size and forecast 2023-2028
- 9.6 South America - Market size and forecast 2023-2028
- 9.7 Middle East and Africa - Market size and forecast 2023-2028
- 9.8 US - Market size and forecast 2023-2028
- 9.9 China - Market size and forecast 2023-2028
- 9.10 Russia - Market size and forecast 2023-2028
- 9.11 Canada - Market size and forecast 2023-2028
- 9.12 UK - Market size and forecast 2023-2028
- 9.13 Market opportunity By Geographical Landscape
10 Drivers, Challenges, and Trends
- 10.1 Market drivers
- 10.2 Market challenges
- 10.3 Impact of drivers and challenges
- 10.4 Market trends
11 Vendor Landscape
- 11.1 Overview
- 11.2 Vendor landscape
- 11.3 Landscape disruption
- 11.4 Industry risks
12 Vendor Analysis
- 12.1 Vendors covered
- 12.2 Market positioning of vendors
- 12.3 Airbus SE
- 12.4 AMETEK Inc.
- 12.5 BAE Systems Plc
- 12.6 General Electric Co.
- 12.7 Honeywell International Inc.
- 12.8 L3Harris Technologies Inc.
- 12.9 Leonardo DRS
- 12.10 Lockheed Martin Corp.
- 12.11 Northrop Grumman Corp.
- 12.12 Rolls Royce Holdings Plc
- 12.13 RTX Corp.
- 12.14 Safran SA
- 12.15 Textron Inc.
- 12.16 Thales Group
- 12.17 The Boeing Co
13 Appendix
- 13.1 Scope of the report
- 13.2 Inclusions and exclusions checklist
- 13.3 Currency conversion rates for US$
- 13.4 Research methodology
- 13.5 List of abbreviations
