|
|
市場調査レポート
商品コード
1494872
カーボンフットプリント管理市場の2030年までの予測: コンポーネント別、展開モード別、組織規模別、エンドユーザー別、地域別の世界分析Carbon Footprint Management Market Forecasts to 2030 - Global Analysis By Component (Solutions and Services), Deployment Mode (On-premises and Cloud), Organization Size, End User and By Geography |
||||||
カスタマイズ可能
|
|||||||
| カーボンフットプリント管理市場の2030年までの予測: コンポーネント別、展開モード別、組織規模別、エンドユーザー別、地域別の世界分析 |
|
出版日: 2024年06月06日
発行: Stratistics Market Research Consulting
ページ情報: 英文 200+ Pages
納期: 2~3営業日
|
全表示
- 概要
- 図表
- 目次
Stratistics MRCによると、世界のカーボンフットプリント管理市場は2024年に161億1,000万米ドルを占め、2030年には485億8,000万米ドルに達し、CAGR 20.2%となると予測されています。
カーボンフットプリント管理は、活動、製品、組織に関連する温室効果ガス排出量の測定、削減、相殺を含みます。このプロセスは、様々な業務から発生する二酸化炭素の総排出量を計算することから始まる。削減戦略には、エネルギー効率の改善、再生可能エネルギーの採用、廃棄物管理の強化などが含まれます。オフセットには、森林再生や再生可能エネルギーへの取り組みなど、炭素排出を削減または回収するプロジェクトへの投資が含まれます。
Japan Energy Centerによると、東南アジアは3,000億トンの二酸化炭素を貯留できます。
NRDCの報告によると、大規模なクラウドサプライヤーのサーバー利用率は65%であるのに対し、オンプレミスは15%に過ぎないです。
ペーパーレス経済への移行とクラウドコンピューティング
クラウドコンピューティングとペーパーレス経済の活用は、世界の経済全体に広がっています。中国、インド、中東のような国々は、GCGやその他の炭素ガスの発生を止めるために、これらの戦略や環境に優しいインフラを使用する企業に対して様々なインセンティブを提供しています。その実行には、設備やフィルター装置を導入することによって、工場やその他の事業における炭素排出を削減するアクションが必要になる可能性があります。カーボンフットプリント管理ソフトウェアは、これらのソリューションを採用する前に、クラウドまたはオンプレミスの展開を通じて排出レベルを確認し、データを記録するために使用され、製品の総売上高を押し上げます。
高額な初期投資
経済成長とそれに伴うエネルギー消費の増加は、低開発国や新興国にとっていくつかの利点があります。これらの国の人々も炭素排出を懸念しているが、問題の順位付けを求められると、安全保障、食糧、教育、健康、エネルギー・交通に関する懸念に次いで、最後となります。輸送、発電、工業(商業と住宅)、農業、土地利用、林業は、炭素排出を生み出す部門です。資金力の乏しい新興国の企業は、カーボンフットプリント管理ソリューションの導入や緩和戦略への取り組みに必要な財政支出のため、こうしたソリューションに投資することができないです。
低炭素政策の実施に向けた政府の取り組みが活発化
政府のプログラムはカーボンフットプリント管理システムを推進しており、これは住宅や企業が排出する排出量の測定、監視、削減に役立ちます。気候変動に取り組んでいる世界中の多くの政府や利害関係者は、温室効果ガスや環境中の排出レベルを下げるための政策や変更を常に行っています。World Energy Outlook-2021によると、120カ国以上が2030年までに排出量を削減する新たな目標を設定し、世界のCO2排出量の70%近くを占める各国政府は、2050年までにネットゼロ排出を達成すると宣言しています。これらの目標を達成するために、カーボンアクション・イニシアティブやネット・ゼロ・ガバメント・イニシアティブなど、世界の取り組みが行われています。
包括的な測定、監視、報告の課題スコープ3の排出量
企業のバリューチェーン全体で発生する間接排出の総量は、スコープ3排出量とみなされます。金融サービスセグメントでは、スコープ3の温室効果ガス(GHG)排出量は、排出量全体で重要な役割を果たしています。企業のスコープ3排出の影響は、スコープ1やスコープ2排出の数倍になる可能性があることを示す研究が増えています。金融機関のほぼすべての排出は、バリューチェーンからのものです。スコープ3排出量の開示を求める声は、多くの企業や投資活動から上がっています。また、スコープ3排出量が重要な危険指標として認識されつつあるとはいえ、その算出には困難が伴うことを認識することが肝要です。
COVID-19の影響:
一次的なCOVID-19の大流行は、施錠、社会的距離基準、リモートワークなど、当時実施されたパンデミック関連の制限により、世界のカーボンフットプリント管理市場の拡大を妨げました。その結果、多くの規則が緩和されたため、当時のカーボンフットプリント管理ソリューションのニーズは減少しました。しかし、COVID-19のロックダウンの後、経済活動が通常のレベルに戻るにつれて、気候変動と地球温暖化に対する関心の高まりがカーボンフットプリント管理システムの市場を支えています。
予測期間中、エネルギー・公益事業セグメントが最大になる見込み
エネルギー・公益事業セグメントは有利な成長が見込まれます。世界が低炭素経済への移行を目指す中、エネルギー・公益事業会社は、事業の脱炭素化と再生可能エネルギーへのシフトを強く求められています。これらの企業は、炭素回収・貯留などの炭素削減技術に多額の投資を行い、風力、太陽光、水力発電などのよりクリーンな代替エネルギーを模索しています。さらに、スマートグリッド技術の進歩により、エネルギー消費の監視と管理がより適切に行われるようになり、二酸化炭素排出量削減の取り組みがさらに進んでいます。
予測期間中にCAGRが最も高くなると予想されるクラウドセグメント
予測期間中、CAGRが最も速く成長すると予測されるのはクラウドセグメントです。クラウドベースのサービスは、継続的な可用性と高水準のセキュリティが要求されるため、世界市場に大きな影響を与えると予測されます。クラウドベースのソリューションは拡大性が高いため、多くの企業が好んで利用しています。モバイルとオンライン・アプリケーションセキュリティ市場は、クラウドベースの展開戦略の人気が高まっていることから、大幅な市場開拓が見込まれます。
最もシェアの高い地域:
北米地域は、厳しい規制の枠組みや企業の持続可能性への取り組みが重視され、カーボンフットプリント管理市場で大きな成長を遂げています。気候変動とその影響に対する意識の高まりから、企業は規制要件を満たし、カーボンニュートラルを達成するために先進的な炭素管理ソリューションを採用するようになりました。技術の進歩とグリーン技術の普及も、この成長に寄与しています。さらに、主要市場参入企業の存在と、エネルギー効率の高いシステムやサービスに対する需要の高まりが、市場の拡大を促進しています。カーボンフットプリント管理ソリューションに対する公共部門と民間部門の投資は、この増加傾向を維持すると予想されます。
CAGRが最も高い地域:
アジア太平洋は、カーボンフットプリント管理市場で著しい成長を遂げています。この拡大には、環境意識の高まり、政府の厳しい規制、同地域の急速な工業化が寄与しています。中国、インド、日本などの国々は、二酸化炭素排出量が多く、環境への影響を減らすことに取り組んでいるため、この成長をリードしています。企業による先端技術とサステイナブル実践の採用が、市場開拓をさらに後押ししています。さらに、国際的な合意や気候変動対策に対する世界の圧力が、企業にカーボンフットプリント管理ソリューションへの投資を促し、この地域の市場を押し上げています。
無料のカスタマイズサービス:
本レポートをご購読のお客様には、以下の無料カスタマイズオプションのいずれかをご利用いただけます。
- 企業プロファイル
- 追加市場参入企業の包括的プロファイリング(3社まで)
- 主要企業のSWOT分析(3社まで)
- 地域セグメンテーション
- 顧客の関心に応じた主要国の市場推定・予測・CAGR(注:フィージビリティチェックによる)
- 競合ベンチマーキング
- 製品ポートフォリオ、地理的プレゼンス、戦略的提携別の主要企業のベンチマーキング
目次
第1章 エグゼクティブ概要
第2章 序文
- 概要
- ステークホルダー
- 調査範囲
- 調査手法
- データマイニング
- データ分析
- データ検証
- 調査アプローチ
- 調査情報源
- 1次調査情報源
- 2次調査情報源
- 前提条件
第3章 市場動向分析
- イントロダクション
- 促進要因
- 抑制要因
- 機会
- 脅威
- エンドユーザー分析
- 新興市場
- COVID-19の影響
第4章 ポーターのファイブフォース分析
- 供給企業の交渉力
- 買い手の交渉力
- 代替品の脅威
- 新規参入業者の脅威
- 競争企業間の敵対関係
第5章 世界のカーボンフットプリント管理市場:コンポーネント別
- イントロダクション
- ソリューション
- サービス
- インテグレーションと展開
- サポートとメンテナンス
- コンサルティング
第6章 世界のカーボンフットプリント管理市場:展開モード別
- イントロダクション
- オンプレミス
- クラウド
第7章 世界のカーボンフットプリント管理市場:組織規模別
- イントロダクション
- 中小企業
- 一般企業
- 中堅企業
第8章 世界のカーボンフットプリント管理市場:エンドユーザー別
- イントロダクション
- 住宅と商業ビル
- ITと通信
- 政府
- 金融業務
- 運輸・物流
- エネルギー・公益事業
- 製造業
- 化学・材料
- 自動車
- 飲食品
- 金属・鉱業
- 電子機器と消費財
- その他
第9章 世界のカーボンフットプリント管理市場:地域別
- イントロダクション
- 北米
- 米国
- カナダ
- メキシコ
- 欧州
- ドイツ
- 英国
- イタリア
- フランス
- スペイン
- その他の欧州
- アジア太平洋
- 日本
- 中国
- インド
- オーストラリア
- ニュージーランド
- 韓国
- その他のアジア太平洋
- 南米
- アルゼンチン
- ブラジル
- チリ
- その他の南米
- 中東・アフリカ
- サウジアラビア
- アラブ首長国連邦
- カタール
- 南アフリカ
- その他の中東・アフリカ
第10章 主要開発
- 契約、パートナーシップ、コラボレーション、合弁事業
- 買収と合併
- 新製品発売
- 事業拡大
- その他の主要戦略
第11章 企業プロファイリング
- Carbon Footprint Ltd
- Dakota Software Corporation
- Ecova
- Enablon
- Engie
- Envirosoft Corporation
- Firstcarbon Solutions
- IBM Corporation
- Intelex Technologies ULC
- IsoMetrix Software
- Laragon Sustainability Solutions
- Locus Technologies
- NativeEnergy
- Ideagen
- Schneider Electric
- Verisae
- Wolters Kluwer N.V.
List of Tables
- Table 1 Global Carbon Footprint Management Market Outlook, By Region (2022-2030) ($MN)
- Table 2 Global Carbon Footprint Management Market Outlook, By Component (2022-2030) ($MN)
- Table 3 Global Carbon Footprint Management Market Outlook, By Solutions (2022-2030) ($MN)
- Table 4 Global Carbon Footprint Management Market Outlook, By Services (2022-2030) ($MN)
- Table 5 Global Carbon Footprint Management Market Outlook, By Integration & Deployment (2022-2030) ($MN)
- Table 6 Global Carbon Footprint Management Market Outlook, By Support & Maintenance (2022-2030) ($MN)
- Table 7 Global Carbon Footprint Management Market Outlook, By Consulting (2022-2030) ($MN)
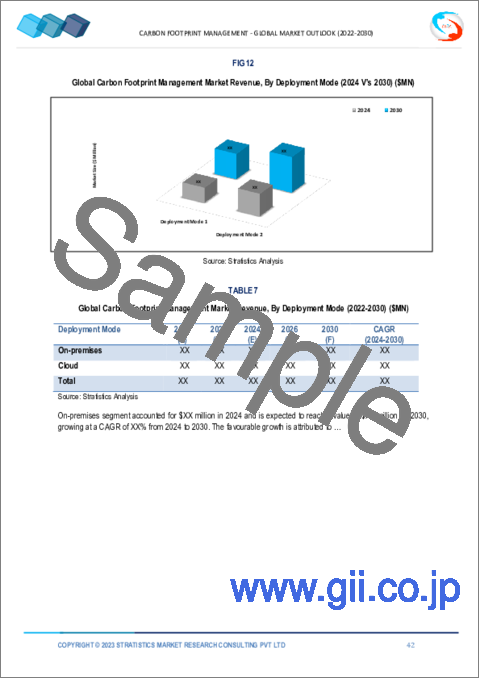
- Table 8 Global Carbon Footprint Management Market Outlook, By Deployment Mode (2022-2030) ($MN)
- Table 9 Global Carbon Footprint Management Market Outlook, By On-premises (2022-2030) ($MN)
- Table 10 Global Carbon Footprint Management Market Outlook, By Cloud (2022-2030) ($MN)
- Table 11 Global Carbon Footprint Management Market Outlook, By Organization Size (2022-2030) ($MN)
- Table 12 Global Carbon Footprint Management Market Outlook, By Small Businesses (2022-2030) ($MN)
- Table 13 Global Carbon Footprint Management Market Outlook, By Corporates/Enterprises (2022-2030) ($MN)
- Table 14 Global Carbon Footprint Management Market Outlook, By Mid-Tier Enterprises (2022-2030) ($MN)
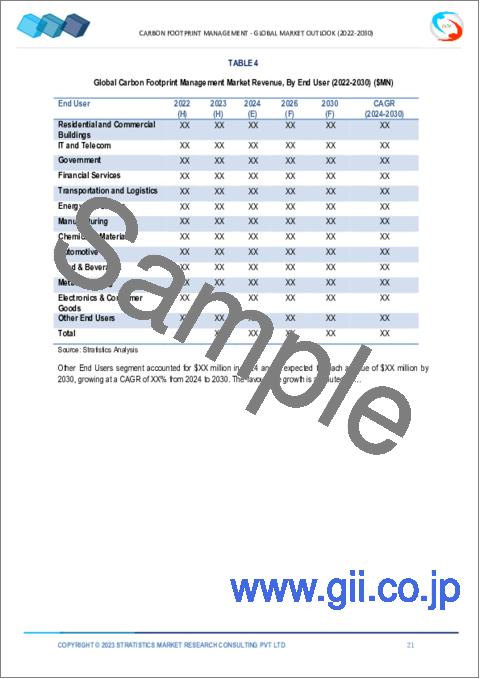
- Table 15 Global Carbon Footprint Management Market Outlook, By End User (2022-2030) ($MN)
- Table 16 Global Carbon Footprint Management Market Outlook, By Residential and Commercial Buildings (2022-2030) ($MN)
- Table 17 Global Carbon Footprint Management Market Outlook, By IT and Telecom (2022-2030) ($MN)
- Table 18 Global Carbon Footprint Management Market Outlook, By Government (2022-2030) ($MN)
- Table 19 Global Carbon Footprint Management Market Outlook, By Financial Services (2022-2030) ($MN)
- Table 20 Global Carbon Footprint Management Market Outlook, By Transportation and Logistics (2022-2030) ($MN)
- Table 21 Global Carbon Footprint Management Market Outlook, By Energy and Utilities (2022-2030) ($MN)
- Table 22 Global Carbon Footprint Management Market Outlook, By Manufacturing (2022-2030) ($MN)
- Table 23 Global Carbon Footprint Management Market Outlook, By Chemical & Materials (2022-2030) ($MN)
- Table 24 Global Carbon Footprint Management Market Outlook, By Automotive (2022-2030) ($MN)
- Table 25 Global Carbon Footprint Management Market Outlook, By Food & Beverages (2022-2030) ($MN)
- Table 26 Global Carbon Footprint Management Market Outlook, By Metals & Mining (2022-2030) ($MN)
- Table 27 Global Carbon Footprint Management Market Outlook, By Electronics & Consumer Goods (2022-2030) ($MN)
- Table 28 Global Carbon Footprint Management Market Outlook, By Other End Users (2022-2030) ($MN)
Note: Tables for North America, Europe, APAC, South America, and Middle East & Africa Regions are also represented in the same manner as above.
According to Stratistics MRC, the Global Carbon Footprint Management Market is accounted for $16.11 billion in 2024 and is expected to reach $48.58 billion by 2030 growing at a CAGR of 20.2% during the forecast period. Carbon Footprint Management involves measuring, reducing, and offsetting the greenhouse gas emissions associated with activities, products, or organizations. This process starts with calculating the total carbon emissions, often expressed in CO2 equivalents, generated by various operations. Strategies for reduction include improving energy efficiency, adopting renewable energy sources, and enhancing waste management practices. Offsetting involves investing in projects that reduce or capture carbon emissions, such as reforestation or renewable energy initiatives.
According to the Japan Energy Center, Southeast Asia can reserve 300 billion tons of carbon dioxide.
According to a report by NRDC, a large-scale cloud supplier has a server utilization rate of 65% compared to on-premises, which is only 15%.
Market Dynamics:
Driver:
The transition to a paperless economy and cloud computing
The utilization of cloud computing and a paperless economy is widespread throughout the world's economies. Countries like China, India, and the Middle East provide various incentives for businesses use these strategies and environmentally friendly infrastructure to stop the generation of GCG and other carbon gases. Their execution might need actions to reduce carbon emissions in factories and other businesses by deploying equipment and filtering devices. Carbon footprint management software is used to ascertain emission levels and record data through cloud or on-premises deployment prior to employing these solutions, driving total sales of the product.
Restraint:
High initial expenditures
Economic growth and the resulting rise in energy consumption have several advantages for underdeveloped and emerging nations. People in these nations are also concerned about carbon emissions, but when asked to rank problems, they place it last, behind worries about security, food, education, health, and energy and transportation. Transportation, power generation, industry (commercial and residential), agriculture, land use, and forestry are the sectors that produce carbon emissions. Companies in emerging nations with low money are unable to invest in such solutions due to the financial expenditure needed to deploy carbon footprint management solutions and work on mitigation strategies.
Opportunity:
Government efforts to implement low-carbon policies are increasing
Government programs promote carbon footprint management systems, which can assist in measuring, monitoring, and lowering emissions produced by residences and companies. Many governments and stakeholders throughout the world that are working on climate change are constantly making policies and changes to lower greenhouse gases and emission levels in the environment. More than 120 nations have set new goals for reducing emissions by 2030, and governments responsible for almost 70% of the world's CO2 emissions have vowed to achieve net-zero emissions by 2050, according to the World Energy Outlook-2021. Global initiatives have been made to reach these goals, including the Carbon Action Initiative and the Net-Zero Government Initiative.
Threat:
Comprehensive measurement, monitoring, and reporting challenges emissions in scope 3
The total amounts of indirect emissions that take place across a company's value chain are considered scope 3 emissions. In the financial services sector, scope 3 greenhouse gas (GHG) emissions play a significant role in overall emissions. A increasing corpus of studies demonstrates that the impact of a company's scope 3 emissions can be several times greater than its scope 1 and scope 2 emissions. Nearly all emissions for financial organizations come from the value chain. Demands for the disclosure of scope 3 emissions are coming from a number of businesses and investment efforts. It is also crucial to recognize that there are difficulties in calculating scope 3 emissions, even though they are increasingly recognized as a significant danger indicator.
Covid-19 Impact:
The primary COVID-19 pandemic outbreak impeded the expansion of the global carbon footprint management market due to the pandemic-related limitations that were put in place at the time, including lockdowns, social distance standards, and remote working. As a result, there was a decline in the need for carbon footprint management solutions at the time because numerous rules had been loosened. However, as economic activity returns to normal levels following the COVID-19 lockdowns, the rising concern about climate change and global warming is helping to sustain the market for carbon footprint control systems.
The energy and utilities segment is expected to be the largest during the forecast period
The energy and utilities segment is expected to have a lucrative growth. As the world seeks to transition to a low-carbon economy, energy and utility companies are under immense pressure to decarbonize their operations and shift towards renewable energy sources. These companies are investing heavily in carbon reduction technologies, such as carbon capture and storage, and exploring cleaner energy alternatives like wind, solar, and hydropower. Additionally, advancements in smart grid technologies enable better monitoring and management of energy consumption, further aiding in carbon footprint reduction efforts.
The cloud segment is expected to have the highest CAGR during the forecast period
The cloud segment is anticipated to witness the fastest CAGR growth during the forecast period. It is projected that cloud-based services would have a significant influence on the worldwide market, in a significant way because of the requirement for continuous availability and higher standards of security. Many firms have shown a preference for cloud-based solutions due to their higher scalability. The market for mobile and online application security is anticipated to have substantial development due to the rising popularity of cloud-based deployment strategies.
Region with largest share:
The North American region is experiencing significant growth in the carbon footprint management market, driven by stringent regulatory frameworks and a strong emphasis on corporate sustainability initiatives. The increasing awareness of climate change and its impacts has led businesses to adopt advanced carbon management solutions to meet regulatory requirements and achieve carbon neutrality. Technological advancements and the proliferation of green technologies are also contributing to this growth. Furthermore, the presence of key market players and the rising demand for energy-efficient systems and services are fostering market expansion. Public and private sector investments in carbon footprint management solutions are anticipated to sustain this upward trend.
Region with highest CAGR:
The Asia-Pacific region is experiencing significant growth in the carbon footprint management market. This expansion is driven by increased environmental awareness, stringent government regulations, and the region's rapid industrialization. Countries such as China, India, and Japan are leading this growth due to their high carbon emissions and commitment to reducing their environmental impact. The adoption of advanced technologies and sustainable practices by businesses further propels market development. Additionally, international agreements and global pressure for climate action are pushing corporations to invest in carbon footprint management solutions, boosting the market in this region.
Key players in the market
Some of the key players in Carbon Footprint Management market include Carbon Footprint Ltd, Dakota Software Corporation, Ecova, Enablon, Engie, Envirosoft Corporation, Firstcarbon Solutions, IBM Corporation, Intelex Technologies ULC, IsoMetrix Software, Laragon Sustainability Solutions, Locus Technologies, NativeEnergy, Ideagen, Schneider Electric, Verisae and Wolters Kluwer N.V.
Key Developments:
In May 2024, During the annual IBM Think conference, IBM announced it is working with Amazon Web Services (AWS) to make the full portfolio of IBM offerings within the watsonx artificial intelligence (AI) and data platform available for use with AWS services. The companies plan to integrate IBM watsonx.governance and Amazon SageMaker, a service to build, train, and deploy machine learning (ML) and generative AI models with fully managed infrastructure, tools, and workflows, to help Amazon SageMaker and watsonx customers manage model risk and support compliance obligations in connection with recent regulatory requirements such as the EU AI Act.
In April 2024, Engie plans to invest Rs 7,000 crore by 2025 to add an additional solar capacity of 2 GW in India. Engie currently has an operational portfolio of about 1.1 GW of renewable assets, with an additional 1.25 GW capacity secured over the past 18 months through utility-scale renewable tenders. By the end of 2025, Engie's operational capacity would reach close to 2.3 GW, with with a target to reach a capacity of 5.5-6GW by 2030.
Components Covered:
- Solutions
- Services
Deployment Modes Covered:
- On-premises
- Cloud
Organization Sizes Covered:
- Small Businesses
- Corporates/Enterprises
- Mid-Tier Enterprises
End Users Covered:
- Residential and Commercial Buildings
- IT and Telecom
- Government
- Financial Services
- Transportation and Logistics
- Energy and Utilities
- Manufacturing
- Chemical & Materials
- Automotive
- Food & Beverages
- Metals & Mining
- Electronics & Consumer Goods
- Other End Users
Regions Covered:
- North America
- US
- Canada
- Mexico
- Europe
- Germany
- UK
- Italy
- France
- Spain
- Rest of Europe
- Asia Pacific
- Japan
- China
- India
- Australia
- New Zealand
- South Korea
- Rest of Asia Pacific
- South America
- Argentina
- Brazil
- Chile
- Rest of South America
- Middle East & Africa
- Saudi Arabia
- UAE
- Qatar
- South Africa
- Rest of Middle East & Africa
What our report offers:
- Market share assessments for the regional and country-level segments
- Strategic recommendations for the new entrants
- Covers Market data for the years 2022, 2023, 2024, 2026, and 2030
- Market Trends (Drivers, Constraints, Opportunities, Threats, Challenges, Investment Opportunities, and recommendations)
- Strategic recommendations in key business segments based on the market estimations
- Competitive landscaping mapping the key common trends
- Company profiling with detailed strategies, financials, and recent developments
- Supply chain trends mapping the latest technological advancements
Free Customization Offerings:
All the customers of this report will be entitled to receive one of the following free customization options:
- Company Profiling
- Comprehensive profiling of additional market players (up to 3)
- SWOT Analysis of key players (up to 3)
- Regional Segmentation
- Market estimations, Forecasts and CAGR of any prominent country as per the client's interest (Note: Depends on feasibility check)
- Competitive Benchmarking
- Benchmarking of key players based on product portfolio, geographical presence, and strategic alliances
Table of Contents
1 Executive Summary
2 Preface
- 2.1 Abstract
- 2.2 Stake Holders
- 2.3 Research Scope
- 2.4 Research Methodology
- 2.4.1 Data Mining
- 2.4.2 Data Analysis
- 2.4.3 Data Validation
- 2.4.4 Research Approach
- 2.5 Research Sources
- 2.5.1 Primary Research Sources
- 2.5.2 Secondary Research Sources
- 2.5.3 Assumptions
3 Market Trend Analysis
- 3.1 Introduction
- 3.2 Drivers
- 3.3 Restraints
- 3.4 Opportunities
- 3.5 Threats
- 3.6 End User Analysis
- 3.7 Emerging Markets
- 3.8 Impact of Covid-19
4 Porters Five Force Analysis
- 4.1 Bargaining power of suppliers
- 4.2 Bargaining power of buyers
- 4.3 Threat of substitutes
- 4.4 Threat of new entrants
- 4.5 Competitive rivalry
5 Global Carbon Footprint Management Market, By Component
- 5.1 Introduction
- 5.2 Solutions
- 5.3 Services
- 5.3.1 Integration & Deployment
- 5.3.2 Support & Maintenance
- 5.3.3 Consulting
6 Global Carbon Footprint Management Market, By Deployment Mode
- 6.1 Introduction
- 6.2 On-premises
- 6.3 Cloud
7 Global Carbon Footprint Management Market, By Organization Size
- 7.1 Introduction
- 7.2 Small Businesses
- 7.3 Corporates/Enterprises
- 7.4 Mid-Tier Enterprises
8 Global Carbon Footprint Management Market, By End User
- 8.1 Introduction
- 8.2 Residential and Commercial Buildings
- 8.3 IT and Telecom
- 8.4 Government
- 8.5 Financial Services
- 8.6 Transportation and Logistics
- 8.7 Energy and Utilities
- 8.8 Manufacturing
- 8.9 Chemical & Materials
- 8.10 Automotive
- 8.11 Food & Beverages
- 8.12 Metals & Mining
- 8.13 Electronics & Consumer Goods
- 8.14 Other End Users
9 Global Carbon Footprint Management Market, By Geography
- 9.1 Introduction
- 9.2 North America
- 9.2.1 US
- 9.2.2 Canada
- 9.2.3 Mexico
- 9.3 Europe
- 9.3.1 Germany
- 9.3.2 UK
- 9.3.3 Italy
- 9.3.4 France
- 9.3.5 Spain
- 9.3.6 Rest of Europe
- 9.4 Asia Pacific
- 9.4.1 Japan
- 9.4.2 China
- 9.4.3 India
- 9.4.4 Australia
- 9.4.5 New Zealand
- 9.4.6 South Korea
- 9.4.7 Rest of Asia Pacific
- 9.5 South America
- 9.5.1 Argentina
- 9.5.2 Brazil
- 9.5.3 Chile
- 9.5.4 Rest of South America
- 9.6 Middle East & Africa
- 9.6.1 Saudi Arabia
- 9.6.2 UAE
- 9.6.3 Qatar
- 9.6.4 South Africa
- 9.6.5 Rest of Middle East & Africa
10 Key Developments
- 10.1 Agreements, Partnerships, Collaborations and Joint Ventures
- 10.2 Acquisitions & Mergers
- 10.3 New Product Launch
- 10.4 Expansions
- 10.5 Other Key Strategies
11 Company Profiling
- 11.1 Carbon Footprint Ltd
- 11.2 Dakota Software Corporation
- 11.3 Ecova
- 11.4 Enablon
- 11.5 Engie
- 11.6 Envirosoft Corporation
- 11.7 Firstcarbon Solutions
- 11.8 IBM Corporation
- 11.9 Intelex Technologies ULC
- 11.10 IsoMetrix Software
- 11.11 Laragon Sustainability Solutions
- 11.12 Locus Technologies
- 11.13 NativeEnergy
- 11.14 Ideagen
- 11.15 Schneider Electric
- 11.16 Verisae
- 11.17 Wolters Kluwer N.V.


