|
|
市場調査レポート
商品コード
1645687
SUVの世界市場、2025-2029年Global SUV Market 2025-2029 |
||||||

|
|||||||
カスタマイズ可能
|
|||||||


| SUVの世界市場、2025-2029年 |
|
出版日: 2025年01月21日
発行: TechNavio
ページ情報: 英文 199 Pages
納期: 即納可能
|

全表示
- 概要
- 図表
- 目次
SUV市場は2024-2029年に2,667億米ドル、予測期間中のCAGRは5.4%で成長すると予測されます。
当レポートでは、SUV市場の全体的な分析、市場規模・予測、動向、成長促進要因、課題、約25のベンダーを網羅したベンダー分析などを掲載しています。
現在の市場シナリオ、最新動向と促進要因、市場環境全体に関する最新分析を提供しています。市場は、SUVの販売を牽引する安全性と快適性への嗜好の高まり、オフロード走行のための4輪駆動および全輪駆動オプションへの需要の高まり、アッパーミドルクラスの家族によるSUVへの嗜好の高まりによって牽引されています。
| 市場範囲 | |
|---|---|
| 基準年 | 2025 |
| 終了年 | 2029 |
| 予測期間 | 2025-2029 |
| 成長モメンタム | 加速 |
| 前年比2025年 | 5% |
| CAGR | 5.4% |
| 増分額 | 2,667億米ドル |
本調査では、今後数年間のSUV市場の成長を牽引する主な要因の1つとして、電気自動車とハイブリッドSUVの急速な市場開拓を挙げています。また、高級SUVの技術更新の増加や、既存自動車メーカーによるSUV向けサブスクリプション・サービスの導入は、市場の大きな需要につながります。
目次
第1章 エグゼクティブサマリー
- 市場概要
第2章 Technavio分析
- 価格・ライフサイクル・顧客購入バスケット・採用率・購入基準の分析
- インプットの重要性と差別化の要因
- 混乱の要因
- 促進要因と課題の影響
第3章 市場情勢
- 市場エコシステム
- 市場の特徴
- バリューチェーン分析
第4章 市場規模
- 市場の定義
- 市場セグメント分析
- 市場規模 2024
- 市場の見通し 2024-2029
第5章 市場規模実績
- SUVの世界市場 2019-2023
- 車両タイプセグメント分析 2019-2023
- 燃料タイプセグメント分析 2019-2023
- 地域別セグメント分析 2019-2023
- 国別セグメント分析 2019-2023
第6章 定性分析
- AIの影響:SUVの世界市場
第7章 ファイブフォース分析
- ファイブフォースの要約
- 買い手の交渉力
- 供給企業の交渉力
- 新規参入業者の脅威
- 代替品の脅威
- 競争の脅威
- 市況
第8章 市場セグメンテーション:車両タイプ別
- 市場セグメント
- 比較:車両タイプ別
- 中型SUV:市場規模と予測 2024-2029
- クロスオーバーSUVとコンパクトSUV:市場規模と予測 2024-2029
- 大型SUV:市場規模と予測 2024-2029
- 市場機会:車両タイプ別
第9章 市場セグメンテーション:燃料の種類別
- 市場セグメント
- 比較:燃料の種類別
- ガソリン:市場規模と予測 2024-2029
- ハイブリッドSUVと電気 SUV:市場規模と予測 2024-2029
- ディーゼル:市場規模と予測 2024-2029
- 市場機会:燃料の種類別
第10章 顧客情勢
- 顧客情勢の概要
第11章 地域別情勢
- 地域別セグメンテーション
- 地域別比較
- アジア太平洋:市場規模と予測 2024-2029
- 欧州:市場規模と予測 2024-2029
- 北米:市場規模と予測 2024-2029
- 中東・アフリカ:市場規模と予測 2024-2029
- 南米:市場規模と予測 2024-2029
- 中国:市場規模と予測 2024-2029
- インド:市場規模と予測 2024-2029
- 日本:市場規模と予測 2024-2029
- 米国:市場規模と予測 2024-2029
- ドイツ:市場規模と予測 2024-2029
- 英国:市場規模と予測 2024-2029
- カナダ:市場規模と予測 2024-2029
- フランス:市場規模と予測 2024-2029
- オーストラリア:市場規模と予測 2024-2029
- ブラジル:市場規模と予測 2024-2029
- 市場機会:地域情勢別
第12章 促進要因・課題・機会・抑制要因
- 市場促進要因
- 市場の課題
- 促進要因と課題の影響
- 市場の機会・抑制要因
第13章 競合情勢
- 概要
- 競合情勢
- 混乱の状況
- 業界のリスク
第14章 競合分析
- 企業プロファイル
- 企業ランキング指数
- 企業の市場ポジショニング
- AB Volvo
- Bayerische Motoren Werke AG
- BYD Co. Ltd.
- Ford Motor Co.
- General Motors Co.
- Mazda Motor Corp.
- Mercedes Benz Group AG
- Mitsubishi Motors Corp.
- Nissan Motor Co. Ltd.
- Renault SAS
- Stellantis NV
- Tata Motors Ltd.
- Tesla Inc.
- Toyota Motor Corp.
- Volkswagen AG
第15章 付録
Exhibits:
- Exhibits1: Executive Summary - Chart on Market Overview
- Exhibits2: Executive Summary - Data Table on Market Overview
- Exhibits3: Executive Summary - Chart on Global Market Characteristics
- Exhibits4: Executive Summary - Chart on Market By Geographical Landscape
- Exhibits5: Executive Summary - Chart on Market Segmentation by Vehicle Type
- Exhibits6: Executive Summary - Chart on Market Segmentation by Fuel Type
- Exhibits7: Executive Summary - Chart on Incremental Growth
- Exhibits8: Executive Summary - Data Table on Incremental Growth
- Exhibits9: Executive Summary - Chart on Company Market Positioning
- Exhibits10: Analysis of price sensitivity, lifecycle, customer purchase basket, adoption rates, and purchase criteria
- Exhibits11: Overview on criticality of inputs and factors of differentiation
- Exhibits12: Overview on factors of disruption
- Exhibits13: Impact of drivers and challenges in 2024 and 2029
- Exhibits14: Parent Market
- Exhibits15: Data Table on - Parent Market
- Exhibits16: Market characteristics analysis
- Exhibits17: Value chain analysis
- Exhibits18: Offerings of companies included in the market definition
- Exhibits19: Market segments
- Exhibits20: Chart on Global - Market size and forecast 2024-2029 ($ billion)
- Exhibits21: Data Table on Global - Market size and forecast 2024-2029 ($ billion)
- Exhibits22: Chart on Global Market: Year-over-year growth 2024-2029 (%)
- Exhibits23: Data Table on Global Market: Year-over-year growth 2024-2029 (%)
- Exhibits24: Historic Market Size - Data Table on Global SUV Market 2019 - 2023 ($ billion)
- Exhibits25: Historic Market Size - Vehicle Type Segment 2019 - 2023 ($ billion)
- Exhibits26: Historic Market Size - Fuel Type Segment 2019 - 2023 ($ billion)
- Exhibits27: Historic Market Size - Geography Segment 2019 - 2023 ($ billion)
- Exhibits28: Historic Market Size - Country Segment 2019 - 2023 ($ billion)
- Exhibits29: Five forces analysis - Comparison between 2024 and 2029
- Exhibits30: Bargaining power of buyers - Impact of key factors 2024 and 2029
- Exhibits31: Bargaining power of suppliers - Impact of key factors in 2024 and 2029
- Exhibits32: Threat of new entrants - Impact of key factors in 2024 and 2029
- Exhibits33: Threat of substitutes - Impact of key factors in 2024 and 2029
- Exhibits34: Threat of rivalry - Impact of key factors in 2024 and 2029
- Exhibits35: Chart on Market condition - Five forces 2024 and 2029
- Exhibits36: Chart on Vehicle Type - Market share 2024-2029 (%)
- Exhibits37: Data Table on Vehicle Type - Market share 2024-2029 (%)
- Exhibits38: Chart on Comparison by Vehicle Type
- Exhibits39: Data Table on Comparison by Vehicle Type
- Exhibits40: Chart on Medium-sized SUVs - Market size and forecast 2024-2029 ($ billion)
- Exhibits41: Data Table on Medium-sized SUVs - Market size and forecast 2024-2029 ($ billion)
- Exhibits42: Chart on Medium-sized SUVs - Year-over-year growth 2024-2029 (%)
- Exhibits43: Data Table on Medium-sized SUVs - Year-over-year growth 2024-2029 (%)
- Exhibits44: Chart on Crossover and compact SUVs - Market size and forecast 2024-2029 ($ billion)
- Exhibits45: Data Table on Crossover and compact SUVs - Market size and forecast 2024-2029 ($ billion)
- Exhibits46: Chart on Crossover and compact SUVs - Year-over-year growth 2024-2029 (%)
- Exhibits47: Data Table on Crossover and compact SUVs - Year-over-year growth 2024-2029 (%)
- Exhibits48: Chart on Large-sized SUVs - Market size and forecast 2024-2029 ($ billion)
- Exhibits49: Data Table on Large-sized SUVs - Market size and forecast 2024-2029 ($ billion)
- Exhibits50: Chart on Large-sized SUVs - Year-over-year growth 2024-2029 (%)
- Exhibits51: Data Table on Large-sized SUVs - Year-over-year growth 2024-2029 (%)
- Exhibits52: Market opportunity by Vehicle Type ($ billion)
- Exhibits53: Data Table on Market opportunity by Vehicle Type ($ billion)
- Exhibits54: Chart on Fuel Type - Market share 2024-2029 (%)
- Exhibits55: Data Table on Fuel Type - Market share 2024-2029 (%)
- Exhibits56: Chart on Comparison by Fuel Type
- Exhibits57: Data Table on Comparison by Fuel Type
- Exhibits58: Chart on Gasoline - Market size and forecast 2024-2029 ($ billion)
- Exhibits59: Data Table on Gasoline - Market size and forecast 2024-2029 ($ billion)
- Exhibits60: Chart on Gasoline - Year-over-year growth 2024-2029 (%)
- Exhibits61: Data Table on Gasoline - Year-over-year growth 2024-2029 (%)
- Exhibits62: Chart on Hybrid and electric SUV - Market size and forecast 2024-2029 ($ billion)
- Exhibits63: Data Table on Hybrid and electric SUV - Market size and forecast 2024-2029 ($ billion)
- Exhibits64: Chart on Hybrid and electric SUV - Year-over-year growth 2024-2029 (%)
- Exhibits65: Data Table on Hybrid and electric SUV - Year-over-year growth 2024-2029 (%)
- Exhibits66: Chart on Diesel - Market size and forecast 2024-2029 ($ billion)
- Exhibits67: Data Table on Diesel - Market size and forecast 2024-2029 ($ billion)
- Exhibits68: Chart on Diesel - Year-over-year growth 2024-2029 (%)
- Exhibits69: Data Table on Diesel - Year-over-year growth 2024-2029 (%)
- Exhibits70: Market opportunity by Fuel Type ($ billion)
- Exhibits71: Data Table on Market opportunity by Fuel Type ($ billion)
- Exhibits72: Analysis of price sensitivity, lifecycle, customer purchase basket, adoption rates, and purchase criteria
- Exhibits73: Chart on Market share By Geographical Landscape 2024-2029 (%)
- Exhibits74: Data Table on Market share By Geographical Landscape 2024-2029 (%)
- Exhibits75: Chart on Geographic comparison
- Exhibits76: Data Table on Geographic comparison
- Exhibits77: Chart on APAC - Market size and forecast 2024-2029 ($ billion)
- Exhibits78: Data Table on APAC - Market size and forecast 2024-2029 ($ billion)
- Exhibits79: Chart on APAC - Year-over-year growth 2024-2029 (%)
- Exhibits80: Data Table on APAC - Year-over-year growth 2024-2029 (%)
- Exhibits81: Chart on Europe - Market size and forecast 2024-2029 ($ billion)
- Exhibits82: Data Table on Europe - Market size and forecast 2024-2029 ($ billion)
- Exhibits83: Chart on Europe - Year-over-year growth 2024-2029 (%)
- Exhibits84: Data Table on Europe - Year-over-year growth 2024-2029 (%)
- Exhibits85: Chart on North America - Market size and forecast 2024-2029 ($ billion)
- Exhibits86: Data Table on North America - Market size and forecast 2024-2029 ($ billion)
- Exhibits87: Chart on North America - Year-over-year growth 2024-2029 (%)
- Exhibits88: Data Table on North America - Year-over-year growth 2024-2029 (%)
- Exhibits89: Chart on Middle East and Africa - Market size and forecast 2024-2029 ($ billion)
- Exhibits90: Data Table on Middle East and Africa - Market size and forecast 2024-2029 ($ billion)
- Exhibits91: Chart on Middle East and Africa - Year-over-year growth 2024-2029 (%)
- Exhibits92: Data Table on Middle East and Africa - Year-over-year growth 2024-2029 (%)
- Exhibits93: Chart on South America - Market size and forecast 2024-2029 ($ billion)
- Exhibits94: Data Table on South America - Market size and forecast 2024-2029 ($ billion)
- Exhibits95: Chart on South America - Year-over-year growth 2024-2029 (%)
- Exhibits96: Data Table on South America - Year-over-year growth 2024-2029 (%)
- Exhibits97: Chart on China - Market size and forecast 2024-2029 ($ billion)
- Exhibits98: Data Table on China - Market size and forecast 2024-2029 ($ billion)
- Exhibits99: Chart on China - Year-over-year growth 2024-2029 (%)
- Exhibits100: Data Table on China - Year-over-year growth 2024-2029 (%)
- Exhibits101: Chart on India - Market size and forecast 2024-2029 ($ billion)
- Exhibits102: Data Table on India - Market size and forecast 2024-2029 ($ billion)
- Exhibits103: Chart on India - Year-over-year growth 2024-2029 (%)
- Exhibits104: Data Table on India - Year-over-year growth 2024-2029 (%)
- Exhibits105: Chart on Japan - Market size and forecast 2024-2029 ($ billion)
- Exhibits106: Data Table on Japan - Market size and forecast 2024-2029 ($ billion)
- Exhibits107: Chart on Japan - Year-over-year growth 2024-2029 (%)
- Exhibits108: Data Table on Japan - Year-over-year growth 2024-2029 (%)
- Exhibits109: Chart on US - Market size and forecast 2024-2029 ($ billion)
- Exhibits110: Data Table on US - Market size and forecast 2024-2029 ($ billion)
- Exhibits111: Chart on US - Year-over-year growth 2024-2029 (%)
- Exhibits112: Data Table on US - Year-over-year growth 2024-2029 (%)
- Exhibits113: Chart on Germany - Market size and forecast 2024-2029 ($ billion)
- Exhibits114: Data Table on Germany - Market size and forecast 2024-2029 ($ billion)
- Exhibits115: Chart on Germany - Year-over-year growth 2024-2029 (%)
- Exhibits116: Data Table on Germany - Year-over-year growth 2024-2029 (%)
- Exhibits117: Chart on UK - Market size and forecast 2024-2029 ($ billion)
- Exhibits118: Data Table on UK - Market size and forecast 2024-2029 ($ billion)
- Exhibits119: Chart on UK - Year-over-year growth 2024-2029 (%)
- Exhibits120: Data Table on UK - Year-over-year growth 2024-2029 (%)
- Exhibits121: Chart on Canada - Market size and forecast 2024-2029 ($ billion)
- Exhibits122: Data Table on Canada - Market size and forecast 2024-2029 ($ billion)
- Exhibits123: Chart on Canada - Year-over-year growth 2024-2029 (%)
- Exhibits124: Data Table on Canada - Year-over-year growth 2024-2029 (%)
- Exhibits125: Chart on France - Market size and forecast 2024-2029 ($ billion)
- Exhibits126: Data Table on France - Market size and forecast 2024-2029 ($ billion)
- Exhibits127: Chart on France - Year-over-year growth 2024-2029 (%)
- Exhibits128: Data Table on France - Year-over-year growth 2024-2029 (%)
- Exhibits129: Chart on Australia - Market size and forecast 2024-2029 ($ billion)
- Exhibits130: Data Table on Australia - Market size and forecast 2024-2029 ($ billion)
- Exhibits131: Chart on Australia - Year-over-year growth 2024-2029 (%)
- Exhibits132: Data Table on Australia - Year-over-year growth 2024-2029 (%)
- Exhibits133: Chart on Brazil - Market size and forecast 2024-2029 ($ billion)
- Exhibits134: Data Table on Brazil - Market size and forecast 2024-2029 ($ billion)
- Exhibits135: Chart on Brazil - Year-over-year growth 2024-2029 (%)
- Exhibits136: Data Table on Brazil - Year-over-year growth 2024-2029 (%)
- Exhibits137: Market opportunity By Geographical Landscape ($ billion)
- Exhibits138: Data Tables on Market opportunity By Geographical Landscape ($ billion)
- Exhibits139: Impact of drivers and challenges in 2024 and 2029
- Exhibits140: Overview on criticality of inputs and factors of differentiation
- Exhibits141: Overview on factors of disruption
- Exhibits142: Impact of key risks on business
- Exhibits143: Companies covered
- Exhibits144: Company ranking index
- Exhibits145: Matrix on companies position and classification
- Exhibits146: AB Volvo - Overview
- Exhibits147: AB Volvo - Business segments
- Exhibits148: AB Volvo - Key news
- Exhibits149: AB Volvo - Key offerings
- Exhibits150: AB Volvo - Segment focus
- Exhibits151: SWOT
- Exhibits152: Bayerische Motoren Werke AG - Overview
- Exhibits153: Bayerische Motoren Werke AG - Business segments
- Exhibits154: Bayerische Motoren Werke AG - Key news
- Exhibits155: Bayerische Motoren Werke AG - Key offerings
- Exhibits156: Bayerische Motoren Werke AG - Segment focus
- Exhibits157: SWOT
- Exhibits158: BYD Co. Ltd. - Overview
- Exhibits159: BYD Co. Ltd. - Business segments
- Exhibits160: BYD Co. Ltd. - Key news
- Exhibits161: BYD Co. Ltd. - Key offerings
- Exhibits162: BYD Co. Ltd. - Segment focus
- Exhibits163: SWOT
- Exhibits164: Ford Motor Co. - Overview
- Exhibits165: Ford Motor Co. - Business segments
- Exhibits166: Ford Motor Co. - Key offerings
- Exhibits167: Ford Motor Co. - Segment focus
- Exhibits168: SWOT
- Exhibits169: General Motors Co. - Overview
- Exhibits170: General Motors Co. - Business segments
- Exhibits171: General Motors Co. - Key news
- Exhibits172: General Motors Co. - Key offerings
- Exhibits173: General Motors Co. - Segment focus
- Exhibits174: SWOT
- Exhibits175: Mazda Motor Corp. - Overview
- Exhibits176: Mazda Motor Corp. - Business segments
- Exhibits177: Mazda Motor Corp. - Key offerings
- Exhibits178: Mazda Motor Corp. - Segment focus
- Exhibits179: SWOT
- Exhibits180: Mercedes Benz Group AG - Overview
- Exhibits181: Mercedes Benz Group AG - Product / Service
- Exhibits182: Mercedes Benz Group AG - Key offerings
- Exhibits183: SWOT
- Exhibits184: Mitsubishi Motors Corp. - Overview
- Exhibits185: Mitsubishi Motors Corp. - Business segments
- Exhibits186: Mitsubishi Motors Corp. - Key news
- Exhibits187: Mitsubishi Motors Corp. - Key offerings
- Exhibits188: Mitsubishi Motors Corp. - Segment focus
- Exhibits189: SWOT
- Exhibits190: Nissan Motor Co. Ltd. - Overview
- Exhibits191: Nissan Motor Co. Ltd. - Business segments
- Exhibits192: Nissan Motor Co. Ltd. - Key news
- Exhibits193: Nissan Motor Co. Ltd. - Key offerings
- Exhibits194: Nissan Motor Co. Ltd. - Segment focus
- Exhibits195: SWOT
- Exhibits196: Renault SAS - Overview
- Exhibits197: Renault SAS - Product / Service
- Exhibits198: Renault SAS - Key news
- Exhibits199: Renault SAS - Key offerings
- Exhibits200: SWOT
- Exhibits201: Stellantis NV - Overview
- Exhibits202: Stellantis NV - Business segments
- Exhibits203: Stellantis NV - Key news
- Exhibits204: Stellantis NV - Key offerings
- Exhibits205: Stellantis NV - Segment focus
- Exhibits206: SWOT
- Exhibits207: Tata Motors Ltd. - Overview
- Exhibits208: Tata Motors Ltd. - Business segments
- Exhibits209: Tata Motors Ltd. - Key news
- Exhibits210: Tata Motors Ltd. - Key offerings
- Exhibits211: Tata Motors Ltd. - Segment focus
- Exhibits212: SWOT
- Exhibits213: Tesla Inc. - Overview
- Exhibits214: Tesla Inc. - Business segments
- Exhibits215: Tesla Inc. - Key news
- Exhibits216: Tesla Inc. - Key offerings
- Exhibits217: Tesla Inc. - Segment focus
- Exhibits218: SWOT
- Exhibits219: Toyota Motor Corp. - Overview
- Exhibits220: Toyota Motor Corp. - Business segments
- Exhibits221: Toyota Motor Corp. - Key news
- Exhibits222: Toyota Motor Corp. - Key offerings
- Exhibits223: Toyota Motor Corp. - Segment focus
- Exhibits224: SWOT
- Exhibits225: Volkswagen AG - Overview
- Exhibits226: Volkswagen AG - Business segments
- Exhibits227: Volkswagen AG - Key news
- Exhibits228: Volkswagen AG - Key offerings
- Exhibits229: Volkswagen AG - Segment focus
- Exhibits230: SWOT
- Exhibits231: Inclusions checklist
- Exhibits232: Exclusions checklist
- Exhibits233: Currency conversion rates for US$
- Exhibits234: Research methodology
- Exhibits235: Information sources
- Exhibits236: Data validation
- Exhibits237: Validation techniques employed for market sizing
- Exhibits238: Data synthesis
- Exhibits239: 360 degree market analysis
- Exhibits240: List of abbreviations
The suv market is forecasted to grow by USD 266.7 bn during 2024-2029, accelerating at a CAGR of 5.4% during the forecast period. The report on the suv market provides a holistic analysis, market size and forecast, trends, growth drivers, and challenges, as well as vendor analysis covering around 25 vendors.
The report offers an up-to-date analysis regarding the current market scenario, the latest trends and drivers, and the overall market environment. The market is driven by increased preference for safety and comfort driving sales of suvs, rise in demand for 4-wheel and all-wheel drive options for off-roading, and rising preference for suvs by upper-middle-class families.
| Market Scope | |
|---|---|
| Base Year | 2025 |
| End Year | 2029 |
| Series Year | 2025-2029 |
| Growth Momentum | Accelerate |
| YOY 2025 | 5% |
| CAGR | 5.4% |
| Incremental Value | $266.7 bn |
Technavio's suv market is segmented as below:
By Vehicle Type
- Medium-sized SUVs
- Crossover and compact SUVs
- Large-sized SUVs
By Fuel Type
- Gasoline
- Hybrid and electric SUV
- Diesel
By Geographical Landscape
- APAC
- Europe
- North America
- Middle East and Africa
- South America
This study identifies the rapid development of electric and hybrid suvs as one of the prime reasons driving the suv market growth during the next few years. Also, increased technological updates for luxury suvs and implementing subscription services for suvs by established automakers will lead to sizable demand in the market.
The report on the suv market covers the following areas:
- SUV Market sizing
- SUV Market forecast
- SUV Market industry analysis
The robust vendor analysis is designed to help clients improve their market position, and in line with this, this report provides a detailed analysis of several leading suv market vendors that include AB Volvo, Bayerische Motoren Werke AG, BYD Co. Ltd., China FAW Group Co. Ltd., Ford Motor Co., General Motors Co., Honda Motor Co. Ltd., Hyundai Motor Co., Mahindra and Mahindra Ltd., Mazda Motor Corp., Mercedes Benz Group AG, Mitsubishi Motors Corp., Nissan Motor Co. Ltd., Renault SAS, SAIC Motor Corp. Ltd., Stellantis NV, Tata Motors Ltd., Tesla Inc., Toyota Motor Corp., and Volkswagen AG. Also, the suv market analysis report includes information on upcoming trends and challenges that will influence market growth. This is to help companies strategize and leverage all forthcoming growth opportunities.
The study was conducted using an objective combination of primary and secondary information including inputs from key participants in the industry. The report contains a comprehensive market and vendor landscape in addition to an analysis of the key vendors.
The publisher presents a detailed picture of the market by the way of study, synthesis, and summation of data from multiple sources by an analysis of key parameters such as profit, pricing, competition, and promotions. It presents various market facets by identifying the key industry influencers. The data presented is comprehensive, reliable, and a result of extensive primary and secondary research. The market research reports provide a complete competitive landscape and an in-depth vendor selection methodology and analysis using qualitative and quantitative research to forecast accurate market growth.
Table of Contents
1 Executive Summary
- 1.1 Market overview
- Executive Summary - Chart on Market Overview
- Executive Summary - Data Table on Market Overview
- Executive Summary - Chart on Global Market Characteristics
- Executive Summary - Chart on Market By Geographical Landscape
- Executive Summary - Chart on Market Segmentation by Vehicle Type
- Executive Summary - Chart on Market Segmentation by Fuel Type
- Executive Summary - Chart on Incremental Growth
- Executive Summary - Data Table on Incremental Growth
- Executive Summary - Chart on Company Market Positioning
2 Technavio Analysis
- 2.1 Analysis of price sensitivity, lifecycle, customer purchase basket, adoption rates, and purchase criteria
- Analysis of price sensitivity, lifecycle, customer purchase basket, adoption rates, and purchase criteria
- 2.2 Criticality of inputs and Factors of differentiation
- Overview on criticality of inputs and factors of differentiation
- 2.3 Factors of disruption
- Overview on factors of disruption
- 2.4 Impact of drivers and challenges
- Impact of drivers and challenges in 2024 and 2029
3 Market Landscape
- 3.1 Market ecosystem
- Parent Market
- Data Table on - Parent Market
- 3.2 Market characteristics
- Market characteristics analysis
- 3.3 Value chain analysis
- Value chain analysis
4 Market Sizing
- 4.1 Market definition
- Offerings of companies included in the market definition
- 4.2 Market segment analysis
- Market segments
- 4.3 Market size 2024
- 4.4 Market outlook: Forecast for 2024-2029
- Chart on Global - Market size and forecast 2024-2029 ($ billion)
- Data Table on Global - Market size and forecast 2024-2029 ($ billion)
- Chart on Global Market: Year-over-year growth 2024-2029 (%)
- Data Table on Global Market: Year-over-year growth 2024-2029 (%)
5 Historic Market Size
- 5.1 Global SUV Market 2019 - 2023
- Historic Market Size - Data Table on Global SUV Market 2019 - 2023 ($ billion)
- 5.2 Vehicle Type segment analysis 2019 - 2023
- Historic Market Size - Vehicle Type Segment 2019 - 2023 ($ billion)
- 5.3 Fuel Type segment analysis 2019 - 2023
- Historic Market Size - Fuel Type Segment 2019 - 2023 ($ billion)
- 5.4 Geography segment analysis 2019 - 2023
- Historic Market Size - Geography Segment 2019 - 2023 ($ billion)
- 5.5 Country segment analysis 2019 - 2023
- Historic Market Size - Country Segment 2019 - 2023 ($ billion)
6 Qualitative Analysis
- 6.1 Impact of AI in global SUV market
7 Five Forces Analysis
- 7.1 Five forces summary
- Five forces analysis - Comparison between 2024 and 2029
- 7.2 Bargaining power of buyers
- Bargaining power of buyers - Impact of key factors 2024 and 2029
- 7.3 Bargaining power of suppliers
- Bargaining power of suppliers - Impact of key factors in 2024 and 2029
- 7.4 Threat of new entrants
- Threat of new entrants - Impact of key factors in 2024 and 2029
- 7.5 Threat of substitutes
- Threat of substitutes - Impact of key factors in 2024 and 2029
- 7.6 Threat of rivalry
- Threat of rivalry - Impact of key factors in 2024 and 2029
- 7.7 Market condition
- Chart on Market condition - Five forces 2024 and 2029
8 Market Segmentation by Vehicle Type
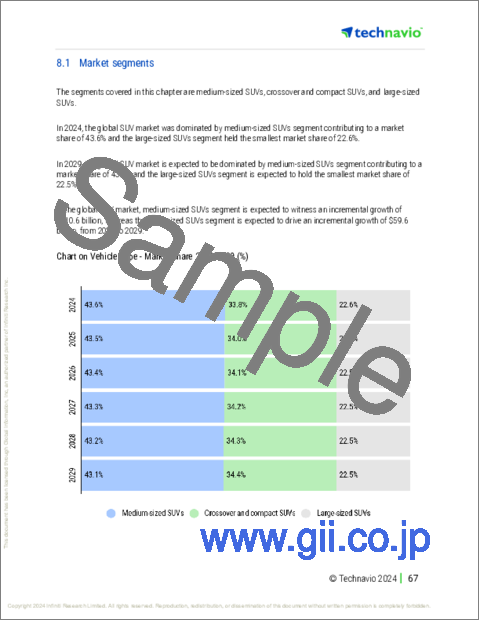
- 8.1 Market segments
- Chart on Vehicle Type - Market share 2024-2029 (%)
- Data Table on Vehicle Type - Market share 2024-2029 (%)
- 8.2 Comparison by Vehicle Type
- Chart on Comparison by Vehicle Type
- Data Table on Comparison by Vehicle Type
- 8.3 Medium-sized SUVs - Market size and forecast 2024-2029
- Chart on Medium-sized SUVs - Market size and forecast 2024-2029 ($ billion)
- Data Table on Medium-sized SUVs - Market size and forecast 2024-2029 ($ billion)
- Chart on Medium-sized SUVs - Year-over-year growth 2024-2029 (%)
- Data Table on Medium-sized SUVs - Year-over-year growth 2024-2029 (%)
- 8.4 Crossover and compact SUVs - Market size and forecast 2024-2029
- Chart on Crossover and compact SUVs - Market size and forecast 2024-2029 ($ billion)
- Data Table on Crossover and compact SUVs - Market size and forecast 2024-2029 ($ billion)
- Chart on Crossover and compact SUVs - Year-over-year growth 2024-2029 (%)
- Data Table on Crossover and compact SUVs - Year-over-year growth 2024-2029 (%)
- 8.5 Large-sized SUVs - Market size and forecast 2024-2029
- Chart on Large-sized SUVs - Market size and forecast 2024-2029 ($ billion)
- Data Table on Large-sized SUVs - Market size and forecast 2024-2029 ($ billion)
- Chart on Large-sized SUVs - Year-over-year growth 2024-2029 (%)
- Data Table on Large-sized SUVs - Year-over-year growth 2024-2029 (%)
- 8.6 Market opportunity by Vehicle Type
- Market opportunity by Vehicle Type ($ billion)
- Data Table on Market opportunity by Vehicle Type ($ billion)
9 Market Segmentation by Fuel Type
- 9.1 Market segments
- Chart on Fuel Type - Market share 2024-2029 (%)
- Data Table on Fuel Type - Market share 2024-2029 (%)
- 9.2 Comparison by Fuel Type
- Chart on Comparison by Fuel Type
- Data Table on Comparison by Fuel Type
- 9.3 Gasoline - Market size and forecast 2024-2029
- Chart on Gasoline - Market size and forecast 2024-2029 ($ billion)
- Data Table on Gasoline - Market size and forecast 2024-2029 ($ billion)
- Chart on Gasoline - Year-over-year growth 2024-2029 (%)
- Data Table on Gasoline - Year-over-year growth 2024-2029 (%)
- 9.4 Hybrid and electric SUV - Market size and forecast 2024-2029
- Chart on Hybrid and electric SUV - Market size and forecast 2024-2029 ($ billion)
- Data Table on Hybrid and electric SUV - Market size and forecast 2024-2029 ($ billion)
- Chart on Hybrid and electric SUV - Year-over-year growth 2024-2029 (%)
- Data Table on Hybrid and electric SUV - Year-over-year growth 2024-2029 (%)
- 9.5 Diesel - Market size and forecast 2024-2029
- Chart on Diesel - Market size and forecast 2024-2029 ($ billion)
- Data Table on Diesel - Market size and forecast 2024-2029 ($ billion)
- Chart on Diesel - Year-over-year growth 2024-2029 (%)
- Data Table on Diesel - Year-over-year growth 2024-2029 (%)
- 9.6 Market opportunity by Fuel Type
- Market opportunity by Fuel Type ($ billion)
- Data Table on Market opportunity by Fuel Type ($ billion)
10 Customer Landscape
- 10.1 Customer landscape overview
- Analysis of price sensitivity, lifecycle, customer purchase basket, adoption rates, and purchase criteria
11 Geographic Landscape
- 11.1 Geographic segmentation
- Chart on Market share By Geographical Landscape 2024-2029 (%)
- Data Table on Market share By Geographical Landscape 2024-2029 (%)
- 11.2 Geographic comparison
- Chart on Geographic comparison
- Data Table on Geographic comparison
- 11.3 APAC - Market size and forecast 2024-2029
- Chart on APAC - Market size and forecast 2024-2029 ($ billion)
- Data Table on APAC - Market size and forecast 2024-2029 ($ billion)
- Chart on APAC - Year-over-year growth 2024-2029 (%)
- Data Table on APAC - Year-over-year growth 2024-2029 (%)
- 11.4 Europe - Market size and forecast 2024-2029
- Chart on Europe - Market size and forecast 2024-2029 ($ billion)
- Data Table on Europe - Market size and forecast 2024-2029 ($ billion)
- Chart on Europe - Year-over-year growth 2024-2029 (%)
- Data Table on Europe - Year-over-year growth 2024-2029 (%)
- 11.5 North America - Market size and forecast 2024-2029
- Chart on North America - Market size and forecast 2024-2029 ($ billion)
- Data Table on North America - Market size and forecast 2024-2029 ($ billion)
- Chart on North America - Year-over-year growth 2024-2029 (%)
- Data Table on North America - Year-over-year growth 2024-2029 (%)
- 11.6 Middle East and Africa - Market size and forecast 2024-2029
- Chart on Middle East and Africa - Market size and forecast 2024-2029 ($ billion)
- Data Table on Middle East and Africa - Market size and forecast 2024-2029 ($ billion)
- Chart on Middle East and Africa - Year-over-year growth 2024-2029 (%)
- Data Table on Middle East and Africa - Year-over-year growth 2024-2029 (%)
- 11.7 South America - Market size and forecast 2024-2029
- Chart on South America - Market size and forecast 2024-2029 ($ billion)
- Data Table on South America - Market size and forecast 2024-2029 ($ billion)
- Chart on South America - Year-over-year growth 2024-2029 (%)
- Data Table on South America - Year-over-year growth 2024-2029 (%)
- 11.8 China - Market size and forecast 2024-2029
- Chart on China - Market size and forecast 2024-2029 ($ billion)
- Data Table on China - Market size and forecast 2024-2029 ($ billion)
- Chart on China - Year-over-year growth 2024-2029 (%)
- Data Table on China - Year-over-year growth 2024-2029 (%)
- 11.9 India - Market size and forecast 2024-2029
- Chart on India - Market size and forecast 2024-2029 ($ billion)
- Data Table on India - Market size and forecast 2024-2029 ($ billion)
- Chart on India - Year-over-year growth 2024-2029 (%)
- Data Table on India - Year-over-year growth 2024-2029 (%)
- 11.10 Japan - Market size and forecast 2024-2029
- Chart on Japan - Market size and forecast 2024-2029 ($ billion)
- Data Table on Japan - Market size and forecast 2024-2029 ($ billion)
- Chart on Japan - Year-over-year growth 2024-2029 (%)
- Data Table on Japan - Year-over-year growth 2024-2029 (%)
- 11.11 US - Market size and forecast 2024-2029
- Chart on US - Market size and forecast 2024-2029 ($ billion)
- Data Table on US - Market size and forecast 2024-2029 ($ billion)
- Chart on US - Year-over-year growth 2024-2029 (%)
- Data Table on US - Year-over-year growth 2024-2029 (%)
- 11.12 Germany - Market size and forecast 2024-2029
- Chart on Germany - Market size and forecast 2024-2029 ($ billion)
- Data Table on Germany - Market size and forecast 2024-2029 ($ billion)
- Chart on Germany - Year-over-year growth 2024-2029 (%)
- Data Table on Germany - Year-over-year growth 2024-2029 (%)
- 11.13 UK - Market size and forecast 2024-2029
- Chart on UK - Market size and forecast 2024-2029 ($ billion)
- Data Table on UK - Market size and forecast 2024-2029 ($ billion)
- Chart on UK - Year-over-year growth 2024-2029 (%)
- Data Table on UK - Year-over-year growth 2024-2029 (%)
- 11.14 Canada - Market size and forecast 2024-2029
- Chart on Canada - Market size and forecast 2024-2029 ($ billion)
- Data Table on Canada - Market size and forecast 2024-2029 ($ billion)
- Chart on Canada - Year-over-year growth 2024-2029 (%)
- Data Table on Canada - Year-over-year growth 2024-2029 (%)
- 11.15 France - Market size and forecast 2024-2029
- Chart on France - Market size and forecast 2024-2029 ($ billion)
- Data Table on France - Market size and forecast 2024-2029 ($ billion)
- Chart on France - Year-over-year growth 2024-2029 (%)
- Data Table on France - Year-over-year growth 2024-2029 (%)
- 11.16 Australia - Market size and forecast 2024-2029
- Chart on Australia - Market size and forecast 2024-2029 ($ billion)
- Data Table on Australia - Market size and forecast 2024-2029 ($ billion)
- Chart on Australia - Year-over-year growth 2024-2029 (%)
- Data Table on Australia - Year-over-year growth 2024-2029 (%)
- 11.17 Brazil - Market size and forecast 2024-2029
- Chart on Brazil - Market size and forecast 2024-2029 ($ billion)
- Data Table on Brazil - Market size and forecast 2024-2029 ($ billion)
- Chart on Brazil - Year-over-year growth 2024-2029 (%)
- Data Table on Brazil - Year-over-year growth 2024-2029 (%)
- 11.18 Market opportunity By Geographical Landscape
- Market opportunity By Geographical Landscape ($ billion)
- Data Tables on Market opportunity By Geographical Landscape ($ billion)
12 Drivers, Challenges, and Opportunity/Restraints
- 12.1 Market drivers
- 12.2 Market challenges
- 12.3 Impact of drivers and challenges
- Impact of drivers and challenges in 2024 and 2029
- 12.4 Market opportunities/restraints
13 Competitive Landscape
- 13.1 Overview
- 13.2 Competitive Landscape
- Overview on criticality of inputs and factors of differentiation
- 13.3 Landscape disruption
- Overview on factors of disruption
- 13.4 Industry risks
- Impact of key risks on business
14 Competitive Analysis
- 14.1 Companies profiled
- Companies covered
- 14.2 Company ranking index
- Company ranking index
- 14.3 Market positioning of companies
- Matrix on companies position and classification
- 14.4 AB Volvo
- AB Volvo - Overview
- AB Volvo - Business segments
- AB Volvo - Key news
- AB Volvo - Key offerings
- AB Volvo - Segment focus
- SWOT
- 14.5 Bayerische Motoren Werke AG
- Bayerische Motoren Werke AG - Overview
- Bayerische Motoren Werke AG - Business segments
- Bayerische Motoren Werke AG - Key news
- Bayerische Motoren Werke AG - Key offerings
- Bayerische Motoren Werke AG - Segment focus
- SWOT
- 14.6 BYD Co. Ltd.
- ByD Co. Ltd. - Overview
- ByD Co. Ltd. - Business segments
- ByD Co. Ltd. - Key news
- ByD Co. Ltd. - Key offerings
- ByD Co. Ltd. - Segment focus
- SWOT
- 14.7 Ford Motor Co.
- Ford Motor Co. - Overview
- Ford Motor Co. - Business segments
- Ford Motor Co. - Key offerings
- Ford Motor Co. - Segment focus
- SWOT
- 14.8 General Motors Co.
- General Motors Co. - Overview
- General Motors Co. - Business segments
- General Motors Co. - Key news
- General Motors Co. - Key offerings
- General Motors Co. - Segment focus
- SWOT
- 14.9 Mazda Motor Corp.
- Mazda Motor Corp. - Overview
- Mazda Motor Corp. - Business segments
- Mazda Motor Corp. - Key offerings
- Mazda Motor Corp. - Segment focus
- SWOT
- 14.10 Mercedes Benz Group AG
- Mercedes Benz Group AG - Overview
- Mercedes Benz Group AG - Product / Service
- Mercedes Benz Group AG - Key offerings
- SWOT
- 14.11 Mitsubishi Motors Corp.
- Mitsubishi Motors Corp. - Overview
- Mitsubishi Motors Corp. - Business segments
- Mitsubishi Motors Corp. - Key news
- Mitsubishi Motors Corp. - Key offerings
- Mitsubishi Motors Corp. - Segment focus
- SWOT
- 14.12 Nissan Motor Co. Ltd.
- Nissan Motor Co. Ltd. - Overview
- Nissan Motor Co. Ltd. - Business segments
- Nissan Motor Co. Ltd. - Key news
- Nissan Motor Co. Ltd. - Key offerings
- Nissan Motor Co. Ltd. - Segment focus
- SWOT
- 14.13 Renault SAS
- Renault SAS - Overview
- Renault SAS - Product / Service
- Renault SAS - Key news
- Renault SAS - Key offerings
- SWOT
- 14.14 Stellantis NV
- Stellantis NV - Overview
- Stellantis NV - Business segments
- Stellantis NV - Key news
- Stellantis NV - Key offerings
- Stellantis NV - Segment focus
- SWOT
- 14.15 Tata Motors Ltd.
- Tata Motors Ltd. - Overview
- Tata Motors Ltd. - Business segments
- Tata Motors Ltd. - Key news
- Tata Motors Ltd. - Key offerings
- Tata Motors Ltd. - Segment focus
- SWOT
- 14.16 Tesla Inc.
- Tesla Inc. - Overview
- Tesla Inc. - Business segments
- Tesla Inc. - Key news
- Tesla Inc. - Key offerings
- Tesla Inc. - Segment focus
- SWOT
- 14.17 Toyota Motor Corp.
- Toyota Motor Corp. - Overview
- Toyota Motor Corp. - Business segments
- Toyota Motor Corp. - Key news
- Toyota Motor Corp. - Key offerings
- Toyota Motor Corp. - Segment focus
- SWOT
- 14.18 Volkswagen AG
- Volkswagen AG - Overview
- Volkswagen AG - Business segments
- Volkswagen AG - Key news
- Volkswagen AG - Key offerings
- Volkswagen AG - Segment focus
- SWOT
15 Appendix
- 15.1 Scope of the report
- 15.2 Inclusions and exclusions checklist
- Inclusions checklist
- Exclusions checklist
- 15.3 Currency conversion rates for US$
- Currency conversion rates for US$
- 15.4 Research methodology
- Research methodology
- 15.5 Data procurement
- Information sources
- 15.6 Data validation
- Data validation
- 15.7 Validation techniques employed for market sizing
- Validation techniques employed for market sizing
- 15.8 Data synthesis
- Data synthesis
- 15.9 360 degree market analysis
- 360 degree market analysis
- 15.10 List of abbreviations
- List of abbreviations

