|
|
市場調査レポート
商品コード
1450088
半導体ウエハー研磨・研削装置の世界市場 2024-2028Global Semiconductor Wafer Polishing and Grinding Equipment Market 2024-2028 |
||||||

|
|||||||
カスタマイズ可能
|
|||||||

| 半導体ウエハー研磨・研削装置の世界市場 2024-2028 |
|
出版日: 2024年02月28日
発行: TechNavio
ページ情報: 英文 172 Pages
納期: 即納可能
|

全表示
- 概要
- 図表
- 目次
半導体ウエハー研磨・研削装置市場は2023-2028年に4億4,201万米ドル、予測期間中のCAGRは4.06%で成長すると予測されます。
当レポートでは、半導体ウエハー研磨・研削装置市場の全体的な分析、市場規模・予測、動向、成長促進要因、課題、約25のベンダーを網羅したベンダー分析などを掲載しています。
現在の市場シナリオ、最新動向と促進要因、市場環境全体に関する最新分析を提供しています。市場は、半導体部品の小型化、新規製造工場への投資拡大、エンドユーザーの長期顧客に対する優遇措置や割引などが牽引しています。
| 市場範囲 | |
|---|---|
| 基準年 | 2024 |
| 終了年 | 2028 |
| 予測期間 | 2024-2028 |
| 成長モメンタム | 加速 |
| 前年比2024年 | 3.94% |
| CAGR | 4.06% |
| 増分額 | 4億4,201万米ドル |
本調査では、今後数年間の半導体ウエハー研磨・研削装置市場成長を牽引する主な要因の1つとしてNEMS利用の増加を挙げています。また、ULSIの成長と3D構造への移行が市場の大きな需要につながります。
目次
第1章 エグゼクティブサマリー
- 市場概要
第2章 市場情勢
- 市場エコシステム
第3章 市場規模
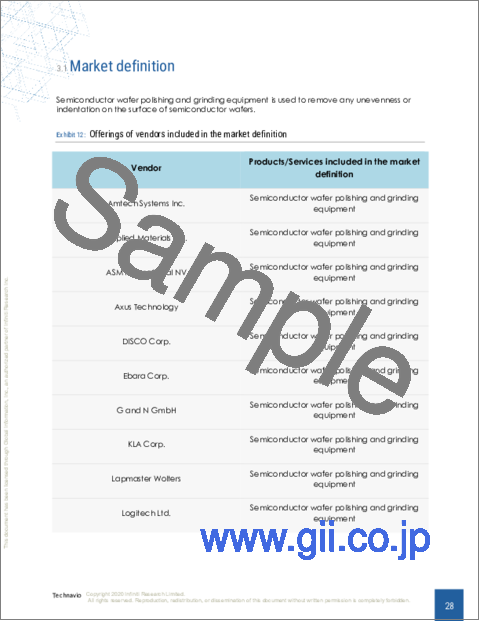
- 市場の定義
- 市場セグメント分析
- 市場規模 2023
- 市場の見通し 2023-2028
第4章 市場規模実績
- 半導体ウエハー研磨・研削装置の世界市場 2018-2022
- 用途別セグメント分析 2018-2022
- エンドユーザーセグメント分析 2018-2022
- 地域別セグメント分析 2018-2022
- 国別セグメント分析 2018-2022
第5章 ファイブフォース分析
- ファイブフォースの要約
- 買い手の交渉力
- 供給企業の交渉力
- 新規参入業者の脅威
- 代替品の脅威
- 競争の脅威
- 市況
第6章 市場セグメンテーション:用途別
- 市場セグメント
- 比較:用途別
- 300mm:市場規模と予測 2023-2028
- 200mm:市場規模と予測 2023-2028
- 200mm未満:市場規模と予測 2023-2028
- 市場機会:用途別
第7章 市場セグメンテーション:エンドユーザー別
- 市場セグメント
- 比較:エンドユーザー別
- 半導体製造工場:市場規模と予測 2023-2028
- IDM:市場規模と予測 2023-2028
- メモリメーカー:市場規模と予測 2023-2028
- 市場機会:エンドユーザー別
第8章 顧客情勢
- 顧客情勢の概要
第9章 地域別情勢
- 地域別セグメンテーション
- 地域別比較
- アジア太平洋:市場規模と予測 2023-2028
- 北米:市場規模と予測 2023-2028
- 欧州:市場規模と予測 2023-2028
- 南米:市場規模と予測 2023-2028
- 中東・アフリカ:市場規模と予測 2023-2028
- 韓国:市場規模と予測 2023-2028
- 台湾:市場規模と予測 2023-2028
- 中国:市場規模と予測 2023-2028
- 日本:市場規模と予測 2023-2028
- 米国:市場規模と予測 2023-2028
- 市場機会:地域情勢別
第10章 促進要因、課題、および動向
- 市場促進要因
- 市場の課題
- 促進要因と課題の影響
- 市場動向
第11章 ベンダー情勢
- 概要
- ベンダー情勢
- 混乱の状況
- 業界のリスク
第12章 ベンダー分析
- 対象ベンダー
- ベンダーの市場ポジショニング
- Amtech Systems Inc.
- Applied Materials Inc.
- ASM International NV
- Axus Technology
- DISCO Corp.
- Ebara Corp.
- G and N GmbH
- KLA Corp.
- Lapmaster Wolters
- Logitech Ltd.
- Okamoto Corp
- Revasum Inc.
- S3 Alliance.
- Tokyo Electron Ltd.
- TOKYO SEIMITSU CO. LTD
第13章 付録
Exhibits:
- Exhibits1: Executive Summary - Chart on Market Overview
- Exhibits2: Executive Summary - Data Table on Market Overview
- Exhibits3: Executive Summary - Chart on Global Market Characteristics
- Exhibits4: Executive Summary - Chart on Market By Geographical Landscape
- Exhibits5: Executive Summary - Chart on Market Segmentation by Application
- Exhibits6: Executive Summary - Chart on Market Segmentation by End-user
- Exhibits7: Executive Summary - Chart on Incremental Growth
- Exhibits8: Executive Summary - Data Table on Incremental Growth
- Exhibits9: Executive Summary - Chart on Vendor Market Positioning
- Exhibits10: Parent market
- Exhibits11: Market Characteristics
- Exhibits12: Offerings of vendors included in the market definition
- Exhibits13: Market segments
- Exhibits14: Chart on Global - Market size and forecast 2023-2028 ($ million)
- Exhibits15: Data Table on Global - Market size and forecast 2023-2028 ($ million)
- Exhibits16: Chart on Global Market: Year-over-year growth 2023-2028 (%)
- Exhibits17: Data Table on Global Market: Year-over-year growth 2023-2028 (%)
- Exhibits18: Historic Market Size - Data Table on global semiconductor wafer polishing and grinding equipment market 2018 - 2022 ($ million)
- Exhibits19: Historic Market Size - Application Segment 2018 - 2022 ($ million)
- Exhibits20: Historic Market Size - End-User Segment 2018 - 2022 ($ million)
- Exhibits21: Historic Market Size - Geography Segment 2018 - 2022 ($ million)
- Exhibits22: Historic Market Size - Country Segment 2018 - 2022 ($ million)
- Exhibits23: Five forces analysis - Comparison between 2023 and 2028
- Exhibits24: Chart on Bargaining power of buyers - Impact of key factors 2023 and 2028
- Exhibits25: Bargaining power of suppliers - Impact of key factors in 2023 and 2028
- Exhibits26: Threat of new entrants - Impact of key factors in 2023 and 2028
- Exhibits27: Threat of substitutes - Impact of key factors in 2023 and 2028
- Exhibits28: Threat of rivalry - Impact of key factors in 2023 and 2028
- Exhibits29: Chart on Market condition - Five forces 2023 and 2028
- Exhibits30: Chart on Application - Market share 2023-2028 (%)
- Exhibits31: Data Table on Application - Market share 2023-2028 (%)
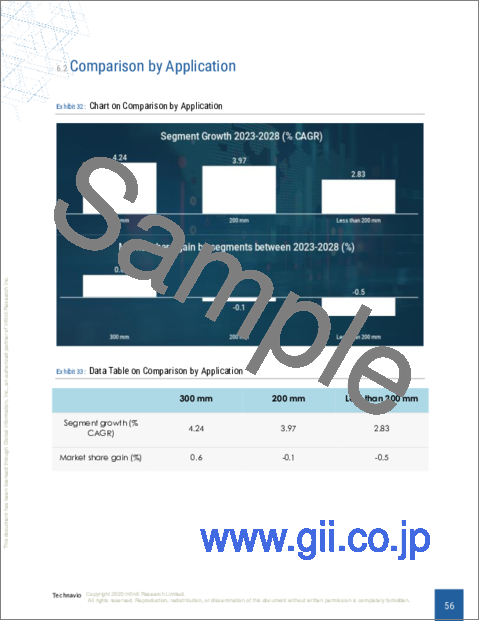
- Exhibits32: Chart on Comparison by Application
- Exhibits33: Data Table on Comparison by Application
- Exhibits34: Chart on 300 mm - Market size and forecast 2023-2028 ($ million)
- Exhibits35: Data Table on 300 mm - Market size and forecast 2023-2028 ($ million)
- Exhibits36: Chart on 300 mm - Year-over-year growth 2023-2028 (%)
- Exhibits37: Data Table on 300 mm - Year-over-year growth 2023-2028 (%)
- Exhibits38: Chart on 200 mm - Market size and forecast 2023-2028 ($ million)
- Exhibits39: Data Table on 200 mm - Market size and forecast 2023-2028 ($ million)
- Exhibits40: Chart on 200 mm - Year-over-year growth 2023-2028 (%)
- Exhibits41: Data Table on 200 mm - Year-over-year growth 2023-2028 (%)
- Exhibits42: Chart on Less than 200 mm - Market size and forecast 2023-2028 ($ million)
- Exhibits43: Data Table on Less than 200 mm - Market size and forecast 2023-2028 ($ million)
- Exhibits44: Chart on Less than 200 mm - Year-over-year growth 2023-2028 (%)
- Exhibits45: Data Table on Less than 200 mm - Year-over-year growth 2023-2028 (%)
- Exhibits46: Market opportunity by Application ($ million)
- Exhibits47: Data Table on Market opportunity by Application ($ million)
- Exhibits48: Chart on End-user - Market share 2023-2028 (%)
- Exhibits49: Data Table on End-user - Market share 2023-2028 (%)
- Exhibits50: Chart on Comparison by End-user
- Exhibits51: Data Table on Comparison by End-user
- Exhibits52: Chart on Foundries - Market size and forecast 2023-2028 ($ million)
- Exhibits53: Data Table on Foundries - Market size and forecast 2023-2028 ($ million)
- Exhibits54: Chart on Foundries - Year-over-year growth 2023-2028 (%)
- Exhibits55: Data Table on Foundries - Year-over-year growth 2023-2028 (%)
- Exhibits56: Chart on IDM - Market size and forecast 2023-2028 ($ million)
- Exhibits57: Data Table on IDM - Market size and forecast 2023-2028 ($ million)
- Exhibits58: Chart on IDM - Year-over-year growth 2023-2028 (%)
- Exhibits59: Data Table on IDM - Year-over-year growth 2023-2028 (%)
- Exhibits60: Chart on Memory manufacturers - Market size and forecast 2023-2028 ($ million)
- Exhibits61: Data Table on Memory manufacturers - Market size and forecast 2023-2028 ($ million)
- Exhibits62: Chart on Memory manufacturers - Year-over-year growth 2023-2028 (%)
- Exhibits63: Data Table on Memory manufacturers - Year-over-year growth 2023-2028 (%)
- Exhibits64: Market opportunity by End-user ($ million)
- Exhibits65: Data Table on Market opportunity by End-user ($ million)
- Exhibits66: Analysis of price sensitivity, lifecycle, customer purchase basket, adoption rates, and purchase criteria
- Exhibits67: Chart on Market share By Geographical Landscape 2023-2028 (%)
- Exhibits68: Data Table on Market share By Geographical Landscape 2023-2028 (%)
- Exhibits69: Chart on Geographic comparison
- Exhibits70: Data Table on Geographic comparison
- Exhibits71: Chart on APAC - Market size and forecast 2023-2028 ($ million)
- Exhibits72: Data Table on APAC - Market size and forecast 2023-2028 ($ million)
- Exhibits73: Chart on APAC - Year-over-year growth 2023-2028 (%)
- Exhibits74: Data Table on APAC - Year-over-year growth 2023-2028 (%)
- Exhibits75: Chart on North America - Market size and forecast 2023-2028 ($ million)
- Exhibits76: Data Table on North America - Market size and forecast 2023-2028 ($ million)
- Exhibits77: Chart on North America - Year-over-year growth 2023-2028 (%)
- Exhibits78: Data Table on North America - Year-over-year growth 2023-2028 (%)
- Exhibits79: Chart on Europe - Market size and forecast 2023-2028 ($ million)
- Exhibits80: Data Table on Europe - Market size and forecast 2023-2028 ($ million)
- Exhibits81: Chart on Europe - Year-over-year growth 2023-2028 (%)
- Exhibits82: Data Table on Europe - Year-over-year growth 2023-2028 (%)
- Exhibits83: Chart on South America - Market size and forecast 2023-2028 ($ million)
- Exhibits84: Data Table on South America - Market size and forecast 2023-2028 ($ million)
- Exhibits85: Chart on South America - Year-over-year growth 2023-2028 (%)
- Exhibits86: Data Table on South America - Year-over-year growth 2023-2028 (%)
- Exhibits87: Chart on Middle East and Africa - Market size and forecast 2023-2028 ($ million)
- Exhibits88: Data Table on Middle East and Africa - Market size and forecast 2023-2028 ($ million)
- Exhibits89: Chart on Middle East and Africa - Year-over-year growth 2023-2028 (%)
- Exhibits90: Data Table on Middle East and Africa - Year-over-year growth 2023-2028 (%)
- Exhibits91: Chart on South Korea - Market size and forecast 2023-2028 ($ million)
- Exhibits92: Data Table on South Korea - Market size and forecast 2023-2028 ($ million)
- Exhibits93: Chart on South Korea - Year-over-year growth 2023-2028 (%)
- Exhibits94: Data Table on South Korea - Year-over-year growth 2023-2028 (%)
- Exhibits95: Chart on Taiwan - Market size and forecast 2023-2028 ($ million)
- Exhibits96: Data Table on Taiwan - Market size and forecast 2023-2028 ($ million)
- Exhibits97: Chart on Taiwan - Year-over-year growth 2023-2028 (%)
- Exhibits98: Data Table on Taiwan - Year-over-year growth 2023-2028 (%)
- Exhibits99: Chart on China - Market size and forecast 2023-2028 ($ million)
- Exhibits100: Data Table on China - Market size and forecast 2023-2028 ($ million)
- Exhibits101: Chart on China - Year-over-year growth 2023-2028 (%)
- Exhibits102: Data Table on China - Year-over-year growth 2023-2028 (%)
- Exhibits103: Chart on Japan - Market size and forecast 2023-2028 ($ million)
- Exhibits104: Data Table on Japan - Market size and forecast 2023-2028 ($ million)
- Exhibits105: Chart on Japan - Year-over-year growth 2023-2028 (%)
- Exhibits106: Data Table on Japan - Year-over-year growth 2023-2028 (%)
- Exhibits107: Chart on US - Market size and forecast 2023-2028 ($ million)
- Exhibits108: Data Table on US - Market size and forecast 2023-2028 ($ million)
- Exhibits109: Chart on US - Year-over-year growth 2023-2028 (%)
- Exhibits110: Data Table on US - Year-over-year growth 2023-2028 (%)
- Exhibits111: Market opportunity By Geographical Landscape ($ million)
- Exhibits112: Data Tables on Market opportunity By Geographical Landscape ($ million)
- Exhibits113: Impact of drivers and challenges in 2023 and 2028
- Exhibits114: Overview on Criticality of inputs and Factors of differentiation
- Exhibits115: Overview on factors of disruption
- Exhibits116: Impact of key risks on business
- Exhibits117: Vendors covered
- Exhibits118: Matrix on vendor position and classification
- Exhibits119: Amtech Systems Inc. - Overview
- Exhibits120: Amtech Systems Inc. - Business segments
- Exhibits121: Amtech Systems Inc. - Key offerings
- Exhibits122: Amtech Systems Inc. - Segment focus
- Exhibits123: Applied Materials Inc. - Overview
- Exhibits124: Applied Materials Inc. - Business segments
- Exhibits125: Applied Materials Inc. - Key news
- Exhibits126: Applied Materials Inc. - Key offerings
- Exhibits127: Applied Materials Inc. - Segment focus
- Exhibits128: ASM International NV - Overview
- Exhibits129: ASM International NV - Product / Service
- Exhibits130: ASM International NV - Key offerings
- Exhibits131: Axus Technology - Overview
- Exhibits132: Axus Technology - Product / Service
- Exhibits133: Axus Technology - Key offerings
- Exhibits134: DISCO Corp. - Overview
- Exhibits135: DISCO Corp. - Business segments
- Exhibits136: DISCO Corp. - Key news
- Exhibits137: DISCO Corp. - Key offerings
- Exhibits138: DISCO Corp. - Segment focus
- Exhibits139: Ebara Corp. - Overview
- Exhibits140: Ebara Corp. - Business segments
- Exhibits141: Ebara Corp. - Key offerings
- Exhibits142: Ebara Corp. - Segment focus
- Exhibits143: G and N GmbH - Overview
- Exhibits144: G and N GmbH - Product / Service
- Exhibits145: G and N GmbH - Key offerings
- Exhibits146: KLA Corp. - Overview
- Exhibits147: KLA Corp. - Business segments
- Exhibits148: KLA Corp. - Key offerings
- Exhibits149: KLA Corp. - Segment focus
- Exhibits150: Lapmaster Wolters - Overview
- Exhibits151: Lapmaster Wolters - Product / Service
- Exhibits152: Lapmaster Wolters - Key offerings
- Exhibits153: Logitech Ltd. - Overview
- Exhibits154: Logitech Ltd. - Product / Service
- Exhibits155: Logitech Ltd. - Key offerings
- Exhibits156: Okamoto Corp - Overview
- Exhibits157: Okamoto Corp - Product / Service
- Exhibits158: Okamoto Corp - Key offerings
- Exhibits159: Revasum Inc. - Overview
- Exhibits160: Revasum Inc. - Product / Service
- Exhibits161: Revasum Inc. - Key offerings
- Exhibits162: S3 Alliance. - Overview
- Exhibits163: S3 Alliance. - Product / Service
- Exhibits164: S3 Alliance. - Key offerings
- Exhibits165: Tokyo Electron Ltd. - Overview
- Exhibits166: Tokyo Electron Ltd. - Business segments
- Exhibits167: Tokyo Electron Ltd. - Key offerings
- Exhibits168: Tokyo Electron Ltd. - Segment focus
- Exhibits169: TOKYO SEIMITSU CO. LTD - Overview
- Exhibits170: TOKYO SEIMITSU CO. LTD - Product / Service
- Exhibits171: TOKYO SEIMITSU CO. LTD - Key offerings
- Exhibits172: Inclusions checklist
- Exhibits173: Exclusions checklist
- Exhibits174: Currency conversion rates for US$
- Exhibits175: Research methodology
- Exhibits176: Validation techniques employed for market sizing
- Exhibits177: Information sources
- Exhibits178: List of abbreviations
The semiconductor wafer polishing and grinding equipment market is forecasted to grow by USD 442.01 mn during 2023-2028, accelerating at a CAGR of 4.06% during the forecast period. The report on the semiconductor wafer polishing and grinding equipment market provides a holistic analysis, market size and forecast, trends, growth drivers, and challenges, as well as vendor analysis covering around 25 vendors.
The report offers an up-to-date analysis regarding the current market scenario, the latest trends and drivers, and the overall market environment. The market is driven by emergence of miniaturized semiconductor components, growing investment in new fabrication plants, and incentives and discounts for long-term customers of end-users.
Technavio's semiconductor wafer polishing and grinding equipment market is segmented as below:
| Market Scope | |
|---|---|
| Base Year | 2024 |
| End Year | 2028 |
| Series Year | 2024-2028 |
| Growth Momentum | Accelerate |
| YOY 2024 | 3.94% |
| CAGR | 4.06% |
| Incremental Value | $442.01mn |
By Application
300 mm
200 mm
- Less than 200 mm
By End-user
- Foundries
- IDM
- Memory manufacturers
By Geographical Landscape
- APAC
- North America
- Europe
- South America
- Middle East and Africa
This study identifies the increasing use of NEMS as one of the prime reasons driving the semiconductor wafer polishing and grinding equipment market growth during the next few years. Also, growth of ULSI and transition toward 3D structures will lead to sizable demand in the market.
The report on the semiconductor wafer polishing and grinding equipment market covers the following areas:
- Semiconductor wafer polishing and grinding equipment market sizing
- Semiconductor wafer polishing and grinding equipment market forecast
- Semiconductor wafer polishing and grinding equipment market industry analysis
The robust vendor analysis is designed to help clients improve their market position, and in line with this, this report provides a detailed analysis of several leading semiconductor wafer polishing and grinding equipment market vendors that include ALLIED HIGH TECH PRODUCTS, INC, Amtech Systems Inc., Applied Materials Inc., ASM International NV, Axus Technology, DISCO Corp., G and N GmbH, Gigamat Technologies Inc, KLA Corp., Lapmaster Wolters, Logitech Ltd., Okamoto Corp, Revasum Inc., S Cubed, S3 Alliance., Tokyo Electron Ltd., TOKYO SEIMITSU CO. LTD, ULTRA TEC Manufacturing Inc., UNITED GRINDING North America, Inc., and Ebara Corp.. Also, the semiconductor wafer polishing and grinding equipment market analysis report includes information on upcoming trends and challenges that will influence market growth. This is to help companies strategize and leverage all forthcoming growth opportunities.
The study was conducted using an objective combination of primary and secondary information including inputs from key participants in the industry. The report contains a comprehensive market and vendor landscape in addition to an analysis of the key vendors.
The publisher presents a detailed picture of the market by the way of study, synthesis, and summation of data from multiple sources by an analysis of key parameters such as profit, pricing, competition, and promotions. It presents various market facets by identifying the key industry influencers. The data presented is comprehensive, reliable, and a result of extensive research - both primary and secondary. The market research reports provide a complete competitive landscape and an in-depth vendor selection methodology and analysis using qualitative and quantitative research to forecast the accurate market growth.
Table of Contents
1 Executive Summary
- 1.1 Market overview
2 Market Landscape
- 2.1 Market ecosystem
3 Market Sizing
- 3.1 Market definition
- 3.2 Market segment analysis
- 3.3 Market size 2023
- 3.4 Market outlook: Forecast for 2023-2028
4 Historic Market Size
- 4.1 Global semiconductor wafer polishing and grinding equipment market 2018 - 2022
- 4.2 Application Segment Analysis 2018 - 2022
- 4.3 End-User Segment Analysis 2018 - 2022
- 4.4 Geography Segment Analysis 2018 - 2022
- 4.5 Country Segment Analysis 2018 - 2022
5 Five Forces Analysis
- 5.1 Five forces summary
- 5.2 Bargaining power of buyers
- 5.3 Bargaining power of suppliers
- 5.4 Threat of new entrants
- 5.5 Threat of substitutes
- 5.6 Threat of rivalry
- 5.7 Market condition
6 Market Segmentation by Application
- 6.1 Market segments
- 6.2 Comparison by Application
- 6.3 300 mm - Market size and forecast 2023-2028
- 6.4 200 mm - Market size and forecast 2023-2028
- 6.5 Less than 200 mm - Market size and forecast 2023-2028
- 6.6 Market opportunity by Application
7 Market Segmentation by End-user
- 7.1 Market segments
- 7.2 Comparison by End-user
- 7.3 Foundries - Market size and forecast 2023-2028
- 7.4 IDM - Market size and forecast 2023-2028
- 7.5 Memory manufacturers - Market size and forecast 2023-2028
- 7.6 Market opportunity by End-user
8 Customer Landscape
- 8.1 Customer landscape overview
9 Geographic Landscape
- 9.1 Geographic segmentation
- 9.2 Geographic comparison
- 9.3 APAC - Market size and forecast 2023-2028
- 9.4 North America - Market size and forecast 2023-2028
- 9.5 Europe - Market size and forecast 2023-2028
- 9.6 South America - Market size and forecast 2023-2028
- 9.7 Middle East and Africa - Market size and forecast 2023-2028
- 9.8 South Korea - Market size and forecast 2023-2028
- 9.9 Taiwan - Market size and forecast 2023-2028
- 9.10 China - Market size and forecast 2023-2028
- 9.11 Japan - Market size and forecast 2023-2028
- 9.12 US - Market size and forecast 2023-2028
- 9.13 Market opportunity By Geographical Landscape
10 Drivers, Challenges, and Trends
- 10.1 Market drivers
- 10.2 Market challenges
- 10.3 Impact of drivers and challenges
- 10.4 Market trends
11 Vendor Landscape
- 11.1 Overview
- 11.2 Vendor landscape
- 11.3 Landscape disruption
- 11.4 Industry risks
12 Vendor Analysis
- 12.1 Vendors covered
- 12.2 Market positioning of vendors
- 12.3 Amtech Systems Inc.
- 12.4 Applied Materials Inc.
- 12.5 ASM International NV
- 12.6 Axus Technology
- 12.7 DISCO Corp.
- 12.8 Ebara Corp.
- 12.9 G and N GmbH
- 12.10 KLA Corp.
- 12.11 Lapmaster Wolters
- 12.12 Logitech Ltd.
- 12.13 Okamoto Corp
- 12.14 Revasum Inc.
- 12.15 S3 Alliance.
- 12.16 Tokyo Electron Ltd.
- 12.17 TOKYO SEIMITSU CO. LTD
13 Appendix
- 13.1 Scope of the report
- 13.2 Inclusions and exclusions checklist
- 13.3 Currency conversion rates for US$
- 13.4 Research methodology
- 13.5 List of abbreviations

