|
|
市場調査レポート
商品コード
1801555
マスタードソースの世界市場、2025年~2029年Global Mustard Sauces Market 2025-2029 |
||||||
|
|||||||
カスタマイズ可能
|
|||||||


| マスタードソースの世界市場、2025年~2029年 |
|
出版日: 2025年08月21日
発行: TechNavio
ページ情報: 英文 224 Pages
納期: 即納可能
|

全表示
- 概要
- 図表
- 目次
マスタードソース市場は2024年から2029年に14億9,080万米ドルとなり、予測期間中のCAGRは7.3%で成長すると予測されます。
当レポートでは、マスタードソース市場の全体的な分析、市場規模・予測、動向、成長促進要因、課題、約25のベンダーを網羅したベンダー分析などを掲載しています。
現在の市場シナリオ、最新動向と促進要因、市場環境全体に関する最新分析を提供しています。市場は、加工されたマスタードソースに対する消費者の認識の変化、ディップとしてのマスタードソースの使用の増加、マスタードソース市場における新製品の発売によって牽引されています。
| 市場範囲 | |
|---|---|
| 基準年 | 2025年 |
| 終了年 | 2029年 |
| 予測期間 | 2025年~2029年 |
| 成長モメンタム | 加速 |
| 前年比 | 6.7% |
| CAGR | 7.3% |
| 増分額 | 14億9,080万米ドル |
本調査は、業界の主要参加者からのインプットを含め、一次情報と二次情報を客観的に組み合わせて実施しました。本レポートには、主要企業の分析に加え、包括的な市場規模データ、地域分析によるセグメント、ベンダー情勢が含まれています。レポートには実績データと予測データがあります。
本調査では、マスタードソース市場におけるマーケティングおよび戦略的イニシアチブを、今後数年間のマスタードソース市場の成長を促進する主要な理由の一つとして特定しています。また、マスタードソース市場におけるパッケージングの革新、マスタードソースの認証と製品のトレーサビリティは、市場の大きな需要につながると考えられています。
目次
第1章 エグゼクティブサマリー
- 市場概要
第2章 Technavio分析
- 価格感度・ライフサイクル・顧客購入バスケット・採用率・購入基準の分析
- インプットの重要性と差別化の要因
- 混乱の要因
- 促進要因と課題の影響
第3章 市場情勢
- 市場エコシステム
- 市場の特徴
- バリューチェーン分析
第4章 市場規模
- 市場の定義
- 市場セグメント分析
- 市場規模、2024年
- 市場の見通し、2024年~2029年
第5章 市場規模実績
- マスタードソースの世界市場、2019年~2023年
- 流通チャネルセグメント分析、2019年~2023年
- 製品セグメント分析、2019年~2023年
- パッケージングセグメント分析、2019年~2023年
- 地域別セグメント分析、2019年~2023年
- 国別セグメント分析、2019年~2023年
第6章 定性分析
- AIの影響:マスタードソースの世界市場
第7章 ファイブフォース分析
- ファイブフォースの要約
- 買い手の交渉力
- 供給企業の交渉力
- 新規参入業者の脅威
- 代替品の脅威
- 競争の脅威
- 市況
第8章 市場セグメンテーション:流通チャネル別
- 市場セグメント
- 比較:流通チャネル別
- オフライン:市場規模と予測、2024年~2029年
- オンライン:市場規模と予測、2024年~2029年
- 市場機会:流通チャネル別
第9章 市場セグメンテーション:製品別
- 市場セグメント
- 比較:製品別
- イエローマスタードソース:市場規模と予測、2024年~2029年
- スパイシーブラウン・ディジョンマスタードソース:市場規模と予測、2024年~2029年
- ハニーマスタードソース:市場規模と予測、2024年~2029年
- その他:市場規模と予測、2024年~2029年
- 市場機会:製品別
第10章 市場セグメンテーション:パッケージング別
- 市場セグメント
- 比較:パッケージング別
- ボトル:市場規模と予測、2024年~2029年
- サシェ:市場規模と予測、2024年~2029年
- 瓶:市場規模と予測、2024年~2029年
- 市場機会:パッケージング別
第11章 顧客情勢
- 顧客情勢の概要
第12章 地域別情勢
- 地域別セグメンテーション
- 地域別比較
- 北米:市場規模と予測、2024年~2029年
- 欧州:市場規模と予測、2024年~2029年
- アジア太平洋:市場規模と予測、2024年~2029年
- 南米:市場規模と予測、2024年~2029年
- 中東・アフリカ:市場規模と予測、2024年~2029年
- 米国:市場規模と予測、2024年~2029年
- 英国:市場規模と予測、2024年~2029年
- カナダ:市場規模と予測、2024年~2029年
- 中国:市場規模と予測、2024年~2029年
- ドイツ:市場規模と予測、2024年~2029年
- インド:市場規模と予測、2024年~2029年
- 日本:市場規模と予測、2024年~2029年
- フランス:市場規模と予測、2024年~2029年
- イタリア:市場規模と予測、2024年~2029年
- スペイン:市場規模と予測、2024年~2029年
- 市場機会:地域情勢別
第13章 促進要因・課題・機会・抑制要因
- 市場促進要因
- 市場の課題
- 促進要因と課題の影響
- 市場の機会・抑制要因
第14章 競合情勢
- 概要
- 競合情勢
- 混乱の状況
- 業界のリスク
第15章 競合分析
- 企業プロファイル
- 企業ランキング指数
- 企業の市場ポジショニング
- Conagra Brands Inc.
- Cremica Food Industries Ltd.
- Efoods Zimbabwe
- Fruitomans
- Golden State Foods LLC
- HACO AG
- Huntsinger Farms
- Marina Foods Inc.
- McCormick and Co. Inc.
- Northwest Gourmet Foods Products Inc.
- Orkla ASA
- STM Foods Pvt. Ltd.
- The Kraft Heinz Co.
- Unilever PLC
- VRB CONSUMER PRODUCTS Pvt. Ltd.
第16章 付録
Exhibits:
- Exhibits1: Executive Summary - Chart on Market Overview
- Exhibits2: Executive Summary - Data Table on Market Overview
- Exhibits3: Executive Summary - Chart on Global Market Characteristics
- Exhibits4: Executive Summary - Chart on Market By Geographical Landscape
- Exhibits5: Executive Summary - Chart on Market Segmentation by Distribution Channel
- Exhibits6: Executive Summary - Chart on Market Segmentation by Product
- Exhibits7: Executive Summary - Chart on Market Segmentation by Packaging
- Exhibits8: Executive Summary - Chart on Incremental Growth
- Exhibits9: Executive Summary - Data Table on Incremental Growth
- Exhibits10: Executive Summary - Chart on Company Market Positioning
- Exhibits11: Analysis of price sensitivity, lifecycle, customer purchase basket, adoption rates, and purchase criteria
- Exhibits12: Overview on criticality of inputs and factors of differentiation
- Exhibits13: Overview on factors of disruption
- Exhibits14: Impact of drivers and challenges in 2024 and 2029
- Exhibits15: Parent Market
- Exhibits16: Data Table on - Parent Market
- Exhibits17: Market characteristics analysis
- Exhibits18: Value chain analysis
- Exhibits19: Offerings of companies included in the market definition
- Exhibits20: Market segments
- Exhibits21: Chart on Global - Market size and forecast 2024-2029 ($ million)
- Exhibits22: Data Table on Global - Market size and forecast 2024-2029 ($ million)
- Exhibits23: Chart on Global Market: Year-over-year growth 2024-2029 (%)
- Exhibits24: Data Table on Global Market: Year-over-year growth 2024-2029 (%)
- Exhibits25: Historic Market Size - Data Table on Global Mustard Sauces Market 2019 - 2023 ($ million)
- Exhibits26: Historic Market Size - Distribution Channel Segment 2019 - 2023 ($ million)
- Exhibits27: Historic Market Size - Product Segment 2019 - 2023 ($ million)
- Exhibits28: Historic Market Size - Packaging Segment 2019 - 2023 ($ million)
- Exhibits29: Historic Market Size - Geography Segment 2019 - 2023 ($ million)
- Exhibits30: Historic Market Size - Country Segment 2019 - 2023 ($ million)
- Exhibits31: Five forces analysis - Comparison between 2024 and 2029
- Exhibits32: Bargaining power of buyers - Impact of key factors 2024 and 2029
- Exhibits33: Bargaining power of suppliers - Impact of key factors in 2024 and 2029
- Exhibits34: Threat of new entrants - Impact of key factors in 2024 and 2029
- Exhibits35: Threat of substitutes - Impact of key factors in 2024 and 2029
- Exhibits36: Threat of rivalry - Impact of key factors in 2024 and 2029
- Exhibits37: Chart on Market condition - Five forces 2024 and 2029
- Exhibits38: Chart on Distribution Channel - Market share 2024-2029 (%)
- Exhibits39: Data Table on Distribution Channel - Market share 2024-2029 (%)
- Exhibits40: Chart on Comparison by Distribution Channel
- Exhibits41: Data Table on Comparison by Distribution Channel
- Exhibits42: Chart on Offline - Market size and forecast 2024-2029 ($ million)
- Exhibits43: Data Table on Offline - Market size and forecast 2024-2029 ($ million)
- Exhibits44: Chart on Offline - Year-over-year growth 2024-2029 (%)
- Exhibits45: Data Table on Offline - Year-over-year growth 2024-2029 (%)
- Exhibits46: Chart on Online - Market size and forecast 2024-2029 ($ million)
- Exhibits47: Data Table on Online - Market size and forecast 2024-2029 ($ million)
- Exhibits48: Chart on Online - Year-over-year growth 2024-2029 (%)
- Exhibits49: Data Table on Online - Year-over-year growth 2024-2029 (%)
- Exhibits50: Market opportunity by Distribution Channel ($ million)
- Exhibits51: Data Table on Market opportunity by Distribution Channel ($ million)
- Exhibits52: Chart on Product - Market share 2024-2029 (%)
- Exhibits53: Data Table on Product - Market share 2024-2029 (%)
- Exhibits54: Chart on Comparison by Product
- Exhibits55: Data Table on Comparison by Product
- Exhibits56: Chart on Yellow mustard sauces - Market size and forecast 2024-2029 ($ million)
- Exhibits57: Data Table on Yellow mustard sauces - Market size and forecast 2024-2029 ($ million)
- Exhibits58: Chart on Yellow mustard sauces - Year-over-year growth 2024-2029 (%)
- Exhibits59: Data Table on Yellow mustard sauces - Year-over-year growth 2024-2029 (%)
- Exhibits60: Chart on Spicy brown and dijon mustard sauces - Market size and forecast 2024-2029 ($ million)
- Exhibits61: Data Table on Spicy brown and dijon mustard sauces - Market size and forecast 2024-2029 ($ million)
- Exhibits62: Chart on Spicy brown and dijon mustard sauces - Year-over-year growth 2024-2029 (%)
- Exhibits63: Data Table on Spicy brown and dijon mustard sauces - Year-over-year growth 2024-2029 (%)
- Exhibits64: Chart on Honey mustard sauces - Market size and forecast 2024-2029 ($ million)
- Exhibits65: Data Table on Honey mustard sauces - Market size and forecast 2024-2029 ($ million)
- Exhibits66: Chart on Honey mustard sauces - Year-over-year growth 2024-2029 (%)
- Exhibits67: Data Table on Honey mustard sauces - Year-over-year growth 2024-2029 (%)
- Exhibits68: Chart on Others - Market size and forecast 2024-2029 ($ million)
- Exhibits69: Data Table on Others - Market size and forecast 2024-2029 ($ million)
- Exhibits70: Chart on Others - Year-over-year growth 2024-2029 (%)
- Exhibits71: Data Table on Others - Year-over-year growth 2024-2029 (%)
- Exhibits72: Market opportunity by Product ($ million)
- Exhibits73: Data Table on Market opportunity by Product ($ million)
- Exhibits74: Chart on Packaging - Market share 2024-2029 (%)
- Exhibits75: Data Table on Packaging - Market share 2024-2029 (%)
- Exhibits76: Chart on Comparison by Packaging
- Exhibits77: Data Table on Comparison by Packaging
- Exhibits78: Chart on Bottles - Market size and forecast 2024-2029 ($ million)
- Exhibits79: Data Table on Bottles - Market size and forecast 2024-2029 ($ million)
- Exhibits80: Chart on Bottles - Year-over-year growth 2024-2029 (%)
- Exhibits81: Data Table on Bottles - Year-over-year growth 2024-2029 (%)
- Exhibits82: Chart on Sachets - Market size and forecast 2024-2029 ($ million)
- Exhibits83: Data Table on Sachets - Market size and forecast 2024-2029 ($ million)
- Exhibits84: Chart on Sachets - Year-over-year growth 2024-2029 (%)
- Exhibits85: Data Table on Sachets - Year-over-year growth 2024-2029 (%)
- Exhibits86: Chart on Jars - Market size and forecast 2024-2029 ($ million)
- Exhibits87: Data Table on Jars - Market size and forecast 2024-2029 ($ million)
- Exhibits88: Chart on Jars - Year-over-year growth 2024-2029 (%)
- Exhibits89: Data Table on Jars - Year-over-year growth 2024-2029 (%)
- Exhibits90: Market opportunity by Packaging ($ million)
- Exhibits91: Data Table on Market opportunity by Packaging ($ million)
- Exhibits92: Analysis of price sensitivity, lifecycle, customer purchase basket, adoption rates, and purchase criteria
- Exhibits93: Chart on Market share By Geographical Landscape 2024-2029 (%)
- Exhibits94: Data Table on Market share By Geographical Landscape 2024-2029 (%)
- Exhibits95: Chart on Geographic comparison
- Exhibits96: Data Table on Geographic comparison
- Exhibits97: Chart on North America - Market size and forecast 2024-2029 ($ million)
- Exhibits98: Data Table on North America - Market size and forecast 2024-2029 ($ million)
- Exhibits99: Chart on North America - Year-over-year growth 2024-2029 (%)
- Exhibits100: Data Table on North America - Year-over-year growth 2024-2029 (%)
- Exhibits101: Chart on Europe - Market size and forecast 2024-2029 ($ million)
- Exhibits102: Data Table on Europe - Market size and forecast 2024-2029 ($ million)
- Exhibits103: Chart on Europe - Year-over-year growth 2024-2029 (%)
- Exhibits104: Data Table on Europe - Year-over-year growth 2024-2029 (%)
- Exhibits105: Chart on APAC - Market size and forecast 2024-2029 ($ million)
- Exhibits106: Data Table on APAC - Market size and forecast 2024-2029 ($ million)
- Exhibits107: Chart on APAC - Year-over-year growth 2024-2029 (%)
- Exhibits108: Data Table on APAC - Year-over-year growth 2024-2029 (%)
- Exhibits109: Chart on South America - Market size and forecast 2024-2029 ($ million)
- Exhibits110: Data Table on South America - Market size and forecast 2024-2029 ($ million)
- Exhibits111: Chart on South America - Year-over-year growth 2024-2029 (%)
- Exhibits112: Data Table on South America - Year-over-year growth 2024-2029 (%)
- Exhibits113: Chart on Middle East and Africa - Market size and forecast 2024-2029 ($ million)
- Exhibits114: Data Table on Middle East and Africa - Market size and forecast 2024-2029 ($ million)
- Exhibits115: Chart on Middle East and Africa - Year-over-year growth 2024-2029 (%)
- Exhibits116: Data Table on Middle East and Africa - Year-over-year growth 2024-2029 (%)
- Exhibits117: Chart on US - Market size and forecast 2024-2029 ($ million)
- Exhibits118: Data Table on US - Market size and forecast 2024-2029 ($ million)
- Exhibits119: Chart on US - Year-over-year growth 2024-2029 (%)
- Exhibits120: Data Table on US - Year-over-year growth 2024-2029 (%)
- Exhibits121: Chart on UK - Market size and forecast 2024-2029 ($ million)
- Exhibits122: Data Table on UK - Market size and forecast 2024-2029 ($ million)
- Exhibits123: Chart on UK - Year-over-year growth 2024-2029 (%)
- Exhibits124: Data Table on UK - Year-over-year growth 2024-2029 (%)
- Exhibits125: Chart on Canada - Market size and forecast 2024-2029 ($ million)
- Exhibits126: Data Table on Canada - Market size and forecast 2024-2029 ($ million)
- Exhibits127: Chart on Canada - Year-over-year growth 2024-2029 (%)
- Exhibits128: Data Table on Canada - Year-over-year growth 2024-2029 (%)
- Exhibits129: Chart on China - Market size and forecast 2024-2029 ($ million)
- Exhibits130: Data Table on China - Market size and forecast 2024-2029 ($ million)
- Exhibits131: Chart on China - Year-over-year growth 2024-2029 (%)
- Exhibits132: Data Table on China - Year-over-year growth 2024-2029 (%)
- Exhibits133: Chart on Germany - Market size and forecast 2024-2029 ($ million)
- Exhibits134: Data Table on Germany - Market size and forecast 2024-2029 ($ million)
- Exhibits135: Chart on Germany - Year-over-year growth 2024-2029 (%)
- Exhibits136: Data Table on Germany - Year-over-year growth 2024-2029 (%)
- Exhibits137: Chart on India - Market size and forecast 2024-2029 ($ million)
- Exhibits138: Data Table on India - Market size and forecast 2024-2029 ($ million)
- Exhibits139: Chart on India - Year-over-year growth 2024-2029 (%)
- Exhibits140: Data Table on India - Year-over-year growth 2024-2029 (%)
- Exhibits141: Chart on Japan - Market size and forecast 2024-2029 ($ million)
- Exhibits142: Data Table on Japan - Market size and forecast 2024-2029 ($ million)
- Exhibits143: Chart on Japan - Year-over-year growth 2024-2029 (%)
- Exhibits144: Data Table on Japan - Year-over-year growth 2024-2029 (%)
- Exhibits145: Chart on France - Market size and forecast 2024-2029 ($ million)
- Exhibits146: Data Table on France - Market size and forecast 2024-2029 ($ million)
- Exhibits147: Chart on France - Year-over-year growth 2024-2029 (%)
- Exhibits148: Data Table on France - Year-over-year growth 2024-2029 (%)
- Exhibits149: Chart on Italy - Market size and forecast 2024-2029 ($ million)
- Exhibits150: Data Table on Italy - Market size and forecast 2024-2029 ($ million)
- Exhibits151: Chart on Italy - Year-over-year growth 2024-2029 (%)
- Exhibits152: Data Table on Italy - Year-over-year growth 2024-2029 (%)
- Exhibits153: Chart on Spain - Market size and forecast 2024-2029 ($ million)
- Exhibits154: Data Table on Spain - Market size and forecast 2024-2029 ($ million)
- Exhibits155: Chart on Spain - Year-over-year growth 2024-2029 (%)
- Exhibits156: Data Table on Spain - Year-over-year growth 2024-2029 (%)
- Exhibits157: Market opportunity By Geographical Landscape ($ million)
- Exhibits158: Data Tables on Market opportunity By Geographical Landscape ($ million)
- Exhibits159: Impact of drivers and challenges in 2024 and 2029
- Exhibits160: Overview on criticality of inputs and factors of differentiation
- Exhibits161: Overview on factors of disruption
- Exhibits162: Impact of key risks on business
- Exhibits163: Companies covered
- Exhibits164: Company ranking index
- Exhibits165: Matrix on companies position and classification
- Exhibits166: Conagra Brands Inc. - Overview
- Exhibits167: Conagra Brands Inc. - Business segments
- Exhibits168: Conagra Brands Inc. - Key news
- Exhibits169: Conagra Brands Inc. - Key offerings
- Exhibits170: Conagra Brands Inc. - Segment focus
- Exhibits171: SWOT
- Exhibits172: Cremica Food Industries Ltd. - Overview
- Exhibits173: Cremica Food Industries Ltd. - Product / Service
- Exhibits174: Cremica Food Industries Ltd. - Key offerings
- Exhibits175: SWOT
- Exhibits176: Efoods Zimbabwe - Overview
- Exhibits177: Efoods Zimbabwe - Product / Service
- Exhibits178: Efoods Zimbabwe - Key offerings
- Exhibits179: SWOT
- Exhibits180: Fruitomans - Overview
- Exhibits181: Fruitomans - Product / Service
- Exhibits182: Fruitomans - Key offerings
- Exhibits183: SWOT
- Exhibits184: Golden State Foods LLC - Overview
- Exhibits185: Golden State Foods LLC - Product / Service
- Exhibits186: Golden State Foods LLC - Key offerings
- Exhibits187: SWOT
- Exhibits188: HACO AG - Overview
- Exhibits189: HACO AG - Product / Service
- Exhibits190: HACO AG - Key offerings
- Exhibits191: SWOT
- Exhibits192: Huntsinger Farms - Overview
- Exhibits193: Huntsinger Farms - Product / Service
- Exhibits194: Huntsinger Farms - Key offerings
- Exhibits195: SWOT
- Exhibits196: Marina Foods Inc. - Overview
- Exhibits197: Marina Foods Inc. - Product / Service
- Exhibits198: Marina Foods Inc. - Key offerings
- Exhibits199: SWOT
- Exhibits200: McCormick and Co. Inc. - Overview
- Exhibits201: McCormick and Co. Inc. - Business segments
- Exhibits202: McCormick and Co. Inc. - Key news
- Exhibits203: McCormick and Co. Inc. - Key offerings
- Exhibits204: McCormick and Co. Inc. - Segment focus
- Exhibits205: SWOT
- Exhibits206: Northwest Gourmet Foods Products Inc. - Overview
- Exhibits207: Northwest Gourmet Foods Products Inc. - Product / Service
- Exhibits208: Northwest Gourmet Foods Products Inc. - Key offerings
- Exhibits209: SWOT
- Exhibits210: Orkla ASA - Overview
- Exhibits211: Orkla ASA - Business segments
- Exhibits212: Orkla ASA - Key news
- Exhibits213: Orkla ASA - Key offerings
- Exhibits214: Orkla ASA - Segment focus
- Exhibits215: SWOT
- Exhibits216: STM Foods Pvt. Ltd. - Overview
- Exhibits217: STM Foods Pvt. Ltd. - Product / Service
- Exhibits218: STM Foods Pvt. Ltd. - Key offerings
- Exhibits219: SWOT
- Exhibits220: The Kraft Heinz Co. - Overview
- Exhibits221: The Kraft Heinz Co. - Business segments
- Exhibits222: The Kraft Heinz Co. - Key news
- Exhibits223: The Kraft Heinz Co. - Key offerings
- Exhibits224: The Kraft Heinz Co. - Segment focus
- Exhibits225: SWOT
- Exhibits226: Unilever PLC - Overview
- Exhibits227: Unilever PLC - Business segments
- Exhibits228: Unilever PLC - Key offerings
- Exhibits229: Unilever PLC - Segment focus
- Exhibits230: SWOT
- Exhibits231: VRB CONSUMER PRODUCTS Pvt. Ltd. - Overview
- Exhibits232: VRB CONSUMER PRODUCTS Pvt. Ltd. - Product / Service
- Exhibits233: VRB CONSUMER PRODUCTS Pvt. Ltd. - Key offerings
- Exhibits234: SWOT
- Exhibits235: Inclusions checklist
- Exhibits236: Exclusions checklist
- Exhibits237: Currency conversion rates for US$
- Exhibits238: Research methodology
- Exhibits239: Information sources
- Exhibits240: Data validation
- Exhibits241: Validation techniques employed for market sizing
- Exhibits242: Data synthesis
- Exhibits243: 360 degree market analysis
- Exhibits244: List of abbreviations
The mustard sauces market is forecasted to grow by USD 1,490.8 mn during 2024-2029, accelerating at a CAGR of 7.3% during the forecast period. The report on the mustard sauces market provides a holistic analysis, market size and forecast, trends, growth drivers, and challenges, as well as vendor analysis covering around 25 vendors.
The report offers an up-to-date analysis regarding the current market scenario, the latest trends and drivers, and the overall market environment. The market is driven by changing consumer perception of processed mustard sauces, increasing use of mustard sauce as dip, and new product launches in mustard sauce market.
| Market Scope | |
|---|---|
| Base Year | 2025 |
| End Year | 2029 |
| Series Year | 2025-2029 |
| Growth Momentum | Accelerate |
| YOY 2025 | 6.7% |
| CAGR | 7.3% |
| Incremental Value | $1,490.8 mn |
The study was conducted using an objective combination of primary and secondary information including inputs from key participants in the industry. The report contains a comprehensive market size data, segment with regional analysis and vendor landscape in addition to an analysis of the key companies. Reports have historic and forecast data.
Technavio's mustard sauces market is segmented as below:
By Distribution Channel
- Offline
- Online
By Product
- Yellow mustard sauces
- Spicy brown and dijon mustard sauces
- Honey mustard sauces
- Others
By Packaging
- Bottles
- Sachets
- Jars
By Geographical Landscape
- North America
- Europe
- APAC
- South America
- Middle East and Africa
This study identifies the marketing and strategic initiatives in mustard sauce market as one of the prime reasons driving the mustard sauces market growth during the next few years. Also, packaging innovations in mustard sauces market and certifications and product traceability for mustard sauce will lead to sizable demand in the market.
The report on the mustard sauces market covers the following areas:
- Mustard Sauces Market sizing
- Mustard Sauces Market forecast
- Mustard Sauces Market industry analysis
The robust vendor analysis is designed to help clients improve their market position, and in line with this, this report provides a detailed analysis of several leading mustard sauces market vendors that include Conagra Brands Inc., Cremica Food Industries Ltd., Develey Senf and Feinkost GmbH, DNV Food Pvt. Ltd., EAGLE INTERNATIONAL, Efoods Zimbabwe, Fruitomans, Golden State Foods LLC, HACO AG, Huntsinger Farms, Marina Foods Inc., McCormick and Co. Inc., Northwest Gourmet Foods Products Inc., Orkla ASA, STM Foods Pvt. Ltd., The Kraft Heinz Co., Unilever PLC, and VRB CONSUMER PRODUCTS Pvt. Ltd.. Also, the mustard sauces market analysis report includes information on upcoming trends and challenges that will influence market growth. This is to help companies strategize and leverage all forthcoming growth opportunities.
The publisher presents a detailed picture of the market by the way of study, synthesis, and summation of data from multiple sources by an analysis of key parameters such as profit, pricing, competition, and promotions. It presents various market facets by identifying the key industry influencers. The data presented is comprehensive, reliable, and a result of extensive primary and secondary research. The market research reports provide a complete competitive landscape and an in-depth vendor selection methodology and analysis using qualitative and quantitative research to forecast accurate market growth.
Table of Contents
1 Executive Summary
- 1.1 Market overview
- Executive Summary - Chart on Market Overview
- Executive Summary - Data Table on Market Overview
- Executive Summary - Chart on Global Market Characteristics
- Executive Summary - Chart on Market By Geographical Landscape
- Executive Summary - Chart on Market Segmentation by Distribution Channel
- Executive Summary - Chart on Market Segmentation by Product
- Executive Summary - Chart on Market Segmentation by Packaging
- Executive Summary - Chart on Incremental Growth
- Executive Summary - Data Table on Incremental Growth
- Executive Summary - Chart on Company Market Positioning
2 Technavio Analysis
- 2.1 Analysis of price sensitivity, lifecycle, customer purchase basket, adoption rates, and purchase criteria
- Analysis of price sensitivity, lifecycle, customer purchase basket, adoption rates, and purchase criteria
- 2.2 Criticality of inputs and Factors of differentiation
- Overview on criticality of inputs and factors of differentiation
- 2.3 Factors of disruption
- Overview on factors of disruption
- 2.4 Impact of drivers and challenges
- Impact of drivers and challenges in 2024 and 2029
3 Market Landscape
- 3.1 Market ecosystem
- Parent Market
- Data Table on - Parent Market
- 3.2 Market characteristics
- Market characteristics analysis
- 3.3 Value chain analysis
- Value chain analysis
4 Market Sizing
- 4.1 Market definition
- Offerings of companies included in the market definition
- 4.2 Market segment analysis
- Market segments
- 4.3 Market size 2024
- 4.4 Market outlook: Forecast for 2024-2029
- Chart on Global - Market size and forecast 2024-2029 ($ million)
- Data Table on Global - Market size and forecast 2024-2029 ($ million)
- Chart on Global Market: Year-over-year growth 2024-2029 (%)
- Data Table on Global Market: Year-over-year growth 2024-2029 (%)
5 Historic Market Size
- 5.1 Global Mustard Sauces Market 2019 - 2023
- Historic Market Size - Data Table on Global Mustard Sauces Market 2019 - 2023 ($ million)
- 5.2 Distribution Channel segment analysis 2019 - 2023
- Historic Market Size - Distribution Channel Segment 2019 - 2023 ($ million)
- 5.3 Product segment analysis 2019 - 2023
- Historic Market Size - Product Segment 2019 - 2023 ($ million)
- 5.4 Packaging segment analysis 2019 - 2023
- Historic Market Size - Packaging Segment 2019 - 2023 ($ million)
- 5.5 Geography segment analysis 2019 - 2023
- Historic Market Size - Geography Segment 2019 - 2023 ($ million)
- 5.6 Country segment analysis 2019 - 2023
- Historic Market Size - Country Segment 2019 - 2023 ($ million)
6 Qualitative Analysis
- 6.1 Impact of AI in the global mustard sauces market
7 Five Forces Analysis
- 7.1 Five forces summary
- Five forces analysis - Comparison between 2024 and 2029
- 7.2 Bargaining power of buyers
- Bargaining power of buyers - Impact of key factors 2024 and 2029
- 7.3 Bargaining power of suppliers
- Bargaining power of suppliers - Impact of key factors in 2024 and 2029
- 7.4 Threat of new entrants
- Threat of new entrants - Impact of key factors in 2024 and 2029
- 7.5 Threat of substitutes
- Threat of substitutes - Impact of key factors in 2024 and 2029
- 7.6 Threat of rivalry
- Threat of rivalry - Impact of key factors in 2024 and 2029
- 7.7 Market condition
- Chart on Market condition - Five forces 2024 and 2029
8 Market Segmentation by Distribution Channel
- 8.1 Market segments
- Chart on Distribution Channel - Market share 2024-2029 (%)
- Data Table on Distribution Channel - Market share 2024-2029 (%)
- 8.2 Comparison by Distribution Channel
- Chart on Comparison by Distribution Channel
- Data Table on Comparison by Distribution Channel
- 8.3 Offline - Market size and forecast 2024-2029
- Chart on Offline - Market size and forecast 2024-2029 ($ million)
- Data Table on Offline - Market size and forecast 2024-2029 ($ million)
- Chart on Offline - Year-over-year growth 2024-2029 (%)
- Data Table on Offline - Year-over-year growth 2024-2029 (%)
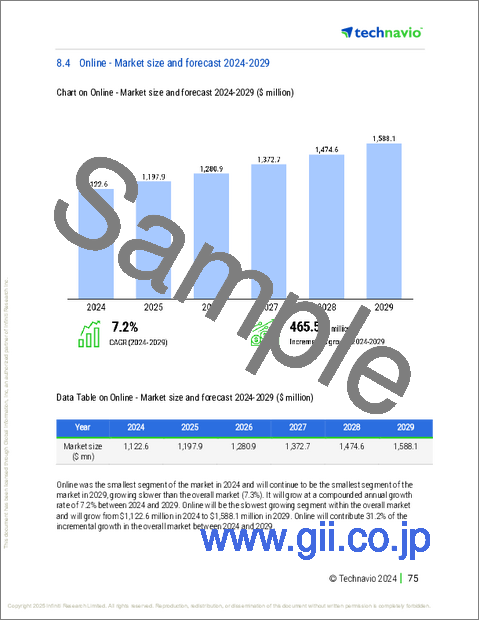
- 8.4 Online - Market size and forecast 2024-2029
- Chart on Online - Market size and forecast 2024-2029 ($ million)
- Data Table on Online - Market size and forecast 2024-2029 ($ million)
- Chart on Online - Year-over-year growth 2024-2029 (%)
- Data Table on Online - Year-over-year growth 2024-2029 (%)
- 8.5 Market opportunity by Distribution Channel
- Market opportunity by Distribution Channel ($ million)
- Data Table on Market opportunity by Distribution Channel ($ million)
9 Market Segmentation by Product
- 9.1 Market segments
- Chart on Product - Market share 2024-2029 (%)
- Data Table on Product - Market share 2024-2029 (%)
- 9.2 Comparison by Product
- Chart on Comparison by Product
- Data Table on Comparison by Product
- 9.3 Yellow mustard sauces - Market size and forecast 2024-2029
- Chart on Yellow mustard sauces - Market size and forecast 2024-2029 ($ million)
- Data Table on Yellow mustard sauces - Market size and forecast 2024-2029 ($ million)
- Chart on Yellow mustard sauces - Year-over-year growth 2024-2029 (%)
- Data Table on Yellow mustard sauces - Year-over-year growth 2024-2029 (%)
- 9.4 Spicy brown and dijon mustard sauces - Market size and forecast 2024-2029
- Chart on Spicy brown and dijon mustard sauces - Market size and forecast 2024-2029 ($ million)
- Data Table on Spicy brown and dijon mustard sauces - Market size and forecast 2024-2029 ($ million)
- Chart on Spicy brown and dijon mustard sauces - Year-over-year growth 2024-2029 (%)
- Data Table on Spicy brown and dijon mustard sauces - Year-over-year growth 2024-2029 (%)
- 9.5 Honey mustard sauces - Market size and forecast 2024-2029
- Chart on Honey mustard sauces - Market size and forecast 2024-2029 ($ million)
- Data Table on Honey mustard sauces - Market size and forecast 2024-2029 ($ million)
- Chart on Honey mustard sauces - Year-over-year growth 2024-2029 (%)
- Data Table on Honey mustard sauces - Year-over-year growth 2024-2029 (%)
- 9.6 Others - Market size and forecast 2024-2029
- Chart on Others - Market size and forecast 2024-2029 ($ million)
- Data Table on Others - Market size and forecast 2024-2029 ($ million)
- Chart on Others - Year-over-year growth 2024-2029 (%)
- Data Table on Others - Year-over-year growth 2024-2029 (%)
- 9.7 Market opportunity by Product
- Market opportunity by Product ($ million)
- Data Table on Market opportunity by Product ($ million)
10 Market Segmentation by Packaging
- 10.1 Market segments
- Chart on Packaging - Market share 2024-2029 (%)
- Data Table on Packaging - Market share 2024-2029 (%)
- 10.2 Comparison by Packaging
- Chart on Comparison by Packaging
- Data Table on Comparison by Packaging
- 10.3 Bottles - Market size and forecast 2024-2029
- Chart on Bottles - Market size and forecast 2024-2029 ($ million)
- Data Table on Bottles - Market size and forecast 2024-2029 ($ million)
- Chart on Bottles - Year-over-year growth 2024-2029 (%)
- Data Table on Bottles - Year-over-year growth 2024-2029 (%)
- 10.4 Sachets - Market size and forecast 2024-2029
- Chart on Sachets - Market size and forecast 2024-2029 ($ million)
- Data Table on Sachets - Market size and forecast 2024-2029 ($ million)
- Chart on Sachets - Year-over-year growth 2024-2029 (%)
- Data Table on Sachets - Year-over-year growth 2024-2029 (%)
- 10.5 Jars - Market size and forecast 2024-2029
- Chart on Jars - Market size and forecast 2024-2029 ($ million)
- Data Table on Jars - Market size and forecast 2024-2029 ($ million)
- Chart on Jars - Year-over-year growth 2024-2029 (%)
- Data Table on Jars - Year-over-year growth 2024-2029 (%)
- 10.6 Market opportunity by Packaging
- Market opportunity by Packaging ($ million)
- Data Table on Market opportunity by Packaging ($ million)
11 Customer Landscape
- 11.1 Customer landscape overview
- Analysis of price sensitivity, lifecycle, customer purchase basket, adoption rates, and purchase criteria
12 Geographic Landscape
- 12.1 Geographic segmentation
- Chart on Market share By Geographical Landscape 2024-2029 (%)
- Data Table on Market share By Geographical Landscape 2024-2029 (%)
- 12.2 Geographic comparison
- Chart on Geographic comparison
- Data Table on Geographic comparison
- 12.3 North America - Market size and forecast 2024-2029
- Chart on North America - Market size and forecast 2024-2029 ($ million)
- Data Table on North America - Market size and forecast 2024-2029 ($ million)
- Chart on North America - Year-over-year growth 2024-2029 (%)
- Data Table on North America - Year-over-year growth 2024-2029 (%)
- 12.4 Europe - Market size and forecast 2024-2029
- Chart on Europe - Market size and forecast 2024-2029 ($ million)
- Data Table on Europe - Market size and forecast 2024-2029 ($ million)
- Chart on Europe - Year-over-year growth 2024-2029 (%)
- Data Table on Europe - Year-over-year growth 2024-2029 (%)
- 12.5 APAC - Market size and forecast 2024-2029
- Chart on APAC - Market size and forecast 2024-2029 ($ million)
- Data Table on APAC - Market size and forecast 2024-2029 ($ million)
- Chart on APAC - Year-over-year growth 2024-2029 (%)
- Data Table on APAC - Year-over-year growth 2024-2029 (%)
- 12.6 South America - Market size and forecast 2024-2029
- Chart on South America - Market size and forecast 2024-2029 ($ million)
- Data Table on South America - Market size and forecast 2024-2029 ($ million)
- Chart on South America - Year-over-year growth 2024-2029 (%)
- Data Table on South America - Year-over-year growth 2024-2029 (%)
- 12.7 Middle East and Africa - Market size and forecast 2024-2029
- Chart on Middle East and Africa - Market size and forecast 2024-2029 ($ million)
- Data Table on Middle East and Africa - Market size and forecast 2024-2029 ($ million)
- Chart on Middle East and Africa - Year-over-year growth 2024-2029 (%)
- Data Table on Middle East and Africa - Year-over-year growth 2024-2029 (%)
- 12.8 US - Market size and forecast 2024-2029
- Chart on US - Market size and forecast 2024-2029 ($ million)
- Data Table on US - Market size and forecast 2024-2029 ($ million)
- Chart on US - Year-over-year growth 2024-2029 (%)
- Data Table on US - Year-over-year growth 2024-2029 (%)
- 12.9 UK - Market size and forecast 2024-2029
- Chart on UK - Market size and forecast 2024-2029 ($ million)
- Data Table on UK - Market size and forecast 2024-2029 ($ million)
- Chart on UK - Year-over-year growth 2024-2029 (%)
- Data Table on UK - Year-over-year growth 2024-2029 (%)
- 12.10 Canada - Market size and forecast 2024-2029
- Chart on Canada - Market size and forecast 2024-2029 ($ million)
- Data Table on Canada - Market size and forecast 2024-2029 ($ million)
- Chart on Canada - Year-over-year growth 2024-2029 (%)
- Data Table on Canada - Year-over-year growth 2024-2029 (%)
- 12.11 China - Market size and forecast 2024-2029
- Chart on China - Market size and forecast 2024-2029 ($ million)
- Data Table on China - Market size and forecast 2024-2029 ($ million)
- Chart on China - Year-over-year growth 2024-2029 (%)
- Data Table on China - Year-over-year growth 2024-2029 (%)
- 12.12 Germany - Market size and forecast 2024-2029
- Chart on Germany - Market size and forecast 2024-2029 ($ million)
- Data Table on Germany - Market size and forecast 2024-2029 ($ million)
- Chart on Germany - Year-over-year growth 2024-2029 (%)
- Data Table on Germany - Year-over-year growth 2024-2029 (%)
- 12.13 India - Market size and forecast 2024-2029
- Chart on India - Market size and forecast 2024-2029 ($ million)
- Data Table on India - Market size and forecast 2024-2029 ($ million)
- Chart on India - Year-over-year growth 2024-2029 (%)
- Data Table on India - Year-over-year growth 2024-2029 (%)
- 12.14 Japan - Market size and forecast 2024-2029
- Chart on Japan - Market size and forecast 2024-2029 ($ million)
- Data Table on Japan - Market size and forecast 2024-2029 ($ million)
- Chart on Japan - Year-over-year growth 2024-2029 (%)
- Data Table on Japan - Year-over-year growth 2024-2029 (%)
- 12.15 France - Market size and forecast 2024-2029
- Chart on France - Market size and forecast 2024-2029 ($ million)
- Data Table on France - Market size and forecast 2024-2029 ($ million)
- Chart on France - Year-over-year growth 2024-2029 (%)
- Data Table on France - Year-over-year growth 2024-2029 (%)
- 12.16 Italy - Market size and forecast 2024-2029
- Chart on Italy - Market size and forecast 2024-2029 ($ million)
- Data Table on Italy - Market size and forecast 2024-2029 ($ million)
- Chart on Italy - Year-over-year growth 2024-2029 (%)
- Data Table on Italy - Year-over-year growth 2024-2029 (%)
- 12.17 Spain - Market size and forecast 2024-2029
- Chart on Spain - Market size and forecast 2024-2029 ($ million)
- Data Table on Spain - Market size and forecast 2024-2029 ($ million)
- Chart on Spain - Year-over-year growth 2024-2029 (%)
- Data Table on Spain - Year-over-year growth 2024-2029 (%)
- 12.18 Market opportunity By Geographical Landscape
- Market opportunity By Geographical Landscape ($ million)
- Data Tables on Market opportunity By Geographical Landscape ($ million)
13 Drivers, Challenges, and Opportunity/Restraints
- 13.1 Market drivers
- 13.2 Market challenges
- 13.3 Impact of drivers and challenges
- Impact of drivers and challenges in 2024 and 2029
- 13.4 Market opportunities/restraints
14 Competitive Landscape
- 14.1 Overview
- 14.2 Competitive Landscape
- Overview on criticality of inputs and factors of differentiation
- 14.3 Landscape disruption
- Overview on factors of disruption
- 14.4 Industry risks
- Impact of key risks on business
15 Competitive Analysis
- 15.1 Companies profiled
- Companies covered
- 15.2 Company ranking index
- Company ranking index
- 15.3 Market positioning of companies
- Matrix on companies position and classification
- 15.4 Conagra Brands Inc.
- Conagra Brands Inc. - Overview
- Conagra Brands Inc. - Business segments
- Conagra Brands Inc. - Key news
- Conagra Brands Inc. - Key offerings
- Conagra Brands Inc. - Segment focus
- SWOT
- 15.5 Cremica Food Industries Ltd.
- Cremica Food Industries Ltd. - Overview
- Cremica Food Industries Ltd. - Product / Service
- Cremica Food Industries Ltd. - Key offerings
- SWOT
- 15.6 Efoods Zimbabwe
- Efoods Zimbabwe - Overview
- Efoods Zimbabwe - Product / Service
- Efoods Zimbabwe - Key offerings
- SWOT
- 15.7 Fruitomans
- Fruitomans - Overview
- Fruitomans - Product / Service
- Fruitomans - Key offerings
- SWOT
- 15.8 Golden State Foods LLC
- Golden State Foods LLC - Overview
- Golden State Foods LLC - Product / Service
- Golden State Foods LLC - Key offerings
- SWOT
- 15.9 HACO AG
- HACO AG - Overview
- HACO AG - Product / Service
- HACO AG - Key offerings
- SWOT
- 15.10 Huntsinger Farms
- Huntsinger Farms - Overview
- Huntsinger Farms - Product / Service
- Huntsinger Farms - Key offerings
- SWOT
- 15.11 Marina Foods Inc.
- Marina Foods Inc. - Overview
- Marina Foods Inc. - Product / Service
- Marina Foods Inc. - Key offerings
- SWOT
- 15.12 McCormick and Co. Inc.
- McCormick and Co. Inc. - Overview
- McCormick and Co. Inc. - Business segments
- McCormick and Co. Inc. - Key news
- McCormick and Co. Inc. - Key offerings
- McCormick and Co. Inc. - Segment focus
- SWOT
- 15.13 Northwest Gourmet Foods Products Inc.
- Northwest Gourmet Foods Products Inc. - Overview
- Northwest Gourmet Foods Products Inc. - Product / Service
- Northwest Gourmet Foods Products Inc. - Key offerings
- SWOT
- 15.14 Orkla ASA
- Orkla ASA - Overview
- Orkla ASA - Business segments
- Orkla ASA - Key news
- Orkla ASA - Key offerings
- Orkla ASA - Segment focus
- SWOT
- 15.15 STM Foods Pvt. Ltd.
- STM Foods Pvt. Ltd. - Overview
- STM Foods Pvt. Ltd. - Product / Service
- STM Foods Pvt. Ltd. - Key offerings
- SWOT
- 15.16 The Kraft Heinz Co.
- The Kraft Heinz Co. - Overview
- The Kraft Heinz Co. - Business segments
- The Kraft Heinz Co. - Key news
- The Kraft Heinz Co. - Key offerings
- The Kraft Heinz Co. - Segment focus
- SWOT
- 15.17 Unilever PLC
- Unilever PLC - Overview
- Unilever PLC - Business segments
- Unilever PLC - Key offerings
- Unilever PLC - Segment focus
- SWOT
- 15.18 VRB CONSUMER PRODUCTS Pvt. Ltd.
- VRB CONSUMER PRODUCTS Pvt. Ltd. - Overview
- VRB CONSUMER PRODUCTS Pvt. Ltd. - Product / Service
- VRB CONSUMER PRODUCTS Pvt. Ltd. - Key offerings
- SWOT
16 Appendix
- 16.1 Scope of the report
- 16.2 Inclusions and exclusions checklist
- Inclusions checklist
- Exclusions checklist
- 16.3 Currency conversion rates for US$
- Currency conversion rates for US$
- 16.4 Research methodology
- Research methodology
- 16.5 Data procurement
- Information sources
- 16.6 Data validation
- Data validation
- 16.7 Validation techniques employed for market sizing
- Validation techniques employed for market sizing
- 16.8 Data synthesis
- Data synthesis
- 16.9 360 degree market analysis
- 360 degree market analysis
- 16.10 List of abbreviations
- List of abbreviations

