|
|
市場調査レポート
商品コード
1783877
ハイエンドサーバーの世界市場 2025-2029Global High End Server Market 2025-2029 |
||||||

|
|||||||
カスタマイズ可能
|
|||||||

| ハイエンドサーバーの世界市場 2025-2029 |
|
出版日: 2025年07月29日
発行: TechNavio
ページ情報: 英文 237 Pages
納期: 即納可能
|

全表示
- 概要
- 図表
- 目次
ハイエンドサーバー市場は2024-2029年に846億4,850万米ドル、予測期間中のCAGRは26%で成長すると予測されます。
当レポートでは、ハイエンドサーバー市場の全体的な分析、市場規模・予測、動向、成長促進要因、課題、約25のベンダーを網羅したベンダー分析などを掲載しています。
現在の市場シナリオ、最新動向と促進要因、市場環境全体に関する最新分析を提供しています。市場は、エッジコンピューティングに対するニーズの高まり、IoT対応デバイスの普及拡大、人工知能(AI)に対する需要の高まりによって牽引されています。
| 市場範囲 | |
|---|---|
| 基準年 | 2025 |
| 終了年 | 2029 |
| 予測期間 | 2025-2029 |
| 成長モメンタム | 加速 |
| 前年比 | 19.5% |
| CAGR | 26% |
| 増分額 | 846億4,850万米ドル |
この調査は、業界の主要参加者からのインプットを含め、一次情報と二次情報を客観的に組み合わせて実施しました。レポートには、主要企業の分析に加え、包括的な市場規模データ、地域別分析によるセグメント、ベンダー情勢が含まれています。レポートにはヒストリカルデータと予測データがあります。
本調査では、ハイパーコンバージドインフラストラクチャが今後数年間のハイエンドサーバー市場の成長を促進する主要な理由の1つであると特定しています。また、さまざまなデータ集約型産業におけるハイパフォーマンスコンピューティングの需要の増加や、AIや機械学習対応機能に対する産業の傾斜の高まりは、市場の大きな需要につながります。
目次
第1章 エグゼクティブサマリー
- 市場概要
第2章 Technavio分析
- 価格・ライフサイクル・顧客購入バスケット・採用率・購入基準の分析
- インプットの重要性と差別化の要因
- 混乱の要因
- 促進要因と課題の影響
第3章 市場情勢
- 市場エコシステム
- 市場の特徴
- バリューチェーン分析
第4章 市場規模
- 市場の定義
- 市場セグメント分析
- 市場規模 2024
- 市場の見通し 2024-2029
第5章 市場規模実績
- ハイエンドサーバーの世界市場 2019年~2023年
- エンドユーザー別セグメント分析 2019年~2023年
- 流通チャネル別セグメント分析 2019年~2023年
- 材料別セグメント分析 2019年~2023年
- 地域別セグメント分析 2019年~2023年
- 国別セグメント分析 2019年~2023年
第6章 定性分析
- AIの影響:ハイエンドサーバーの世界市場
第7章 ファイブフォース分析
- ファイブフォースの要約
- 買い手の交渉力
- 供給企業の交渉力
- 新規参入業者の脅威
- 代替品の脅威
- 競争の脅威
- 市況
第8章 市場セグメンテーション:エンドユーザー別
- 市場セグメント
- 比較:エンドユーザー別
- ITと通信:市場規模と予測 2024-2029
- BFSI:市場規模と予測 2024-2029
- 政府と防衛:市場規模と予測 2024-2029
- その他:市場規模と予測 2024-2029
- 市場機会:エンドユーザー別
第9章 市場セグメンテーション:流通チャネル別
- 市場セグメント
- 比較:流通チャネル別
- 再販業者:市場規模と予測 2024-2029
- OEM:市場規模と予測 2024-2029
- システムインテグレーター:市場規模と予測 2024-2029
- 市場機会:流通チャネル別
第10章 市場セグメンテーション:材料別
- 市場セグメント
- 比較:材料別
- ラックサーバー:市場規模と予測 2024-2029
- ハイパーコンバージドサーバー:市場規模と予測 2024-2029
- ブレードサーバー:市場規模と予測 2024-2029
- タワーサーバー:市場規模と予測 2024-2029
- 市場機会:材料別
第11章 顧客情勢
- 顧客情勢の概要
第12章 地域別情勢
- 地域別セグメンテーション
- 地域別比較
- 北米:市場規模と予測 2024-2029
- 欧州:市場規模と予測 2024-2029
- アジア太平洋:市場規模と予測 2024-2029
- 中東・アフリカ:市場規模と予測 2024-2029
- 南米:市場規模と予測 2024-2029
- 米国:市場規模と予測 2024-2029
- 中国:市場規模と予測 2024-2029
- ドイツ:市場規模と予測 2024-2029
- カナダ:市場規模と予測 2024-2029
- 英国:市場規模と予測 2024-2029
- フランス:市場規模と予測 2024-2029
- 日本:市場規模と予測 2024-2029
- イタリア:市場規模と予測 2024-2029
- 韓国:市場規模と予測 2024-2029
- インド:市場規模と予測 2024-2029
- 市場機会:地域情勢別
第13章 促進要因・課題・機会・抑制要因
- 市場促進要因
- 市場の課題
- 促進要因と課題の影響
- 市場の機会・抑制要因
第14章 競合情勢
- 概要
- 競合情勢
- 混乱の状況
- 業界のリスク
第15章 競合分析
- 企業プロファイル
- 企業ランキング指数
- 企業の市場ポジショニング
- Acer Inc.
- Apple Inc.
- ASUSTeK Computer Inc.
- Cisco Systems Inc.
- Dell Technologies Inc.
- Fujitsu Ltd.
- Hewlett Packard Enterprise Co.
- Hitachi Ltd.
- Huawei Technologies Co. Ltd.
- International Business Machines Corp.
- Oracle Corp.
- SAP SE
- Super Micro Computer Inc.
- Toshiba Corp.
- Unisys Corp.
第16章 付録
Exhibits:
- Exhibits1: Executive Summary - Chart on Market Overview
- Exhibits2: Executive Summary - Data Table on Market Overview
- Exhibits3: Executive Summary - Chart on Global Market Characteristics
- Exhibits4: Executive Summary - Chart on Market By Geographical Landscape
- Exhibits5: Executive Summary - Chart on Market Segmentation by End-user
- Exhibits6: Executive Summary - Chart on Market Segmentation by Distribution Channel
- Exhibits7: Executive Summary - Chart on Market Segmentation by Material
- Exhibits8: Executive Summary - Chart on Incremental Growth
- Exhibits9: Executive Summary - Data Table on Incremental Growth
- Exhibits10: Executive Summary - Chart on Company Market Positioning
- Exhibits11: Analysis of price sensitivity, lifecycle, customer purchase basket, adoption rates, and purchase criteria
- Exhibits12: Overview on criticality of inputs and factors of differentiation
- Exhibits13: Overview on factors of disruption
- Exhibits14: Impact of drivers and challenges in 2024 and 2029
- Exhibits15: Parent Market
- Exhibits16: Data Table on - Parent Market
- Exhibits17: Market characteristics analysis
- Exhibits18: Value chain analysis
- Exhibits19: Offerings of companies included in the market definition
- Exhibits20: Market segments
- Exhibits21: Chart on Global - Market size and forecast 2024-2029 ($ million)
- Exhibits22: Data Table on Global - Market size and forecast 2024-2029 ($ million)
- Exhibits23: Chart on Global Market: Year-over-year growth 2024-2029 (%)
- Exhibits24: Data Table on Global Market: Year-over-year growth 2024-2029 (%)
- Exhibits25: Historic Market Size - Data Table on Global High End Server Market 2019 - 2023 ($ million)
- Exhibits26: Historic Market Size - End-user Segment 2019 - 2023 ($ million)
- Exhibits27: Historic Market Size - Distribution Channel Segment 2019 - 2023 ($ million)
- Exhibits28: Historic Market Size - Material Segment 2019 - 2023 ($ million)
- Exhibits29: Historic Market Size - Geography Segment 2019 - 2023 ($ million)
- Exhibits30: Historic Market Size - Country Segment 2019 - 2023 ($ million)
- Exhibits31: Five forces analysis - Comparison between 2024 and 2029
- Exhibits32: Bargaining power of buyers - Impact of key factors 2024 and 2029
- Exhibits33: Bargaining power of suppliers - Impact of key factors in 2024 and 2029
- Exhibits34: Threat of new entrants - Impact of key factors in 2024 and 2029
- Exhibits35: Threat of substitutes - Impact of key factors in 2024 and 2029
- Exhibits36: Threat of rivalry - Impact of key factors in 2024 and 2029
- Exhibits37: Chart on Market condition - Five forces 2024 and 2029
- Exhibits38: Chart on End-user - Market share 2024-2029 (%)
- Exhibits39: Data Table on End-user - Market share 2024-2029 (%)
- Exhibits40: Chart on Comparison by End-user
- Exhibits41: Data Table on Comparison by End-user
- Exhibits42: Chart on IT and telecom - Market size and forecast 2024-2029 ($ million)
- Exhibits43: Data Table on IT and telecom - Market size and forecast 2024-2029 ($ million)
- Exhibits44: Chart on IT and telecom - Year-over-year growth 2024-2029 (%)
- Exhibits45: Data Table on IT and telecom - Year-over-year growth 2024-2029 (%)
- Exhibits46: Chart on BFSI - Market size and forecast 2024-2029 ($ million)
- Exhibits47: Data Table on BFSI - Market size and forecast 2024-2029 ($ million)
- Exhibits48: Chart on BFSI - Year-over-year growth 2024-2029 (%)
- Exhibits49: Data Table on BFSI - Year-over-year growth 2024-2029 (%)
- Exhibits50: Chart on Government and defence - Market size and forecast 2024-2029 ($ million)
- Exhibits51: Data Table on Government and defence - Market size and forecast 2024-2029 ($ million)
- Exhibits52: Chart on Government and defence - Year-over-year growth 2024-2029 (%)
- Exhibits53: Data Table on Government and defence - Year-over-year growth 2024-2029 (%)
- Exhibits54: Chart on Others - Market size and forecast 2024-2029 ($ million)
- Exhibits55: Data Table on Others - Market size and forecast 2024-2029 ($ million)
- Exhibits56: Chart on Others - Year-over-year growth 2024-2029 (%)
- Exhibits57: Data Table on Others - Year-over-year growth 2024-2029 (%)
- Exhibits58: Market opportunity by End-user ($ million)
- Exhibits59: Data Table on Market opportunity by End-user ($ million)
- Exhibits60: Chart on Distribution Channel - Market share 2024-2029 (%)
- Exhibits61: Data Table on Distribution Channel - Market share 2024-2029 (%)
- Exhibits62: Chart on Comparison by Distribution Channel
- Exhibits63: Data Table on Comparison by Distribution Channel
- Exhibits64: Chart on Resellers - Market size and forecast 2024-2029 ($ million)
- Exhibits65: Data Table on Resellers - Market size and forecast 2024-2029 ($ million)
- Exhibits66: Chart on Resellers - Year-over-year growth 2024-2029 (%)
- Exhibits67: Data Table on Resellers - Year-over-year growth 2024-2029 (%)
- Exhibits68: Chart on OEM - Market size and forecast 2024-2029 ($ million)
- Exhibits69: Data Table on OEM - Market size and forecast 2024-2029 ($ million)
- Exhibits70: Chart on OEM - Year-over-year growth 2024-2029 (%)
- Exhibits71: Data Table on OEM - Year-over-year growth 2024-2029 (%)
- Exhibits72: Chart on System integrators - Market size and forecast 2024-2029 ($ million)
- Exhibits73: Data Table on System integrators - Market size and forecast 2024-2029 ($ million)
- Exhibits74: Chart on System integrators - Year-over-year growth 2024-2029 (%)
- Exhibits75: Data Table on System integrators - Year-over-year growth 2024-2029 (%)
- Exhibits76: Market opportunity by Distribution Channel ($ million)
- Exhibits77: Data Table on Market opportunity by Distribution Channel ($ million)
- Exhibits78: Chart on Material - Market share 2024-2029 (%)
- Exhibits79: Data Table on Material - Market share 2024-2029 (%)
- Exhibits80: Chart on Comparison by Material
- Exhibits81: Data Table on Comparison by Material
- Exhibits82: Chart on Rack servers - Market size and forecast 2024-2029 ($ million)
- Exhibits83: Data Table on Rack servers - Market size and forecast 2024-2029 ($ million)
- Exhibits84: Chart on Rack servers - Year-over-year growth 2024-2029 (%)
- Exhibits85: Data Table on Rack servers - Year-over-year growth 2024-2029 (%)
- Exhibits86: Chart on Hyperconverged servers - Market size and forecast 2024-2029 ($ million)
- Exhibits87: Data Table on Hyperconverged servers - Market size and forecast 2024-2029 ($ million)
- Exhibits88: Chart on Hyperconverged servers - Year-over-year growth 2024-2029 (%)
- Exhibits89: Data Table on Hyperconverged servers - Year-over-year growth 2024-2029 (%)
- Exhibits90: Chart on Blade servers - Market size and forecast 2024-2029 ($ million)
- Exhibits91: Data Table on Blade servers - Market size and forecast 2024-2029 ($ million)
- Exhibits92: Chart on Blade servers - Year-over-year growth 2024-2029 (%)
- Exhibits93: Data Table on Blade servers - Year-over-year growth 2024-2029 (%)
- Exhibits94: Chart on Tower servers - Market size and forecast 2024-2029 ($ million)
- Exhibits95: Data Table on Tower servers - Market size and forecast 2024-2029 ($ million)
- Exhibits96: Chart on Tower servers - Year-over-year growth 2024-2029 (%)
- Exhibits97: Data Table on Tower servers - Year-over-year growth 2024-2029 (%)
- Exhibits98: Market opportunity by Material ($ million)
- Exhibits99: Data Table on Market opportunity by Material ($ million)
- Exhibits100: Analysis of price sensitivity, lifecycle, customer purchase basket, adoption rates, and purchase criteria
- Exhibits101: Chart on Market share By Geographical Landscape 2024-2029 (%)
- Exhibits102: Data Table on Market share By Geographical Landscape 2024-2029 (%)
- Exhibits103: Chart on Geographic comparison
- Exhibits104: Data Table on Geographic comparison
- Exhibits105: Chart on North America - Market size and forecast 2024-2029 ($ million)
- Exhibits106: Data Table on North America - Market size and forecast 2024-2029 ($ million)
- Exhibits107: Chart on North America - Year-over-year growth 2024-2029 (%)
- Exhibits108: Data Table on North America - Year-over-year growth 2024-2029 (%)
- Exhibits109: Chart on Europe - Market size and forecast 2024-2029 ($ million)
- Exhibits110: Data Table on Europe - Market size and forecast 2024-2029 ($ million)
- Exhibits111: Chart on Europe - Year-over-year growth 2024-2029 (%)
- Exhibits112: Data Table on Europe - Year-over-year growth 2024-2029 (%)
- Exhibits113: Chart on APAC - Market size and forecast 2024-2029 ($ million)
- Exhibits114: Data Table on APAC - Market size and forecast 2024-2029 ($ million)
- Exhibits115: Chart on APAC - Year-over-year growth 2024-2029 (%)
- Exhibits116: Data Table on APAC - Year-over-year growth 2024-2029 (%)
- Exhibits117: Chart on Middle East and Africa - Market size and forecast 2024-2029 ($ million)
- Exhibits118: Data Table on Middle East and Africa - Market size and forecast 2024-2029 ($ million)
- Exhibits119: Chart on Middle East and Africa - Year-over-year growth 2024-2029 (%)
- Exhibits120: Data Table on Middle East and Africa - Year-over-year growth 2024-2029 (%)
- Exhibits121: Chart on South America - Market size and forecast 2024-2029 ($ million)
- Exhibits122: Data Table on South America - Market size and forecast 2024-2029 ($ million)
- Exhibits123: Chart on South America - Year-over-year growth 2024-2029 (%)
- Exhibits124: Data Table on South America - Year-over-year growth 2024-2029 (%)
- Exhibits125: Chart on US - Market size and forecast 2024-2029 ($ million)
- Exhibits126: Data Table on US - Market size and forecast 2024-2029 ($ million)
- Exhibits127: Chart on US - Year-over-year growth 2024-2029 (%)
- Exhibits128: Data Table on US - Year-over-year growth 2024-2029 (%)
- Exhibits129: Chart on China - Market size and forecast 2024-2029 ($ million)
- Exhibits130: Data Table on China - Market size and forecast 2024-2029 ($ million)
- Exhibits131: Chart on China - Year-over-year growth 2024-2029 (%)
- Exhibits132: Data Table on China - Year-over-year growth 2024-2029 (%)
- Exhibits133: Chart on Germany - Market size and forecast 2024-2029 ($ million)
- Exhibits134: Data Table on Germany - Market size and forecast 2024-2029 ($ million)
- Exhibits135: Chart on Germany - Year-over-year growth 2024-2029 (%)
- Exhibits136: Data Table on Germany - Year-over-year growth 2024-2029 (%)
- Exhibits137: Chart on Canada - Market size and forecast 2024-2029 ($ million)
- Exhibits138: Data Table on Canada - Market size and forecast 2024-2029 ($ million)
- Exhibits139: Chart on Canada - Year-over-year growth 2024-2029 (%)
- Exhibits140: Data Table on Canada - Year-over-year growth 2024-2029 (%)
- Exhibits141: Chart on UK - Market size and forecast 2024-2029 ($ million)
- Exhibits142: Data Table on UK - Market size and forecast 2024-2029 ($ million)
- Exhibits143: Chart on UK - Year-over-year growth 2024-2029 (%)
- Exhibits144: Data Table on UK - Year-over-year growth 2024-2029 (%)
- Exhibits145: Chart on France - Market size and forecast 2024-2029 ($ million)
- Exhibits146: Data Table on France - Market size and forecast 2024-2029 ($ million)
- Exhibits147: Chart on France - Year-over-year growth 2024-2029 (%)
- Exhibits148: Data Table on France - Year-over-year growth 2024-2029 (%)
- Exhibits149: Chart on Japan - Market size and forecast 2024-2029 ($ million)
- Exhibits150: Data Table on Japan - Market size and forecast 2024-2029 ($ million)
- Exhibits151: Chart on Japan - Year-over-year growth 2024-2029 (%)
- Exhibits152: Data Table on Japan - Year-over-year growth 2024-2029 (%)
- Exhibits153: Chart on Italy - Market size and forecast 2024-2029 ($ million)
- Exhibits154: Data Table on Italy - Market size and forecast 2024-2029 ($ million)
- Exhibits155: Chart on Italy - Year-over-year growth 2024-2029 (%)
- Exhibits156: Data Table on Italy - Year-over-year growth 2024-2029 (%)
- Exhibits157: Chart on South Korea - Market size and forecast 2024-2029 ($ million)
- Exhibits158: Data Table on South Korea - Market size and forecast 2024-2029 ($ million)
- Exhibits159: Chart on South Korea - Year-over-year growth 2024-2029 (%)
- Exhibits160: Data Table on South Korea - Year-over-year growth 2024-2029 (%)
- Exhibits161: Chart on India - Market size and forecast 2024-2029 ($ million)
- Exhibits162: Data Table on India - Market size and forecast 2024-2029 ($ million)
- Exhibits163: Chart on India - Year-over-year growth 2024-2029 (%)
- Exhibits164: Data Table on India - Year-over-year growth 2024-2029 (%)
- Exhibits165: Market opportunity By Geographical Landscape ($ million)
- Exhibits166: Data Tables on Market opportunity By Geographical Landscape ($ million)
- Exhibits167: Impact of drivers and challenges in 2024 and 2029
- Exhibits168: Overview on criticality of inputs and factors of differentiation
- Exhibits169: Overview on factors of disruption
- Exhibits170: Impact of key risks on business
- Exhibits171: Companies covered
- Exhibits172: Company ranking index
- Exhibits173: Matrix on companies position and classification
- Exhibits174: Acer Inc. - Overview
- Exhibits175: Acer Inc. - Business segments
- Exhibits176: Acer Inc. - Key news
- Exhibits177: Acer Inc. - Key offerings
- Exhibits178: Acer Inc. - Segment focus
- Exhibits179: SWOT
- Exhibits180: Apple Inc. - Overview
- Exhibits181: Apple Inc. - Business segments
- Exhibits182: Apple Inc. - Key news
- Exhibits183: Apple Inc. - Key offerings
- Exhibits184: Apple Inc. - Segment focus
- Exhibits185: SWOT
- Exhibits186: ASUSTeK Computer Inc. - Overview
- Exhibits187: ASUSTeK Computer Inc. - Product / Service
- Exhibits188: ASUSTeK Computer Inc. - Key news
- Exhibits189: ASUSTeK Computer Inc. - Key offerings
- Exhibits190: SWOT
- Exhibits191: Cisco Systems Inc. - Overview
- Exhibits192: Cisco Systems Inc. - Business segments
- Exhibits193: Cisco Systems Inc. - Key news
- Exhibits194: Cisco Systems Inc. - Key offerings
- Exhibits195: Cisco Systems Inc. - Segment focus
- Exhibits196: SWOT
- Exhibits197: Dell Technologies Inc. - Overview
- Exhibits198: Dell Technologies Inc. - Business segments
- Exhibits199: Dell Technologies Inc. - Key news
- Exhibits200: Dell Technologies Inc. - Key offerings
- Exhibits201: Dell Technologies Inc. - Segment focus
- Exhibits202: SWOT
- Exhibits203: Fujitsu Ltd. - Overview
- Exhibits204: Fujitsu Ltd. - Business segments
- Exhibits205: Fujitsu Ltd. - Key news
- Exhibits206: Fujitsu Ltd. - Key offerings
- Exhibits207: Fujitsu Ltd. - Segment focus
- Exhibits208: SWOT
- Exhibits209: Hewlett Packard Enterprise Co. - Overview
- Exhibits210: Hewlett Packard Enterprise Co. - Business segments
- Exhibits211: Hewlett Packard Enterprise Co. - Key news
- Exhibits212: Hewlett Packard Enterprise Co. - Key offerings
- Exhibits213: Hewlett Packard Enterprise Co. - Segment focus
- Exhibits214: SWOT
- Exhibits215: Hitachi Ltd. - Overview
- Exhibits216: Hitachi Ltd. - Business segments
- Exhibits217: Hitachi Ltd. - Key news
- Exhibits218: Hitachi Ltd. - Key offerings
- Exhibits219: Hitachi Ltd. - Segment focus
- Exhibits220: SWOT
- Exhibits221: Huawei Technologies Co. Ltd. - Overview
- Exhibits222: Huawei Technologies Co. Ltd. - Product / Service
- Exhibits223: Huawei Technologies Co. Ltd. - Key news
- Exhibits224: Huawei Technologies Co. Ltd. - Key offerings
- Exhibits225: SWOT
- Exhibits226: International Business Machines Corp. - Overview
- Exhibits227: International Business Machines Corp. - Business segments
- Exhibits228: International Business Machines Corp. - Key news
- Exhibits229: International Business Machines Corp. - Key offerings
- Exhibits230: International Business Machines Corp. - Segment focus
- Exhibits231: SWOT
- Exhibits232: Oracle Corp. - Overview
- Exhibits233: Oracle Corp. - Business segments
- Exhibits234: Oracle Corp. - Key news
- Exhibits235: Oracle Corp. - Key offerings
- Exhibits236: Oracle Corp. - Segment focus
- Exhibits237: SWOT
- Exhibits238: SAP SE - Overview
- Exhibits239: SAP SE - Business segments
- Exhibits240: SAP SE - Key news
- Exhibits241: SAP SE - Key offerings
- Exhibits242: SAP SE - Segment focus
- Exhibits243: SWOT
- Exhibits244: Super Micro Computer Inc. - Overview
- Exhibits245: Super Micro Computer Inc. - Business segments
- Exhibits246: Super Micro Computer Inc. - Key news
- Exhibits247: Super Micro Computer Inc. - Key offerings
- Exhibits248: Super Micro Computer Inc. - Segment focus
- Exhibits249: SWOT
- Exhibits250: Toshiba Corp. - Overview
- Exhibits251: Toshiba Corp. - Business segments
- Exhibits252: Toshiba Corp. - Key news
- Exhibits253: Toshiba Corp. - Key offerings
- Exhibits254: Toshiba Corp. - Segment focus
- Exhibits255: SWOT
- Exhibits256: Unisys Corp. - Overview
- Exhibits257: Unisys Corp. - Business segments
- Exhibits258: Unisys Corp. - Key news
- Exhibits259: Unisys Corp. - Key offerings
- Exhibits260: Unisys Corp. - Segment focus
- Exhibits261: SWOT
- Exhibits262: Inclusions checklist
- Exhibits263: Exclusions checklist
- Exhibits264: Currency conversion rates for US$
- Exhibits265: Research methodology
- Exhibits266: Information sources
- Exhibits267: Data validation
- Exhibits268: Validation techniques employed for market sizing
- Exhibits269: Data synthesis
- Exhibits270: 360 degree market analysis
- Exhibits271: List of abbreviations
The high end server market is forecasted to grow by USD 84,648.5 mn during 2024-2029, accelerating at a CAGR of 26% during the forecast period. The report on the high end server market provides a holistic analysis, market size and forecast, trends, growth drivers, and challenges, as well as vendor analysis covering around 25 vendors.
The report offers an up-to-date analysis regarding the current market scenario, the latest trends and drivers, and the overall market environment. The market is driven by growing need for edge computing, growing penetration of iot-enabled devices, and increasing demand for artificial intelligence (AI).
| Market Scope | |
|---|---|
| Base Year | 2025 |
| End Year | 2029 |
| Series Year | 2025-2029 |
| Growth Momentum | Accelerate |
| YOY 2025 | 19.5% |
| CAGR | 26% |
| Incremental Value | $84,648.5 mn |
The study was conducted using an objective combination of primary and secondary information including inputs from key participants in the industry. The report contains a comprehensive market size data, segment with regional analysis and vendor landscape in addition to an analysis of the key companies. Reports have historic and forecast data.
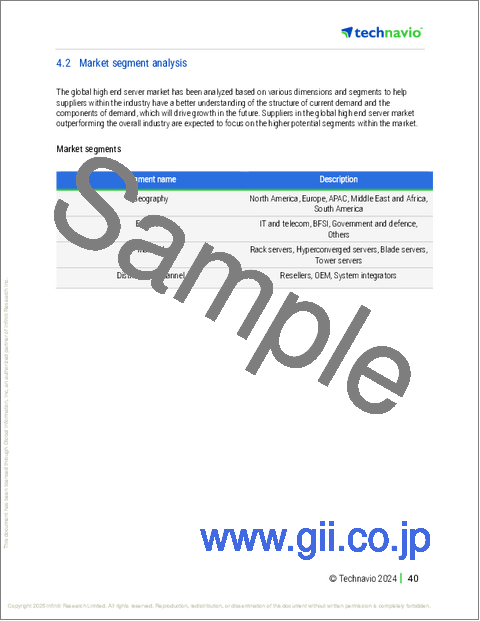
Technavio's high end server market is segmented as below:
By End-user
- IT and telecom
- BFSI
- Government and defence
- Others
By Distribution Channel
- Resellers
- OEM
- System integrators
By Material
- Rack servers
- Hyperconverged servers
- Blade servers
- Tower servers
By Geographical Landscape
- North America
- Europe
- APAC
- Middle East and Africa
- South America
This study identifies the hyper-converged infrastructure as one of the prime reasons driving the high end server market growth during the next few years. Also, increasing demand for high-performance computing in various data-intensive industries and growing inclination of industries towards AI and machine learning-enabled capabilities will lead to sizable demand in the market.
The report on the high end server market covers the following areas:
- High End Server Market sizing
- High End Server Market forecast
- High End Server Market industry analysis
The robust vendor analysis is designed to help clients improve their market position, and in line with this, this report provides a detailed analysis of several leading high end server market vendors that include Acer Inc., Apple Inc., ASUSTeK Computer Inc., Cisco Systems Inc., Dell Technologies Inc., Fujitsu Ltd., Gigabyte Technology Co. Ltd., Hewlett Packard Enterprise Co., Hitachi Ltd., Huawei Technologies Co. Ltd., International Business Machines Corp., Lenovo Group Ltd., Microsoft Corp., NCR Voyix Corp., NEC Corp., Oracle Corp., SAP SE, Super Micro Computer Inc., Toshiba Corp., and Unisys Corp.. Also, the high end server market analysis report includes information on upcoming trends and challenges that will influence market growth. This is to help companies strategize and leverage all forthcoming growth opportunities.
The publisher presents a detailed picture of the market by the way of study, synthesis, and summation of data from multiple sources by an analysis of key parameters such as profit, pricing, competition, and promotions. It presents various market facets by identifying the key industry influencers. The data presented is comprehensive, reliable, and a result of extensive primary and secondary research. The market research reports provide a complete competitive landscape and an in-depth vendor selection methodology and analysis using qualitative and quantitative research to forecast accurate market growth.
Table of Contents
1 Executive Summary
- 1.1 Market overview
- Executive Summary - Chart on Market Overview
- Executive Summary - Data Table on Market Overview
- Executive Summary - Chart on Global Market Characteristics
- Executive Summary - Chart on Market By Geographical Landscape
- Executive Summary - Chart on Market Segmentation by End-user
- Executive Summary - Chart on Market Segmentation by Distribution Channel
- Executive Summary - Chart on Market Segmentation by Material
- Executive Summary - Chart on Incremental Growth
- Executive Summary - Data Table on Incremental Growth
- Executive Summary - Chart on Company Market Positioning
2 Technavio Analysis
- 2.1 Analysis of price sensitivity, lifecycle, customer purchase basket, adoption rates, and purchase criteria
- Analysis of price sensitivity, lifecycle, customer purchase basket, adoption rates, and purchase criteria
- 2.2 Criticality of inputs and Factors of differentiation
- Overview on criticality of inputs and factors of differentiation
- 2.3 Factors of disruption
- Overview on factors of disruption
- 2.4 Impact of drivers and challenges
- Impact of drivers and challenges in 2024 and 2029
3 Market Landscape
- 3.1 Market ecosystem
- Parent Market
- Data Table on - Parent Market
- 3.2 Market characteristics
- Market characteristics analysis
- 3.3 Value chain analysis
- Value chain analysis
4 Market Sizing
- 4.1 Market definition
- Offerings of companies included in the market definition
- 4.2 Market segment analysis
- Market segments
- 4.3 Market size 2024
- 4.4 Market outlook: Forecast for 2024-2029
- Chart on Global - Market size and forecast 2024-2029 ($ million)
- Data Table on Global - Market size and forecast 2024-2029 ($ million)
- Chart on Global Market: Year-over-year growth 2024-2029 (%)
- Data Table on Global Market: Year-over-year growth 2024-2029 (%)
5 Historic Market Size
- 5.1 Global High End Server Market 2019 - 2023
- Historic Market Size - Data Table on Global High End Server Market 2019 - 2023 ($ million)
- 5.2 End-user segment analysis 2019 - 2023
- Historic Market Size - End-user Segment 2019 - 2023 ($ million)
- 5.3 Distribution Channel segment analysis 2019 - 2023
- Historic Market Size - Distribution Channel Segment 2019 - 2023 ($ million)
- 5.4 Material segment analysis 2019 - 2023
- Historic Market Size - Material Segment 2019 - 2023 ($ million)
- 5.5 Geography segment analysis 2019 - 2023
- Historic Market Size - Geography Segment 2019 - 2023 ($ million)
- 5.6 Country segment analysis 2019 - 2023
- Historic Market Size - Country Segment 2019 - 2023 ($ million)
6 Qualitative Analysis
- 6.1 The AI impact on Global High End Server Market
7 Five Forces Analysis
- 7.1 Five forces summary
- Five forces analysis - Comparison between 2024 and 2029
- 7.2 Bargaining power of buyers
- Bargaining power of buyers - Impact of key factors 2024 and 2029
- 7.3 Bargaining power of suppliers
- Bargaining power of suppliers - Impact of key factors in 2024 and 2029
- 7.4 Threat of new entrants
- Threat of new entrants - Impact of key factors in 2024 and 2029
- 7.5 Threat of substitutes
- Threat of substitutes - Impact of key factors in 2024 and 2029
- 7.6 Threat of rivalry
- Threat of rivalry - Impact of key factors in 2024 and 2029
- 7.7 Market condition
- Chart on Market condition - Five forces 2024 and 2029
8 Market Segmentation by End-user
- 8.1 Market segments
- Chart on End-user - Market share 2024-2029 (%)
- Data Table on End-user - Market share 2024-2029 (%)
- 8.2 Comparison by End-user
- Chart on Comparison by End-user
- Data Table on Comparison by End-user
- 8.3 IT and telecom - Market size and forecast 2024-2029
- Chart on IT and telecom - Market size and forecast 2024-2029 ($ million)
- Data Table on IT and telecom - Market size and forecast 2024-2029 ($ million)
- Chart on IT and telecom - Year-over-year growth 2024-2029 (%)
- Data Table on IT and telecom - Year-over-year growth 2024-2029 (%)
- 8.4 BFSI - Market size and forecast 2024-2029
- Chart on BFSI - Market size and forecast 2024-2029 ($ million)
- Data Table on BFSI - Market size and forecast 2024-2029 ($ million)
- Chart on BFSI - Year-over-year growth 2024-2029 (%)
- Data Table on BFSI - Year-over-year growth 2024-2029 (%)
- 8.5 Government and defence - Market size and forecast 2024-2029
- Chart on Government and defence - Market size and forecast 2024-2029 ($ million)
- Data Table on Government and defence - Market size and forecast 2024-2029 ($ million)
- Chart on Government and defence - Year-over-year growth 2024-2029 (%)
- Data Table on Government and defence - Year-over-year growth 2024-2029 (%)
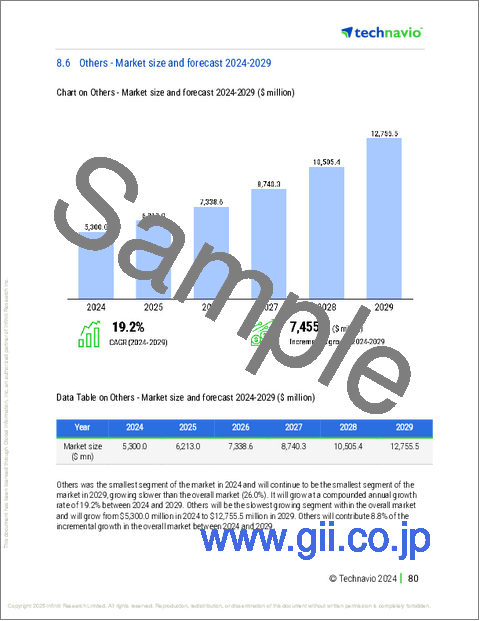
- 8.6 Others - Market size and forecast 2024-2029
- Chart on Others - Market size and forecast 2024-2029 ($ million)
- Data Table on Others - Market size and forecast 2024-2029 ($ million)
- Chart on Others - Year-over-year growth 2024-2029 (%)
- Data Table on Others - Year-over-year growth 2024-2029 (%)
- 8.7 Market opportunity by End-user
- Market opportunity by End-user ($ million)
- Data Table on Market opportunity by End-user ($ million)
9 Market Segmentation by Distribution Channel
- 9.1 Market segments
- Chart on Distribution Channel - Market share 2024-2029 (%)
- Data Table on Distribution Channel - Market share 2024-2029 (%)
- 9.2 Comparison by Distribution Channel
- Chart on Comparison by Distribution Channel
- Data Table on Comparison by Distribution Channel
- 9.3 Resellers - Market size and forecast 2024-2029
- Chart on Resellers - Market size and forecast 2024-2029 ($ million)
- Data Table on Resellers - Market size and forecast 2024-2029 ($ million)
- Chart on Resellers - Year-over-year growth 2024-2029 (%)
- Data Table on Resellers - Year-over-year growth 2024-2029 (%)
- 9.4 OEM - Market size and forecast 2024-2029
- Chart on OEM - Market size and forecast 2024-2029 ($ million)
- Data Table on OEM - Market size and forecast 2024-2029 ($ million)
- Chart on OEM - Year-over-year growth 2024-2029 (%)
- Data Table on OEM - Year-over-year growth 2024-2029 (%)
- 9.5 System integrators - Market size and forecast 2024-2029
- Chart on System integrators - Market size and forecast 2024-2029 ($ million)
- Data Table on System integrators - Market size and forecast 2024-2029 ($ million)
- Chart on System integrators - Year-over-year growth 2024-2029 (%)
- Data Table on System integrators - Year-over-year growth 2024-2029 (%)
- 9.6 Market opportunity by Distribution Channel
- Market opportunity by Distribution Channel ($ million)
- Data Table on Market opportunity by Distribution Channel ($ million)
10 Market Segmentation by Material
- 10.1 Market segments
- Chart on Material - Market share 2024-2029 (%)
- Data Table on Material - Market share 2024-2029 (%)
- 10.2 Comparison by Material
- Chart on Comparison by Material
- Data Table on Comparison by Material
- 10.3 Rack servers - Market size and forecast 2024-2029
- Chart on Rack servers - Market size and forecast 2024-2029 ($ million)
- Data Table on Rack servers - Market size and forecast 2024-2029 ($ million)
- Chart on Rack servers - Year-over-year growth 2024-2029 (%)
- Data Table on Rack servers - Year-over-year growth 2024-2029 (%)
- 10.4 Hyperconverged servers - Market size and forecast 2024-2029
- Chart on Hyperconverged servers - Market size and forecast 2024-2029 ($ million)
- Data Table on Hyperconverged servers - Market size and forecast 2024-2029 ($ million)
- Chart on Hyperconverged servers - Year-over-year growth 2024-2029 (%)
- Data Table on Hyperconverged servers - Year-over-year growth 2024-2029 (%)
- 10.5 Blade servers - Market size and forecast 2024-2029
- Chart on Blade servers - Market size and forecast 2024-2029 ($ million)
- Data Table on Blade servers - Market size and forecast 2024-2029 ($ million)
- Chart on Blade servers - Year-over-year growth 2024-2029 (%)
- Data Table on Blade servers - Year-over-year growth 2024-2029 (%)
- 10.6 Tower servers - Market size and forecast 2024-2029
- Chart on Tower servers - Market size and forecast 2024-2029 ($ million)
- Data Table on Tower servers - Market size and forecast 2024-2029 ($ million)
- Chart on Tower servers - Year-over-year growth 2024-2029 (%)
- Data Table on Tower servers - Year-over-year growth 2024-2029 (%)
- 10.7 Market opportunity by Material
- Market opportunity by Material ($ million)
- Data Table on Market opportunity by Material ($ million)
11 Customer Landscape
- 11.1 Customer landscape overview
- Analysis of price sensitivity, lifecycle, customer purchase basket, adoption rates, and purchase criteria
12 Geographic Landscape
- 12.1 Geographic segmentation
- Chart on Market share By Geographical Landscape 2024-2029 (%)
- Data Table on Market share By Geographical Landscape 2024-2029 (%)
- 12.2 Geographic comparison
- Chart on Geographic comparison
- Data Table on Geographic comparison
- 12.3 North America - Market size and forecast 2024-2029
- Chart on North America - Market size and forecast 2024-2029 ($ million)
- Data Table on North America - Market size and forecast 2024-2029 ($ million)
- Chart on North America - Year-over-year growth 2024-2029 (%)
- Data Table on North America - Year-over-year growth 2024-2029 (%)
- 12.4 Europe - Market size and forecast 2024-2029
- Chart on Europe - Market size and forecast 2024-2029 ($ million)
- Data Table on Europe - Market size and forecast 2024-2029 ($ million)
- Chart on Europe - Year-over-year growth 2024-2029 (%)
- Data Table on Europe - Year-over-year growth 2024-2029 (%)
- 12.5 APAC - Market size and forecast 2024-2029
- Chart on APAC - Market size and forecast 2024-2029 ($ million)
- Data Table on APAC - Market size and forecast 2024-2029 ($ million)
- Chart on APAC - Year-over-year growth 2024-2029 (%)
- Data Table on APAC - Year-over-year growth 2024-2029 (%)
- 12.6 Middle East and Africa - Market size and forecast 2024-2029
- Chart on Middle East and Africa - Market size and forecast 2024-2029 ($ million)
- Data Table on Middle East and Africa - Market size and forecast 2024-2029 ($ million)
- Chart on Middle East and Africa - Year-over-year growth 2024-2029 (%)
- Data Table on Middle East and Africa - Year-over-year growth 2024-2029 (%)
- 12.7 South America - Market size and forecast 2024-2029
- Chart on South America - Market size and forecast 2024-2029 ($ million)
- Data Table on South America - Market size and forecast 2024-2029 ($ million)
- Chart on South America - Year-over-year growth 2024-2029 (%)
- Data Table on South America - Year-over-year growth 2024-2029 (%)
- 12.8 US - Market size and forecast 2024-2029
- Chart on US - Market size and forecast 2024-2029 ($ million)
- Data Table on US - Market size and forecast 2024-2029 ($ million)
- Chart on US - Year-over-year growth 2024-2029 (%)
- Data Table on US - Year-over-year growth 2024-2029 (%)
- 12.9 China - Market size and forecast 2024-2029
- Chart on China - Market size and forecast 2024-2029 ($ million)
- Data Table on China - Market size and forecast 2024-2029 ($ million)
- Chart on China - Year-over-year growth 2024-2029 (%)
- Data Table on China - Year-over-year growth 2024-2029 (%)
- 12.10 Germany - Market size and forecast 2024-2029
- Chart on Germany - Market size and forecast 2024-2029 ($ million)
- Data Table on Germany - Market size and forecast 2024-2029 ($ million)
- Chart on Germany - Year-over-year growth 2024-2029 (%)
- Data Table on Germany - Year-over-year growth 2024-2029 (%)
- 12.11 Canada - Market size and forecast 2024-2029
- Chart on Canada - Market size and forecast 2024-2029 ($ million)
- Data Table on Canada - Market size and forecast 2024-2029 ($ million)
- Chart on Canada - Year-over-year growth 2024-2029 (%)
- Data Table on Canada - Year-over-year growth 2024-2029 (%)
- 12.12 UK - Market size and forecast 2024-2029
- Chart on UK - Market size and forecast 2024-2029 ($ million)
- Data Table on UK - Market size and forecast 2024-2029 ($ million)
- Chart on UK - Year-over-year growth 2024-2029 (%)
- Data Table on UK - Year-over-year growth 2024-2029 (%)
- 12.13 France - Market size and forecast 2024-2029
- Chart on France - Market size and forecast 2024-2029 ($ million)
- Data Table on France - Market size and forecast 2024-2029 ($ million)
- Chart on France - Year-over-year growth 2024-2029 (%)
- Data Table on France - Year-over-year growth 2024-2029 (%)
- 12.14 Japan - Market size and forecast 2024-2029
- Chart on Japan - Market size and forecast 2024-2029 ($ million)
- Data Table on Japan - Market size and forecast 2024-2029 ($ million)
- Chart on Japan - Year-over-year growth 2024-2029 (%)
- Data Table on Japan - Year-over-year growth 2024-2029 (%)
- 12.15 Italy - Market size and forecast 2024-2029
- Chart on Italy - Market size and forecast 2024-2029 ($ million)
- Data Table on Italy - Market size and forecast 2024-2029 ($ million)
- Chart on Italy - Year-over-year growth 2024-2029 (%)
- Data Table on Italy - Year-over-year growth 2024-2029 (%)
- 12.16 South Korea - Market size and forecast 2024-2029
- Chart on South Korea - Market size and forecast 2024-2029 ($ million)
- Data Table on South Korea - Market size and forecast 2024-2029 ($ million)
- Chart on South Korea - Year-over-year growth 2024-2029 (%)
- Data Table on South Korea - Year-over-year growth 2024-2029 (%)
- 12.17 India - Market size and forecast 2024-2029
- Chart on India - Market size and forecast 2024-2029 ($ million)
- Data Table on India - Market size and forecast 2024-2029 ($ million)
- Chart on India - Year-over-year growth 2024-2029 (%)
- Data Table on India - Year-over-year growth 2024-2029 (%)
- 12.18 Market opportunity By Geographical Landscape
- Market opportunity By Geographical Landscape ($ million)
- Data Tables on Market opportunity By Geographical Landscape ($ million)
13 Drivers, Challenges, and Opportunity/Restraints
- 13.1 Market drivers
- 13.2 Market challenges
- 13.3 Impact of drivers and challenges
- Impact of drivers and challenges in 2024 and 2029
- 13.4 Market opportunities/restraints
14 Competitive Landscape
- 14.1 Overview
- 14.2 Competitive Landscape
- Overview on criticality of inputs and factors of differentiation
- 14.3 Landscape disruption
- Overview on factors of disruption
- 14.4 Industry risks
- Impact of key risks on business
15 Competitive Analysis
- 15.1 Companies profiled
- Companies covered
- 15.2 Company ranking index
- Company ranking index
- 15.3 Market positioning of companies
- Matrix on companies position and classification
- 15.4 Acer Inc.
- Acer Inc. - Overview
- Acer Inc. - Business segments
- Acer Inc. - Key news
- Acer Inc. - Key offerings
- Acer Inc. - Segment focus
- SWOT
- 15.5 Apple Inc.
- Apple Inc. - Overview
- Apple Inc. - Business segments
- Apple Inc. - Key news
- Apple Inc. - Key offerings
- Apple Inc. - Segment focus
- SWOT
- 15.6 ASUSTeK Computer Inc.
- ASUSTeK Computer Inc. - Overview
- ASUSTeK Computer Inc. - Product / Service
- ASUSTeK Computer Inc. - Key news
- ASUSTeK Computer Inc. - Key offerings
- SWOT
- 15.7 Cisco Systems Inc.
- Cisco Systems Inc. - Overview
- Cisco Systems Inc. - Business segments
- Cisco Systems Inc. - Key news
- Cisco Systems Inc. - Key offerings
- Cisco Systems Inc. - Segment focus
- SWOT
- 15.8 Dell Technologies Inc.
- Dell Technologies Inc. - Overview
- Dell Technologies Inc. - Business segments
- Dell Technologies Inc. - Key news
- Dell Technologies Inc. - Key offerings
- Dell Technologies Inc. - Segment focus
- SWOT
- 15.9 Fujitsu Ltd.
- Fujitsu Ltd. - Overview
- Fujitsu Ltd. - Business segments
- Fujitsu Ltd. - Key news
- Fujitsu Ltd. - Key offerings
- Fujitsu Ltd. - Segment focus
- SWOT
- 15.10 Hewlett Packard Enterprise Co.
- Hewlett Packard Enterprise Co. - Overview
- Hewlett Packard Enterprise Co. - Business segments
- Hewlett Packard Enterprise Co. - Key news
- Hewlett Packard Enterprise Co. - Key offerings
- Hewlett Packard Enterprise Co. - Segment focus
- SWOT
- 15.11 Hitachi Ltd.
- Hitachi Ltd. - Overview
- Hitachi Ltd. - Business segments
- Hitachi Ltd. - Key news
- Hitachi Ltd. - Key offerings
- Hitachi Ltd. - Segment focus
- SWOT
- 15.12 Huawei Technologies Co. Ltd.
- Huawei Technologies Co. Ltd. - Overview
- Huawei Technologies Co. Ltd. - Product / Service
- Huawei Technologies Co. Ltd. - Key news
- Huawei Technologies Co. Ltd. - Key offerings
- SWOT
- 15.13 International Business Machines Corp.
- International Business Machines Corp. - Overview
- International Business Machines Corp. - Business segments
- International Business Machines Corp. - Key news
- International Business Machines Corp. - Key offerings
- International Business Machines Corp. - Segment focus
- SWOT
- 15.14 Oracle Corp.
- Oracle Corp. - Overview
- Oracle Corp. - Business segments
- Oracle Corp. - Key news
- Oracle Corp. - Key offerings
- Oracle Corp. - Segment focus
- SWOT
- 15.15 SAP SE
- SAP SE - Overview
- SAP SE - Business segments
- SAP SE - Key news
- SAP SE - Key offerings
- SAP SE - Segment focus
- SWOT
- 15.16 Super Micro Computer Inc.
- Super Micro Computer Inc. - Overview
- Super Micro Computer Inc. - Business segments
- Super Micro Computer Inc. - Key news
- Super Micro Computer Inc. - Key offerings
- Super Micro Computer Inc. - Segment focus
- SWOT
- 15.17 Toshiba Corp.
- Toshiba Corp. - Overview
- Toshiba Corp. - Business segments
- Toshiba Corp. - Key news
- Toshiba Corp. - Key offerings
- Toshiba Corp. - Segment focus
- SWOT
- 15.18 Unisys Corp.
- Unisys Corp. - Overview
- Unisys Corp. - Business segments
- Unisys Corp. - Key news
- Unisys Corp. - Key offerings
- Unisys Corp. - Segment focus
- SWOT
16 Appendix
- 16.1 Scope of the report
- 16.2 Inclusions and exclusions checklist
- Inclusions checklist
- Exclusions checklist
- 16.3 Currency conversion rates for US$
- Currency conversion rates for US$
- 16.4 Research methodology
- Research methodology
- 16.5 Data procurement
- Information sources
- 16.6 Data validation
- Data validation
- 16.7 Validation techniques employed for market sizing
- Validation techniques employed for market sizing
- 16.8 Data synthesis
- Data synthesis
- 16.9 360 degree market analysis
- 360 degree market analysis
- 16.10 List of abbreviations
- List of abbreviations

