|
|
市場調査レポート
商品コード
1756567
ヘルスケアにおけるIoTの世界市場 2025年~2029年Global Internet of Things in Healthcare Market 2025-2029 |
||||||

|
|||||||
カスタマイズ可能
|
|||||||


| ヘルスケアにおけるIoTの世界市場 2025年~2029年 |
|
出版日: 2025年06月12日
発行: TechNavio
ページ情報: 英文 245 Pages
納期: 即納可能
|

全表示
- 概要
- 図表
- 目次
ヘルスケアにおけるIoT市場は、2024年から2029年にかけて2,979億米ドル、予測期間中のCAGRは18.4%で成長すると予測されます。
当レポートでは、ヘルスケアにおけるIoT市場について、全体的な分析、市場規模・予測、動向、成長促進要因、課題、約25のベンダーを網羅したベンダー分析などを掲載しています。
現在の市場シナリオ、最新動向と促進要因、市場環境全体に関する最新分析を提供しています。市場は、遠隔患者モニタリングの増加、人の健康状態をモニタリングするためのウェアラブル使用の増加、IoT対応デバイスによるヘルスケア管理の改善によって牽引されています。
| 市場範囲 | |
|---|---|
| 基準年 | 2025 |
| 終了年 | 2029 |
| 予測期間 | 2025-2029 |
| 成長モメンタム | 加速 |
| 前年比 | 15.8% |
| CAGR | 18.4% |
| 増分額 | 2,979億米ドル |
本調査は、業界の主要参加者からのインプットを含め、一次情報と二次情報を客観的に組み合わせて実施しました。本レポートには、主要企業の分析に加え、包括的な市場規模データ、地域分析によるセグメント、ベンダー情勢が含まれています。レポートには過去データと予測データがあります。
本調査では、ヘルスケア分野における技術の進歩が、今後数年間のヘルスケアにおけるIoT市場の成長を促進する主要な理由の1つであると特定しています。また、スマートホスピタルの出現と遠隔医療への需要の高まりは、市場の大きな需要につながります。
目次
第1章 エグゼクティブサマリー
- 市場概要
第2章 Technavio分析
- 価格・ライフサイクル・顧客購入バスケット・採用率・購入基準の分析
- インプットの重要性と差別化の要因
- 混乱の要因
- 促進要因と課題の影響
第3章 市場情勢
- 市場エコシステム
- 市場の特徴
- バリューチェーン分析
第4章 市場規模
- 市場の定義
- 市場セグメント分析
- 市場規模 2024
- 市場の見通し 2024年~2029年
第5章 市場規模実績
- ヘルスケアにおけるIoT世界市場 2019年~2023年
- タイプ別セグメント分析 2019年~2023年
- 用途別セグメント分析 2019年~2023年
- エンドユーザー別セグメント分析 2019年~2023年
- 地域別セグメント分析 2019年~2023年
- 国別セグメント分析 2019年~2023年
第6章 定性分析
- AIの影響:ヘルスケアにおけるIoT世界市場
第7章 ファイブフォース分析
- ファイブフォースの要約
- 買い手の交渉力
- 供給企業の交渉力
- 新規参入業者の脅威
- 代替品の脅威
- 競争の脅威
- 市況
第8章 市場セグメンテーション:タイプ別
- 市場セグメント
- 比較:タイプ別
- 医療機器:市場規模と予測 2024年~2029年
- ソフトウェアおよびシステムアプリケーション:市場規模と予測 2024年~2029年
- テクノロジーをつなぐ:市場規模と予測 2024年~2029年
- 市場機会:タイプ別
第9章 市場セグメンテーション:用途別
- 市場セグメント
- 比較:用途別
- 遠隔医療:市場規模と予測 2024年~2029年
- 患者モニタリング:市場規模と予測 2024年~2029年
- 臨床業務とワークフロー管理:市場規模と予測 2024年~2029年
- その他:市場規模と予測 2024年~2029年
- 市場機会:用途別
第10章 市場セグメンテーション:エンドユーザー別
- 市場セグメント
- 比較:エンドユーザー別
- 病院と診療所:市場規模と予測 2024年~2029年
- 製薬およびバイオテクノロジー企業:市場規模と予測 2024年~2029年
- 政府および防衛機関:市場規模と予測 2024年~2029年
- 臨床調査機関:市場規模と予測 2024年~2029年
- その他:市場規模と予測 2024年~2029年
- 市場機会:エンドユーザー別
第11章 顧客情勢
- 顧客情勢の概要
第12章 地域別情勢
- 地域別セグメンテーション
- 地域別比較
- 北米:市場規模と予測 2024年~2029年
- 欧州:市場規模と予測 2024年~2029年
- アジア太平洋:市場規模と予測 2024年~2029年
- 南米:市場規模と予測 2024年~2029年
- 中東・アフリカ:市場規模と予測 2024年~2029年
- 米国:市場規模と予測 2024年~2029年
- カナダ:市場規模と予測 2024年~2029年
- ドイツ:市場規模と予測 2024年~2029年
- 中国:市場規模と予測 2024年~2029年
- 英国:市場規模と予測 2024年~2029年
- フランス:市場規模と予測 2024年~2029年
- メキシコ:市場規模と予測 2024年~2029年
- インド:市場規模と予測 2024年~2029年
- ブラジル:市場規模と予測 2024年~2029年
- 日本:市場規模と予測 2024年~2029年
- 市場機会:地域情勢別
第13章 促進要因・課題・機会・抑制要因
- 市場促進要因
- 市場の課題
- 促進要因と課題の影響
- 市場の機会・抑制要因
第14章 競合情勢
- 概要
- 競合情勢
- 混乱の状況
- 業界のリスク
第15章 競合分析
- 企業プロファイル
- 企業ランキング指数
- 企業の市場ポジショニング
- Alphabet Inc.
- Amazon.com Inc.
- AT and T Inc.
- Cisco Systems Inc.
- Furukawa Electric Co. Ltd.
- General Electric Co.
- Honeywell International Inc.
- Intel Corp.
- International Business Machines Corp.
- Microsoft Corp.
- Oracle Corp.
- Robert Bosch GmbH
- SAP SE
- Siemens AG
- Wipro Ltd.
第16章 付録
Exhibits:
- Exhibits1: Executive Summary - Chart on Market Overview
- Exhibits2: Executive Summary - Data Table on Market Overview
- Exhibits3: Executive Summary - Chart on Global Market Characteristics
- Exhibits4: Executive Summary - Chart on Market By Geographical Landscape
- Exhibits5: Executive Summary - Chart on Market Segmentation by Type
- Exhibits6: Executive Summary - Chart on Market Segmentation by Application
- Exhibits7: Executive Summary - Chart on Market Segmentation by End-user
- Exhibits8: Executive Summary - Chart on Incremental Growth
- Exhibits9: Executive Summary - Data Table on Incremental Growth
- Exhibits10: Executive Summary - Chart on Company Market Positioning
- Exhibits11: Analysis of price sensitivity, lifecycle, customer purchase basket, adoption rates, and purchase criteria
- Exhibits12: Overview on criticality of inputs and factors of differentiation
- Exhibits13: Overview on factors of disruption
- Exhibits14: Impact of drivers and challenges in 2024 and 2029
- Exhibits15: Parent Market
- Exhibits16: Data Table on - Parent Market
- Exhibits17: Market characteristics analysis
- Exhibits18: Value chain analysis
- Exhibits19: Offerings of companies included in the market definition
- Exhibits20: Market segments
- Exhibits21: Chart on Global - Market size and forecast 2024-2029 ($ billion)
- Exhibits22: Data Table on Global - Market size and forecast 2024-2029 ($ billion)
- Exhibits23: Chart on Global Market: Year-over-year growth 2024-2029 (%)
- Exhibits24: Data Table on Global Market: Year-over-year growth 2024-2029 (%)
- Exhibits25: Historic Market Size - Data Table on Global Internet Of Things In Healthcare Market 2019 - 2023 ($ billion)
- Exhibits26: Historic Market Size - Type Segment 2019 - 2023 ($ billion)
- Exhibits27: Historic Market Size - Application Segment 2019 - 2023 ($ billion)
- Exhibits28: Historic Market Size - End-user Segment 2019 - 2023 ($ billion)
- Exhibits29: Historic Market Size - Geography Segment 2019 - 2023 ($ billion)
- Exhibits30: Historic Market Size - Country Segment 2019 - 2023 ($ billion)
- Exhibits31: Five forces analysis - Comparison between 2024 and 2029
- Exhibits32: Bargaining power of buyers - Impact of key factors 2024 and 2029
- Exhibits33: Bargaining power of suppliers - Impact of key factors in 2024 and 2029
- Exhibits34: Threat of new entrants - Impact of key factors in 2024 and 2029
- Exhibits35: Threat of substitutes - Impact of key factors in 2024 and 2029
- Exhibits36: Threat of rivalry - Impact of key factors in 2024 and 2029
- Exhibits37: Chart on Market condition - Five forces 2024 and 2029
- Exhibits38: Chart on Type - Market share 2024-2029 (%)
- Exhibits39: Data Table on Type - Market share 2024-2029 (%)
- Exhibits40: Chart on Comparison by Type
- Exhibits41: Data Table on Comparison by Type
- Exhibits42: Chart on Medical devices - Market size and forecast 2024-2029 ($ billion)
- Exhibits43: Data Table on Medical devices - Market size and forecast 2024-2029 ($ billion)
- Exhibits44: Chart on Medical devices - Year-over-year growth 2024-2029 (%)
- Exhibits45: Data Table on Medical devices - Year-over-year growth 2024-2029 (%)
- Exhibits46: Chart on Software and system application - Market size and forecast 2024-2029 ($ billion)
- Exhibits47: Data Table on Software and system application - Market size and forecast 2024-2029 ($ billion)
- Exhibits48: Chart on Software and system application - Year-over-year growth 2024-2029 (%)
- Exhibits49: Data Table on Software and system application - Year-over-year growth 2024-2029 (%)
- Exhibits50: Chart on Connecting technologies - Market size and forecast 2024-2029 ($ billion)
- Exhibits51: Data Table on Connecting technologies - Market size and forecast 2024-2029 ($ billion)
- Exhibits52: Chart on Connecting technologies - Year-over-year growth 2024-2029 (%)
- Exhibits53: Data Table on Connecting technologies - Year-over-year growth 2024-2029 (%)
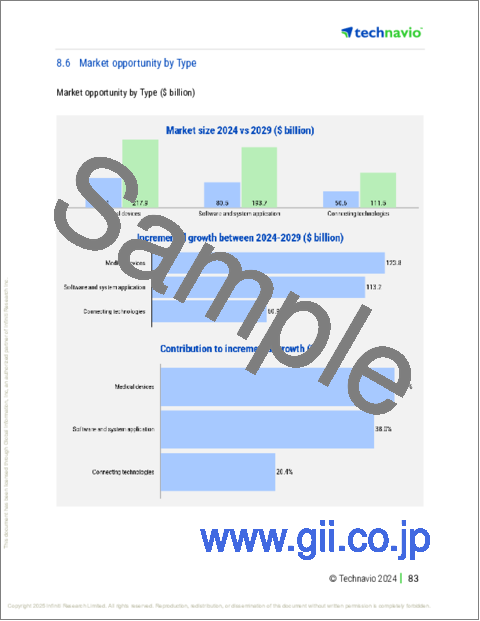
- Exhibits54: Market opportunity by Type ($ billion)
- Exhibits55: Data Table on Market opportunity by Type ($ billion)
- Exhibits56: Chart on Application - Market share 2024-2029 (%)
- Exhibits57: Data Table on Application - Market share 2024-2029 (%)
- Exhibits58: Chart on Comparison by Application
- Exhibits59: Data Table on Comparison by Application
- Exhibits60: Chart on Telemedicine - Market size and forecast 2024-2029 ($ billion)
- Exhibits61: Data Table on Telemedicine - Market size and forecast 2024-2029 ($ billion)
- Exhibits62: Chart on Telemedicine - Year-over-year growth 2024-2029 (%)
- Exhibits63: Data Table on Telemedicine - Year-over-year growth 2024-2029 (%)
- Exhibits64: Chart on Patient monitoring - Market size and forecast 2024-2029 ($ billion)
- Exhibits65: Data Table on Patient monitoring - Market size and forecast 2024-2029 ($ billion)
- Exhibits66: Chart on Patient monitoring - Year-over-year growth 2024-2029 (%)
- Exhibits67: Data Table on Patient monitoring - Year-over-year growth 2024-2029 (%)
- Exhibits68: Chart on Clinical operation and workflow management - Market size and forecast 2024-2029 ($ billion)
- Exhibits69: Data Table on Clinical operation and workflow management - Market size and forecast 2024-2029 ($ billion)
- Exhibits70: Chart on Clinical operation and workflow management - Year-over-year growth 2024-2029 (%)
- Exhibits71: Data Table on Clinical operation and workflow management - Year-over-year growth 2024-2029 (%)
- Exhibits72: Chart on Others - Market size and forecast 2024-2029 ($ billion)
- Exhibits73: Data Table on Others - Market size and forecast 2024-2029 ($ billion)
- Exhibits74: Chart on Others - Year-over-year growth 2024-2029 (%)
- Exhibits75: Data Table on Others - Year-over-year growth 2024-2029 (%)
- Exhibits76: Market opportunity by Application ($ billion)
- Exhibits77: Data Table on Market opportunity by Application ($ billion)
- Exhibits78: Chart on End-user - Market share 2024-2029 (%)
- Exhibits79: Data Table on End-user - Market share 2024-2029 (%)
- Exhibits80: Chart on Comparison by End-user
- Exhibits81: Data Table on Comparison by End-user
- Exhibits82: Chart on Hospitals and clinics - Market size and forecast 2024-2029 ($ billion)
- Exhibits83: Data Table on Hospitals and clinics - Market size and forecast 2024-2029 ($ billion)
- Exhibits84: Chart on Hospitals and clinics - Year-over-year growth 2024-2029 (%)
- Exhibits85: Data Table on Hospitals and clinics - Year-over-year growth 2024-2029 (%)
- Exhibits86: Chart on Pharmaceutical and biotechnology companies - Market size and forecast 2024-2029 ($ billion)
- Exhibits87: Data Table on Pharmaceutical and biotechnology companies - Market size and forecast 2024-2029 ($ billion)
- Exhibits88: Chart on Pharmaceutical and biotechnology companies - Year-over-year growth 2024-2029 (%)
- Exhibits89: Data Table on Pharmaceutical and biotechnology companies - Year-over-year growth 2024-2029 (%)
- Exhibits90: Chart on Government and defence institutions - Market size and forecast 2024-2029 ($ billion)
- Exhibits91: Data Table on Government and defence institutions - Market size and forecast 2024-2029 ($ billion)
- Exhibits92: Chart on Government and defence institutions - Year-over-year growth 2024-2029 (%)
- Exhibits93: Data Table on Government and defence institutions - Year-over-year growth 2024-2029 (%)
- Exhibits94: Chart on Clinical research organizations - Market size and forecast 2024-2029 ($ billion)
- Exhibits95: Data Table on Clinical research organizations - Market size and forecast 2024-2029 ($ billion)
- Exhibits96: Chart on Clinical research organizations - Year-over-year growth 2024-2029 (%)
- Exhibits97: Data Table on Clinical research organizations - Year-over-year growth 2024-2029 (%)
- Exhibits98: Chart on Others - Market size and forecast 2024-2029 ($ billion)
- Exhibits99: Data Table on Others - Market size and forecast 2024-2029 ($ billion)
- Exhibits100: Chart on Others - Year-over-year growth 2024-2029 (%)
- Exhibits101: Data Table on Others - Year-over-year growth 2024-2029 (%)
- Exhibits102: Market opportunity by End-user ($ billion)
- Exhibits103: Data Table on Market opportunity by End-user ($ billion)
- Exhibits104: Analysis of price sensitivity, lifecycle, customer purchase basket, adoption rates, and purchase criteria
- Exhibits105: Chart on Market share By Geographical Landscape 2024-2029 (%)
- Exhibits106: Data Table on Market share By Geographical Landscape 2024-2029 (%)
- Exhibits107: Chart on Geographic comparison
- Exhibits108: Data Table on Geographic comparison
- Exhibits109: Chart on North America - Market size and forecast 2024-2029 ($ billion)
- Exhibits110: Data Table on North America - Market size and forecast 2024-2029 ($ billion)
- Exhibits111: Chart on North America - Year-over-year growth 2024-2029 (%)
- Exhibits112: Data Table on North America - Year-over-year growth 2024-2029 (%)
- Exhibits113: Chart on Europe - Market size and forecast 2024-2029 ($ billion)
- Exhibits114: Data Table on Europe - Market size and forecast 2024-2029 ($ billion)
- Exhibits115: Chart on Europe - Year-over-year growth 2024-2029 (%)
- Exhibits116: Data Table on Europe - Year-over-year growth 2024-2029 (%)
- Exhibits117: Chart on APAC - Market size and forecast 2024-2029 ($ billion)
- Exhibits118: Data Table on APAC - Market size and forecast 2024-2029 ($ billion)
- Exhibits119: Chart on APAC - Year-over-year growth 2024-2029 (%)
- Exhibits120: Data Table on APAC - Year-over-year growth 2024-2029 (%)
- Exhibits121: Chart on South America - Market size and forecast 2024-2029 ($ billion)
- Exhibits122: Data Table on South America - Market size and forecast 2024-2029 ($ billion)
- Exhibits123: Chart on South America - Year-over-year growth 2024-2029 (%)
- Exhibits124: Data Table on South America - Year-over-year growth 2024-2029 (%)
- Exhibits125: Chart on Middle East and Africa - Market size and forecast 2024-2029 ($ billion)
- Exhibits126: Data Table on Middle East and Africa - Market size and forecast 2024-2029 ($ billion)
- Exhibits127: Chart on Middle East and Africa - Year-over-year growth 2024-2029 (%)
- Exhibits128: Data Table on Middle East and Africa - Year-over-year growth 2024-2029 (%)
- Exhibits129: Chart on US - Market size and forecast 2024-2029 ($ billion)
- Exhibits130: Data Table on US - Market size and forecast 2024-2029 ($ billion)
- Exhibits131: Chart on US - Year-over-year growth 2024-2029 (%)
- Exhibits132: Data Table on US - Year-over-year growth 2024-2029 (%)
- Exhibits133: Chart on Canada - Market size and forecast 2024-2029 ($ billion)
- Exhibits134: Data Table on Canada - Market size and forecast 2024-2029 ($ billion)
- Exhibits135: Chart on Canada - Year-over-year growth 2024-2029 (%)
- Exhibits136: Data Table on Canada - Year-over-year growth 2024-2029 (%)
- Exhibits137: Chart on Germany - Market size and forecast 2024-2029 ($ billion)
- Exhibits138: Data Table on Germany - Market size and forecast 2024-2029 ($ billion)
- Exhibits139: Chart on Germany - Year-over-year growth 2024-2029 (%)
- Exhibits140: Data Table on Germany - Year-over-year growth 2024-2029 (%)
- Exhibits141: Chart on China - Market size and forecast 2024-2029 ($ billion)
- Exhibits142: Data Table on China - Market size and forecast 2024-2029 ($ billion)
- Exhibits143: Chart on China - Year-over-year growth 2024-2029 (%)
- Exhibits144: Data Table on China - Year-over-year growth 2024-2029 (%)
- Exhibits145: Chart on UK - Market size and forecast 2024-2029 ($ billion)
- Exhibits146: Data Table on UK - Market size and forecast 2024-2029 ($ billion)
- Exhibits147: Chart on UK - Year-over-year growth 2024-2029 (%)
- Exhibits148: Data Table on UK - Year-over-year growth 2024-2029 (%)
- Exhibits149: Chart on France - Market size and forecast 2024-2029 ($ billion)
- Exhibits150: Data Table on France - Market size and forecast 2024-2029 ($ billion)
- Exhibits151: Chart on France - Year-over-year growth 2024-2029 (%)
- Exhibits152: Data Table on France - Year-over-year growth 2024-2029 (%)
- Exhibits153: Chart on Mexico - Market size and forecast 2024-2029 ($ billion)
- Exhibits154: Data Table on Mexico - Market size and forecast 2024-2029 ($ billion)
- Exhibits155: Chart on Mexico - Year-over-year growth 2024-2029 (%)
- Exhibits156: Data Table on Mexico - Year-over-year growth 2024-2029 (%)
- Exhibits157: Chart on India - Market size and forecast 2024-2029 ($ billion)
- Exhibits158: Data Table on India - Market size and forecast 2024-2029 ($ billion)
- Exhibits159: Chart on India - Year-over-year growth 2024-2029 (%)
- Exhibits160: Data Table on India - Year-over-year growth 2024-2029 (%)
- Exhibits161: Chart on Brazil - Market size and forecast 2024-2029 ($ billion)
- Exhibits162: Data Table on Brazil - Market size and forecast 2024-2029 ($ billion)
- Exhibits163: Chart on Brazil - Year-over-year growth 2024-2029 (%)
- Exhibits164: Data Table on Brazil - Year-over-year growth 2024-2029 (%)
- Exhibits165: Chart on Japan - Market size and forecast 2024-2029 ($ billion)
- Exhibits166: Data Table on Japan - Market size and forecast 2024-2029 ($ billion)
- Exhibits167: Chart on Japan - Year-over-year growth 2024-2029 (%)
- Exhibits168: Data Table on Japan - Year-over-year growth 2024-2029 (%)
- Exhibits169: Market opportunity By Geographical Landscape ($ billion)
- Exhibits170: Data Tables on Market opportunity By Geographical Landscape ($ billion)
- Exhibits171: Impact of drivers and challenges in 2024 and 2029
- Exhibits172: Overview on criticality of inputs and factors of differentiation
- Exhibits173: Overview on factors of disruption
- Exhibits174: Impact of key risks on business
- Exhibits175: Companies covered
- Exhibits176: Company ranking index
- Exhibits177: Matrix on companies position and classification
- Exhibits178: Alphabet Inc. - Overview
- Exhibits179: Alphabet Inc. - Business segments
- Exhibits180: Alphabet Inc. - Key offerings
- Exhibits181: Alphabet Inc. - Segment focus
- Exhibits182: SWOT
- Exhibits183: Amazon.com Inc. - Overview
- Exhibits184: Amazon.com Inc. - Business segments
- Exhibits185: Amazon.com Inc. - Key news
- Exhibits186: Amazon.com Inc. - Key offerings
- Exhibits187: Amazon.com Inc. - Segment focus
- Exhibits188: SWOT
- Exhibits189: AT and T Inc. - Overview
- Exhibits190: AT and T Inc. - Business segments
- Exhibits191: AT and T Inc. - Key news
- Exhibits192: AT and T Inc. - Key offerings
- Exhibits193: AT and T Inc. - Segment focus
- Exhibits194: SWOT
- Exhibits195: Cisco Systems Inc. - Overview
- Exhibits196: Cisco Systems Inc. - Business segments
- Exhibits197: Cisco Systems Inc. - Key news
- Exhibits198: Cisco Systems Inc. - Key offerings
- Exhibits199: Cisco Systems Inc. - Segment focus
- Exhibits200: SWOT
- Exhibits201: Furukawa Electric Co. Ltd. - Overview
- Exhibits202: Furukawa Electric Co. Ltd. - Product / Service
- Exhibits203: Furukawa Electric Co. Ltd. - Key news
- Exhibits204: Furukawa Electric Co. Ltd. - Key offerings
- Exhibits205: SWOT
- Exhibits206: General Electric Co. - Overview
- Exhibits207: General Electric Co. - Business segments
- Exhibits208: General Electric Co. - Key news
- Exhibits209: General Electric Co. - Key offerings
- Exhibits210: General Electric Co. - Segment focus
- Exhibits211: SWOT
- Exhibits212: Honeywell International Inc. - Overview
- Exhibits213: Honeywell International Inc. - Business segments
- Exhibits214: Honeywell International Inc. - Key news
- Exhibits215: Honeywell International Inc. - Key offerings
- Exhibits216: Honeywell International Inc. - Segment focus
- Exhibits217: SWOT
- Exhibits218: Intel Corp. - Overview
- Exhibits219: Intel Corp. - Business segments
- Exhibits220: Intel Corp. - Key news
- Exhibits221: Intel Corp. - Key offerings
- Exhibits222: Intel Corp. - Segment focus
- Exhibits223: SWOT
- Exhibits224: International Business Machines Corp. - Overview
- Exhibits225: International Business Machines Corp. - Business segments
- Exhibits226: International Business Machines Corp. - Key news
- Exhibits227: International Business Machines Corp. - Key offerings
- Exhibits228: International Business Machines Corp. - Segment focus
- Exhibits229: SWOT
- Exhibits230: Microsoft Corp. - Overview
- Exhibits231: Microsoft Corp. - Business segments
- Exhibits232: Microsoft Corp. - Key news
- Exhibits233: Microsoft Corp. - Key offerings
- Exhibits234: Microsoft Corp. - Segment focus
- Exhibits235: SWOT
- Exhibits236: Oracle Corp. - Overview
- Exhibits237: Oracle Corp. - Business segments
- Exhibits238: Oracle Corp. - Key news
- Exhibits239: Oracle Corp. - Key offerings
- Exhibits240: Oracle Corp. - Segment focus
- Exhibits241: SWOT
- Exhibits242: Robert Bosch GmbH - Overview
- Exhibits243: Robert Bosch GmbH - Product / Service
- Exhibits244: Robert Bosch GmbH - Key news
- Exhibits245: Robert Bosch GmbH - Key offerings
- Exhibits246: SWOT
- Exhibits247: SAP SE - Overview
- Exhibits248: SAP SE - Business segments
- Exhibits249: SAP SE - Key news
- Exhibits250: SAP SE - Key offerings
- Exhibits251: SAP SE - Segment focus
- Exhibits252: SWOT
- Exhibits253: Siemens AG - Overview
- Exhibits254: Siemens AG - Business segments
- Exhibits255: Siemens AG - Key news
- Exhibits256: Siemens AG - Key offerings
- Exhibits257: Siemens AG - Segment focus
- Exhibits258: SWOT
- Exhibits259: Wipro Ltd. - Overview
- Exhibits260: Wipro Ltd. - Business segments
- Exhibits261: Wipro Ltd. - Key news
- Exhibits262: Wipro Ltd. - Key offerings
- Exhibits263: Wipro Ltd. - Segment focus
- Exhibits264: SWOT
- Exhibits265: Inclusions checklist
- Exhibits266: Exclusions checklist
- Exhibits267: Currency conversion rates for US$
- Exhibits268: Research methodology
- Exhibits269: Information sources
- Exhibits270: Data validation
- Exhibits271: Validation techniques employed for market sizing
- Exhibits272: Data synthesis
- Exhibits273: 360 degree market analysis
- Exhibits274: List of abbreviations
The internet of things in healthcare market is forecasted to grow by USD 297.9 bn during 2024-2029, accelerating at a CAGR of 18.4% during the forecast period. The report on the internet of things in healthcare market provides a holistic analysis, market size and forecast, trends, growth drivers, and challenges, as well as vendor analysis covering around 25 vendors.
The report offers an up-to-date analysis regarding the current market scenario, the latest trends and drivers, and the overall market environment. The market is driven by increasing remote patient monitoring, increasing use of wearables to monitor human health, and improving healthcare management through iot-enabled devices.
| Market Scope | |
|---|---|
| Base Year | 2025 |
| End Year | 2029 |
| Series Year | 2025-2029 |
| Growth Momentum | Accelerate |
| YOY 2025 | 15.8% |
| CAGR | 18.4% |
| Incremental Value | $297.9 bn |
The study was conducted using an objective combination of primary and secondary information including inputs from key participants in the industry. The report contains a comprehensive market size data, segment with regional analysis and vendor landscape in addition to an analysis of the key companies. Reports have historic and forecast data.
Technavio's internet of things in healthcare market is segmented as below:
By Type
- Medical devices
- Software and system application
- Connecting technologies
By Application
- Telemedicine
- Patient monitoring
- Clinical operation and workflow management
- Others
By End-user
- Hospitals and clinics
- Pharmaceutical and biotechnology companies
- Government and defence institutions
- Clinical research organizations
- Others
By Geographical Landscape
- North America
- Europe
- APAC
- South America
- Middle East and Africa
This study identifies the technological advancements in healthcare sector as one of the prime reasons driving the internet of things in healthcare market growth during the next few years. Also, emergence of smart hospitals and growing demand for telehealth will lead to sizable demand in the market.
The report on the internet of things in healthcare market covers the following areas:
- Internet Of Things In Healthcare Market sizing
- Internet Of Things In Healthcare Market forecast
- Internet Of Things In Healthcare Market industry analysis
The robust vendor analysis is designed to help clients improve their market position, and in line with this, this report provides a detailed analysis of several leading internet of things in healthcare market vendors that include Aeris Communications Inc., Alphabet Inc., Amazon.com Inc., AT and T Inc., Cisco Systems Inc., Furukawa Electric Co. Ltd., General Electric Co., Hewlett Packard Enterprise Co., Honeywell International Inc., Intel Corp., International Business Machines Corp., Koninklijke Philips NV, Microsoft Corp., Oracle Corp., PTC Inc., Robert Bosch GmbH, SAP SE, Siemens AG, Thales Group, and Wipro Ltd.. Also, the internet of things in healthcare market analysis report includes information on upcoming trends and challenges that will influence market growth. This is to help companies strategize and leverage all forthcoming growth opportunities.
The publisher presents a detailed picture of the market by the way of study, synthesis, and summation of data from multiple sources by an analysis of key parameters such as profit, pricing, competition, and promotions. It presents various market facets by identifying the key industry influencers. The data presented is comprehensive, reliable, and a result of extensive primary and secondary research. The market research reports provide a complete competitive landscape and an in-depth vendor selection methodology and analysis using qualitative and quantitative research to forecast accurate market growth.
Table of Contents
1 Executive Summary
- 1.1 Market overview
- Executive Summary - Chart on Market Overview
- Executive Summary - Data Table on Market Overview
- Executive Summary - Chart on Global Market Characteristics
- Executive Summary - Chart on Market By Geographical Landscape
- Executive Summary - Chart on Market Segmentation by Type
- Executive Summary - Chart on Market Segmentation by Application
- Executive Summary - Chart on Market Segmentation by End-user
- Executive Summary - Chart on Incremental Growth
- Executive Summary - Data Table on Incremental Growth
- Executive Summary - Chart on Company Market Positioning
2 Technavio Analysis
- 2.1 Analysis of price sensitivity, lifecycle, customer purchase basket, adoption rates, and purchase criteria
- Analysis of price sensitivity, lifecycle, customer purchase basket, adoption rates, and purchase criteria
- 2.2 Criticality of inputs and Factors of differentiation
- Overview on criticality of inputs and factors of differentiation
- 2.3 Factors of disruption
- Overview on factors of disruption
- 2.4 Impact of drivers and challenges
- Impact of drivers and challenges in 2024 and 2029
3 Market Landscape
- 3.1 Market ecosystem
- Parent Market
- Data Table on - Parent Market
- 3.2 Market characteristics
- Market characteristics analysis
- 3.3 Value chain analysis
- Value chain analysis
4 Market Sizing
- 4.1 Market definition
- Offerings of companies included in the market definition
- 4.2 Market segment analysis
- Market segments
- 4.3 Market size 2024
- 4.4 Market outlook: Forecast for 2024-2029
- Chart on Global - Market size and forecast 2024-2029 ($ billion)
- Data Table on Global - Market size and forecast 2024-2029 ($ billion)
- Chart on Global Market: Year-over-year growth 2024-2029 (%)
- Data Table on Global Market: Year-over-year growth 2024-2029 (%)
5 Historic Market Size
- 5.1 Global Internet Of Things In Healthcare Market 2019 - 2023
- Historic Market Size - Data Table on Global Internet Of Things In Healthcare Market 2019 - 2023 ($ billion)
- 5.2 Type segment analysis 2019 - 2023
- Historic Market Size - Type Segment 2019 - 2023 ($ billion)
- 5.3 Application segment analysis 2019 - 2023
- Historic Market Size - Application Segment 2019 - 2023 ($ billion)
- 5.4 End-user segment analysis 2019 - 2023
- Historic Market Size - End-user Segment 2019 - 2023 ($ billion)
- 5.5 Geography segment analysis 2019 - 2023
- Historic Market Size - Geography Segment 2019 - 2023 ($ billion)
- 5.6 Country segment analysis 2019 - 2023
- Historic Market Size - Country Segment 2019 - 2023 ($ billion)
6 Qualitative Analysis
- 6.1 The AI impact on global internet of things in healthcare market
7 Five Forces Analysis
- 7.1 Five forces summary
- Five forces analysis - Comparison between 2024 and 2029
- 7.2 Bargaining power of buyers
- Bargaining power of buyers - Impact of key factors 2024 and 2029
- 7.3 Bargaining power of suppliers
- Bargaining power of suppliers - Impact of key factors in 2024 and 2029
- 7.4 Threat of new entrants
- Threat of new entrants - Impact of key factors in 2024 and 2029
- 7.5 Threat of substitutes
- Threat of substitutes - Impact of key factors in 2024 and 2029
- 7.6 Threat of rivalry
- Threat of rivalry - Impact of key factors in 2024 and 2029
- 7.7 Market condition
- Chart on Market condition - Five forces 2024 and 2029
8 Market Segmentation by Type
- 8.1 Market segments
- Chart on Type - Market share 2024-2029 (%)
- Data Table on Type - Market share 2024-2029 (%)
- 8.2 Comparison by Type
- Chart on Comparison by Type
- Data Table on Comparison by Type
- 8.3 Medical devices - Market size and forecast 2024-2029
- Chart on Medical devices - Market size and forecast 2024-2029 ($ billion)
- Data Table on Medical devices - Market size and forecast 2024-2029 ($ billion)
- Chart on Medical devices - Year-over-year growth 2024-2029 (%)
- Data Table on Medical devices - Year-over-year growth 2024-2029 (%)
- 8.4 Software and system application - Market size and forecast 2024-2029
- Chart on Software and system application - Market size and forecast 2024-2029 ($ billion)
- Data Table on Software and system application - Market size and forecast 2024-2029 ($ billion)
- Chart on Software and system application - Year-over-year growth 2024-2029 (%)
- Data Table on Software and system application - Year-over-year growth 2024-2029 (%)
- 8.5 Connecting technologies - Market size and forecast 2024-2029
- Chart on Connecting technologies - Market size and forecast 2024-2029 ($ billion)
- Data Table on Connecting technologies - Market size and forecast 2024-2029 ($ billion)
- Chart on Connecting technologies - Year-over-year growth 2024-2029 (%)
- Data Table on Connecting technologies - Year-over-year growth 2024-2029 (%)
- 8.6 Market opportunity by Type
- Market opportunity by Type ($ billion)
- Data Table on Market opportunity by Type ($ billion)
9 Market Segmentation by Application
- 9.1 Market segments
- Chart on Application - Market share 2024-2029 (%)
- Data Table on Application - Market share 2024-2029 (%)
- 9.2 Comparison by Application
- Chart on Comparison by Application
- Data Table on Comparison by Application
- 9.3 Telemedicine - Market size and forecast 2024-2029
- Chart on Telemedicine - Market size and forecast 2024-2029 ($ billion)
- Data Table on Telemedicine - Market size and forecast 2024-2029 ($ billion)
- Chart on Telemedicine - Year-over-year growth 2024-2029 (%)
- Data Table on Telemedicine - Year-over-year growth 2024-2029 (%)
- 9.4 Patient monitoring - Market size and forecast 2024-2029
- Chart on Patient monitoring - Market size and forecast 2024-2029 ($ billion)
- Data Table on Patient monitoring - Market size and forecast 2024-2029 ($ billion)
- Chart on Patient monitoring - Year-over-year growth 2024-2029 (%)
- Data Table on Patient monitoring - Year-over-year growth 2024-2029 (%)
- 9.5 Clinical operation and workflow management - Market size and forecast 2024-2029
- Chart on Clinical operation and workflow management - Market size and forecast 2024-2029 ($ billion)
- Data Table on Clinical operation and workflow management - Market size and forecast 2024-2029 ($ billion)
- Chart on Clinical operation and workflow management - Year-over-year growth 2024-2029 (%)
- Data Table on Clinical operation and workflow management - Year-over-year growth 2024-2029 (%)
- 9.6 Others - Market size and forecast 2024-2029
- Chart on Others - Market size and forecast 2024-2029 ($ billion)
- Data Table on Others - Market size and forecast 2024-2029 ($ billion)
- Chart on Others - Year-over-year growth 2024-2029 (%)
- Data Table on Others - Year-over-year growth 2024-2029 (%)
- 9.7 Market opportunity by Application
- Market opportunity by Application ($ billion)
- Data Table on Market opportunity by Application ($ billion)
10 Market Segmentation by End-user
- 10.1 Market segments
- Chart on End-user - Market share 2024-2029 (%)
- Data Table on End-user - Market share 2024-2029 (%)
- 10.2 Comparison by End-user
- Chart on Comparison by End-user
- Data Table on Comparison by End-user
- 10.3 Hospitals and clinics - Market size and forecast 2024-2029
- Chart on Hospitals and clinics - Market size and forecast 2024-2029 ($ billion)
- Data Table on Hospitals and clinics - Market size and forecast 2024-2029 ($ billion)
- Chart on Hospitals and clinics - Year-over-year growth 2024-2029 (%)
- Data Table on Hospitals and clinics - Year-over-year growth 2024-2029 (%)
- 10.4 Pharmaceutical and biotechnology companies - Market size and forecast 2024-2029
- Chart on Pharmaceutical and biotechnology companies - Market size and forecast 2024-2029 ($ billion)
- Data Table on Pharmaceutical and biotechnology companies - Market size and forecast 2024-2029 ($ billion)
- Chart on Pharmaceutical and biotechnology companies - Year-over-year growth 2024-2029 (%)
- Data Table on Pharmaceutical and biotechnology companies - Year-over-year growth 2024-2029 (%)
- 10.5 Government and defence institutions - Market size and forecast 2024-2029
- Chart on Government and defence institutions - Market size and forecast 2024-2029 ($ billion)
- Data Table on Government and defence institutions - Market size and forecast 2024-2029 ($ billion)
- Chart on Government and defence institutions - Year-over-year growth 2024-2029 (%)
- Data Table on Government and defence institutions - Year-over-year growth 2024-2029 (%)
- 10.6 Clinical research organizations - Market size and forecast 2024-2029
- Chart on Clinical research organizations - Market size and forecast 2024-2029 ($ billion)
- Data Table on Clinical research organizations - Market size and forecast 2024-2029 ($ billion)
- Chart on Clinical research organizations - Year-over-year growth 2024-2029 (%)
- Data Table on Clinical research organizations - Year-over-year growth 2024-2029 (%)
- 10.7 Others - Market size and forecast 2024-2029
- Chart on Others - Market size and forecast 2024-2029 ($ billion)
- Data Table on Others - Market size and forecast 2024-2029 ($ billion)
- Chart on Others - Year-over-year growth 2024-2029 (%)
- Data Table on Others - Year-over-year growth 2024-2029 (%)
- 10.8 Market opportunity by End-user
- Market opportunity by End-user ($ billion)
- Data Table on Market opportunity by End-user ($ billion)
11 Customer Landscape
- 11.1 Customer landscape overview
- Analysis of price sensitivity, lifecycle, customer purchase basket, adoption rates, and purchase criteria
12 Geographic Landscape
- 12.1 Geographic segmentation
- Chart on Market share By Geographical Landscape 2024-2029 (%)
- Data Table on Market share By Geographical Landscape 2024-2029 (%)
- 12.2 Geographic comparison
- Chart on Geographic comparison
- Data Table on Geographic comparison
- 12.3 North America - Market size and forecast 2024-2029
- Chart on North America - Market size and forecast 2024-2029 ($ billion)
- Data Table on North America - Market size and forecast 2024-2029 ($ billion)
- Chart on North America - Year-over-year growth 2024-2029 (%)
- Data Table on North America - Year-over-year growth 2024-2029 (%)
- 12.4 Europe - Market size and forecast 2024-2029
- Chart on Europe - Market size and forecast 2024-2029 ($ billion)
- Data Table on Europe - Market size and forecast 2024-2029 ($ billion)
- Chart on Europe - Year-over-year growth 2024-2029 (%)
- Data Table on Europe - Year-over-year growth 2024-2029 (%)
- 12.5 APAC - Market size and forecast 2024-2029
- Chart on APAC - Market size and forecast 2024-2029 ($ billion)
- Data Table on APAC - Market size and forecast 2024-2029 ($ billion)
- Chart on APAC - Year-over-year growth 2024-2029 (%)
- Data Table on APAC - Year-over-year growth 2024-2029 (%)
- 12.6 South America - Market size and forecast 2024-2029
- Chart on South America - Market size and forecast 2024-2029 ($ billion)
- Data Table on South America - Market size and forecast 2024-2029 ($ billion)
- Chart on South America - Year-over-year growth 2024-2029 (%)
- Data Table on South America - Year-over-year growth 2024-2029 (%)
- 12.7 Middle East and Africa - Market size and forecast 2024-2029
- Chart on Middle East and Africa - Market size and forecast 2024-2029 ($ billion)
- Data Table on Middle East and Africa - Market size and forecast 2024-2029 ($ billion)
- Chart on Middle East and Africa - Year-over-year growth 2024-2029 (%)
- Data Table on Middle East and Africa - Year-over-year growth 2024-2029 (%)
- 12.8 US - Market size and forecast 2024-2029
- Chart on US - Market size and forecast 2024-2029 ($ billion)
- Data Table on US - Market size and forecast 2024-2029 ($ billion)
- Chart on US - Year-over-year growth 2024-2029 (%)
- Data Table on US - Year-over-year growth 2024-2029 (%)
- 12.9 Canada - Market size and forecast 2024-2029
- Chart on Canada - Market size and forecast 2024-2029 ($ billion)
- Data Table on Canada - Market size and forecast 2024-2029 ($ billion)
- Chart on Canada - Year-over-year growth 2024-2029 (%)
- Data Table on Canada - Year-over-year growth 2024-2029 (%)
- 12.10 Germany - Market size and forecast 2024-2029
- Chart on Germany - Market size and forecast 2024-2029 ($ billion)
- Data Table on Germany - Market size and forecast 2024-2029 ($ billion)
- Chart on Germany - Year-over-year growth 2024-2029 (%)
- Data Table on Germany - Year-over-year growth 2024-2029 (%)
- 12.11 China - Market size and forecast 2024-2029
- Chart on China - Market size and forecast 2024-2029 ($ billion)
- Data Table on China - Market size and forecast 2024-2029 ($ billion)
- Chart on China - Year-over-year growth 2024-2029 (%)
- Data Table on China - Year-over-year growth 2024-2029 (%)
- 12.12 UK - Market size and forecast 2024-2029
- Chart on UK - Market size and forecast 2024-2029 ($ billion)
- Data Table on UK - Market size and forecast 2024-2029 ($ billion)
- Chart on UK - Year-over-year growth 2024-2029 (%)
- Data Table on UK - Year-over-year growth 2024-2029 (%)
- 12.13 France - Market size and forecast 2024-2029
- Chart on France - Market size and forecast 2024-2029 ($ billion)
- Data Table on France - Market size and forecast 2024-2029 ($ billion)
- Chart on France - Year-over-year growth 2024-2029 (%)
- Data Table on France - Year-over-year growth 2024-2029 (%)
- 12.14 Mexico - Market size and forecast 2024-2029
- Chart on Mexico - Market size and forecast 2024-2029 ($ billion)
- Data Table on Mexico - Market size and forecast 2024-2029 ($ billion)
- Chart on Mexico - Year-over-year growth 2024-2029 (%)
- Data Table on Mexico - Year-over-year growth 2024-2029 (%)
- 12.15 India - Market size and forecast 2024-2029
- Chart on India - Market size and forecast 2024-2029 ($ billion)
- Data Table on India - Market size and forecast 2024-2029 ($ billion)
- Chart on India - Year-over-year growth 2024-2029 (%)
- Data Table on India - Year-over-year growth 2024-2029 (%)
- 12.16 Brazil - Market size and forecast 2024-2029
- Chart on Brazil - Market size and forecast 2024-2029 ($ billion)
- Data Table on Brazil - Market size and forecast 2024-2029 ($ billion)
- Chart on Brazil - Year-over-year growth 2024-2029 (%)
- Data Table on Brazil - Year-over-year growth 2024-2029 (%)
- 12.17 Japan - Market size and forecast 2024-2029
- Chart on Japan - Market size and forecast 2024-2029 ($ billion)
- Data Table on Japan - Market size and forecast 2024-2029 ($ billion)
- Chart on Japan - Year-over-year growth 2024-2029 (%)
- Data Table on Japan - Year-over-year growth 2024-2029 (%)
- 12.18 Market opportunity By Geographical Landscape
- Market opportunity By Geographical Landscape ($ billion)
- Data Tables on Market opportunity By Geographical Landscape ($ billion)
13 Drivers, Challenges, and Opportunity/Restraints
- 13.1 Market drivers
- 13.2 Market challenges
- 13.3 Impact of drivers and challenges
- Impact of drivers and challenges in 2024 and 2029
- 13.4 Market opportunities/restraints
14 Competitive Landscape
- 14.1 Overview
- 14.2 Competitive Landscape
- Overview on criticality of inputs and factors of differentiation
- 14.3 Landscape disruption
- Overview on factors of disruption
- 14.4 Industry risks
- Impact of key risks on business
15 Competitive Analysis
- 15.1 Companies profiled
- Companies covered
- 15.2 Company ranking index
- Company ranking index
- 15.3 Market positioning of companies
- Matrix on companies position and classification
- 15.4 Alphabet Inc.
- Alphabet Inc. - Overview
- Alphabet Inc. - Business segments
- Alphabet Inc. - Key offerings
- Alphabet Inc. - Segment focus
- SWOT
- 15.5 Amazon.com Inc.
- Amazon.com Inc. - Overview
- Amazon.com Inc. - Business segments
- Amazon.com Inc. - Key news
- Amazon.com Inc. - Key offerings
- Amazon.com Inc. - Segment focus
- SWOT
- 15.6 AT and T Inc.
- AT and T Inc. - Overview
- AT and T Inc. - Business segments
- AT and T Inc. - Key news
- AT and T Inc. - Key offerings
- AT and T Inc. - Segment focus
- SWOT
- 15.7 Cisco Systems Inc.
- Cisco Systems Inc. - Overview
- Cisco Systems Inc. - Business segments
- Cisco Systems Inc. - Key news
- Cisco Systems Inc. - Key offerings
- Cisco Systems Inc. - Segment focus
- SWOT
- 15.8 Furukawa Electric Co. Ltd.
- Furukawa Electric Co. Ltd. - Overview
- Furukawa Electric Co. Ltd. - Product / Service
- Furukawa Electric Co. Ltd. - Key news
- Furukawa Electric Co. Ltd. - Key offerings
- SWOT
- 15.9 General Electric Co.
- General Electric Co. - Overview
- General Electric Co. - Business segments
- General Electric Co. - Key news
- General Electric Co. - Key offerings
- General Electric Co. - Segment focus
- SWOT
- 15.10 Honeywell International Inc.
- Honeywell International Inc. - Overview
- Honeywell International Inc. - Business segments
- Honeywell International Inc. - Key news
- Honeywell International Inc. - Key offerings
- Honeywell International Inc. - Segment focus
- SWOT
- 15.11 Intel Corp.
- Intel Corp. - Overview
- Intel Corp. - Business segments
- Intel Corp. - Key news
- Intel Corp. - Key offerings
- Intel Corp. - Segment focus
- SWOT
- 15.12 International Business Machines Corp.
- International Business Machines Corp. - Overview
- International Business Machines Corp. - Business segments
- International Business Machines Corp. - Key news
- International Business Machines Corp. - Key offerings
- International Business Machines Corp. - Segment focus
- SWOT
- 15.13 Microsoft Corp.
- Microsoft Corp. - Overview
- Microsoft Corp. - Business segments
- Microsoft Corp. - Key news
- Microsoft Corp. - Key offerings
- Microsoft Corp. - Segment focus
- SWOT
- 15.14 Oracle Corp.
- Oracle Corp. - Overview
- Oracle Corp. - Business segments
- Oracle Corp. - Key news
- Oracle Corp. - Key offerings
- Oracle Corp. - Segment focus
- SWOT
- 15.15 Robert Bosch GmbH
- Robert Bosch GmbH - Overview
- Robert Bosch GmbH - Product / Service
- Robert Bosch GmbH - Key news
- Robert Bosch GmbH - Key offerings
- SWOT
- 15.16 SAP SE
- SAP SE - Overview
- SAP SE - Business segments
- SAP SE - Key news
- SAP SE - Key offerings
- SAP SE - Segment focus
- SWOT
- 15.17 Siemens AG
- Siemens AG - Overview
- Siemens AG - Business segments
- Siemens AG - Key news
- Siemens AG - Key offerings
- Siemens AG - Segment focus
- SWOT
- 15.18 Wipro Ltd.
- Wipro Ltd. - Overview
- Wipro Ltd. - Business segments
- Wipro Ltd. - Key news
- Wipro Ltd. - Key offerings
- Wipro Ltd. - Segment focus
- SWOT
16 Appendix
- 16.1 Scope of the report
- 16.2 Inclusions and exclusions checklist
- Inclusions checklist
- Exclusions checklist
- 16.3 Currency conversion rates for US$
- Currency conversion rates for US$
- 16.4 Research methodology
- Research methodology
- 16.5 Data procurement
- Information sources
- 16.6 Data validation
- Data validation
- 16.7 Validation techniques employed for market sizing
- Validation techniques employed for market sizing
- 16.8 Data synthesis
- Data synthesis
- 16.9 360 degree market analysis
- 360 degree market analysis
- 16.10 List of abbreviations
- List of abbreviations

